Georgia Kegs Market Outlook | Revenue, Industry, Forecast, Size, Companies, Analysis, COVID-19 IMPACT, Trends, Value, Growth & Share
Market Forecast By Material (Plastic, Tin, Stainless Steel), By Capacity (Up to 20 Liter, 20 Liter to 40 Liter, 40 Liter to 60 Liter, Above 60 Liter), By End Use (Alcoholic Beverages, Non-Alcoholic Beverages, Cooking Oil, Chemicals, Others), By Distribution Channel (Supermarket/Hypermarket, Commercial Liquor Store, Others) And Competitive Landscape
| Product Code: ETC253560 | Publication Date: Aug 2022 | Updated Date: Aug 2025 | Product Type: Market Research Report | |
| Publisher: 6Wresearch | Author: Ravi Bhandari | No. of Pages: 75 | No. of Figures: 35 | No. of Tables: 20 |
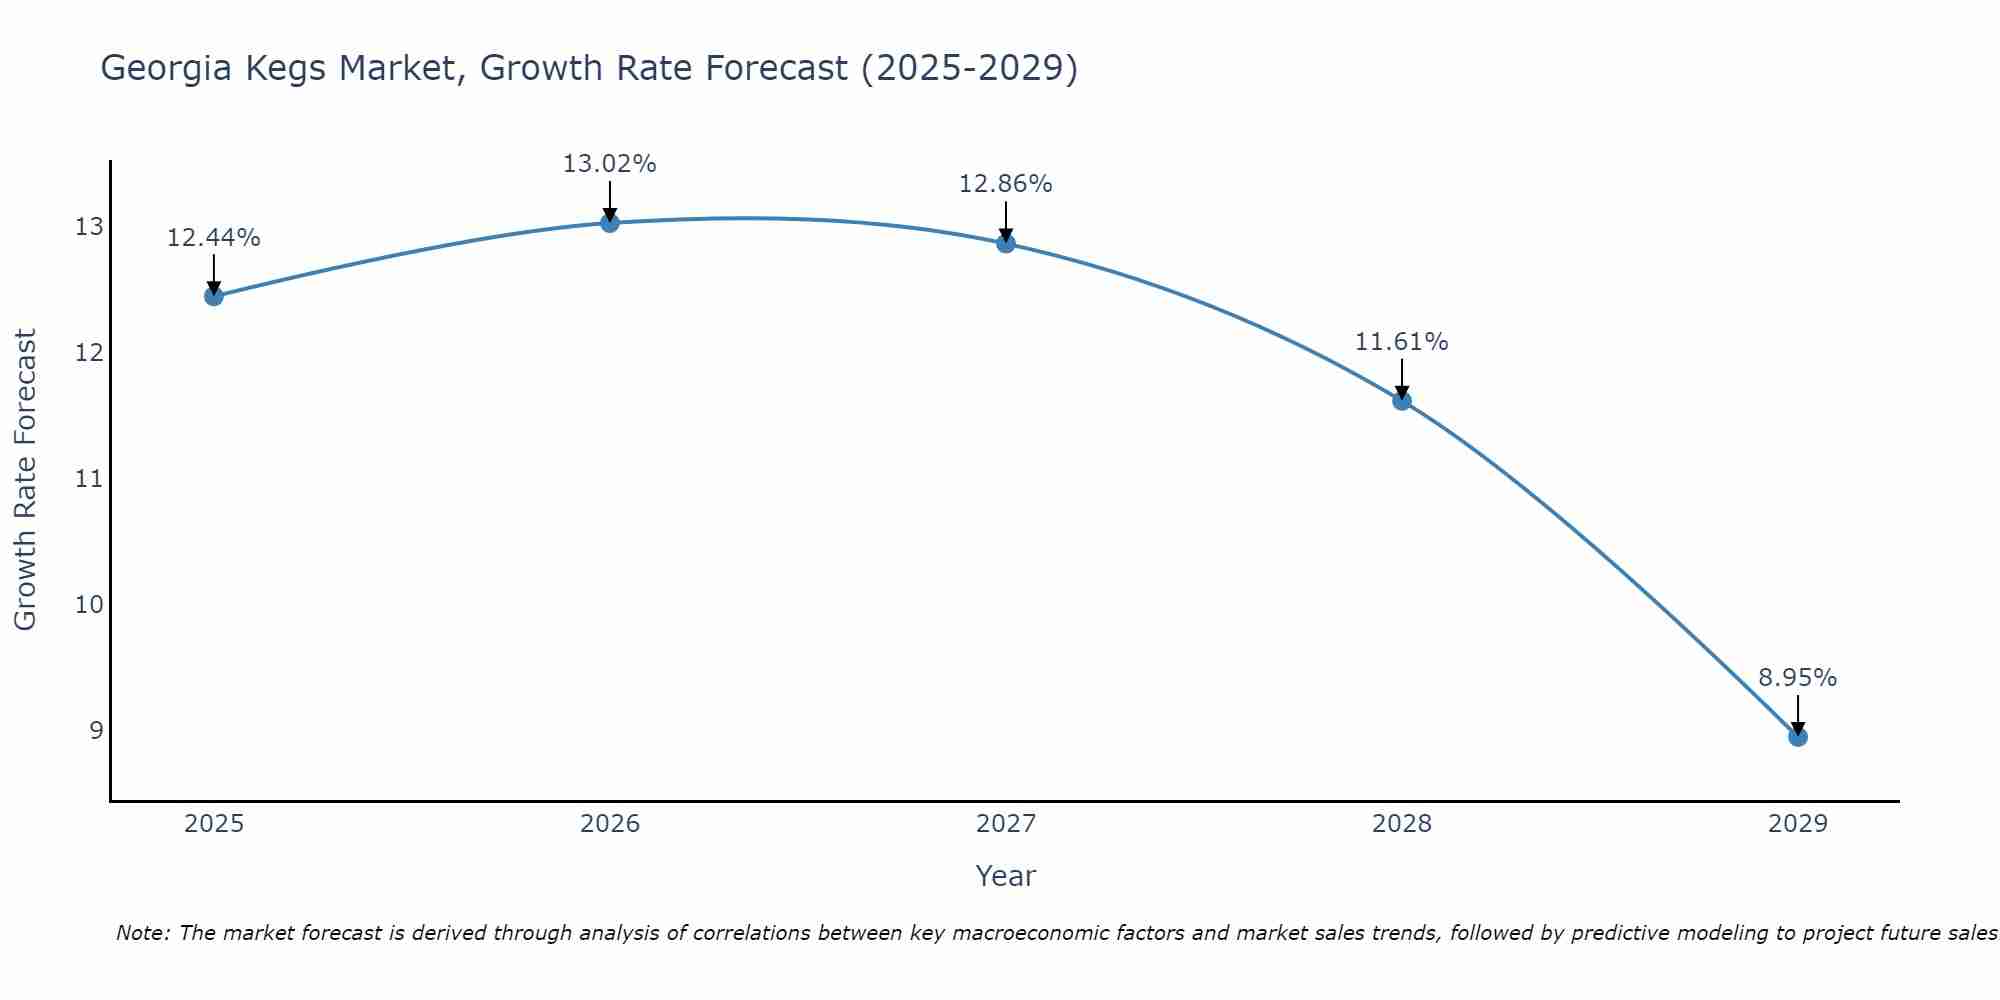
Georgia Kegs Market Size Growth Rate
The Georgia Kegs Market is projected to witness mixed growth rate patterns during 2025 to 2029. Growth accelerates to 13.02% in 2026, following an initial rate of 12.44%, before easing to 8.95% at the end of the period.
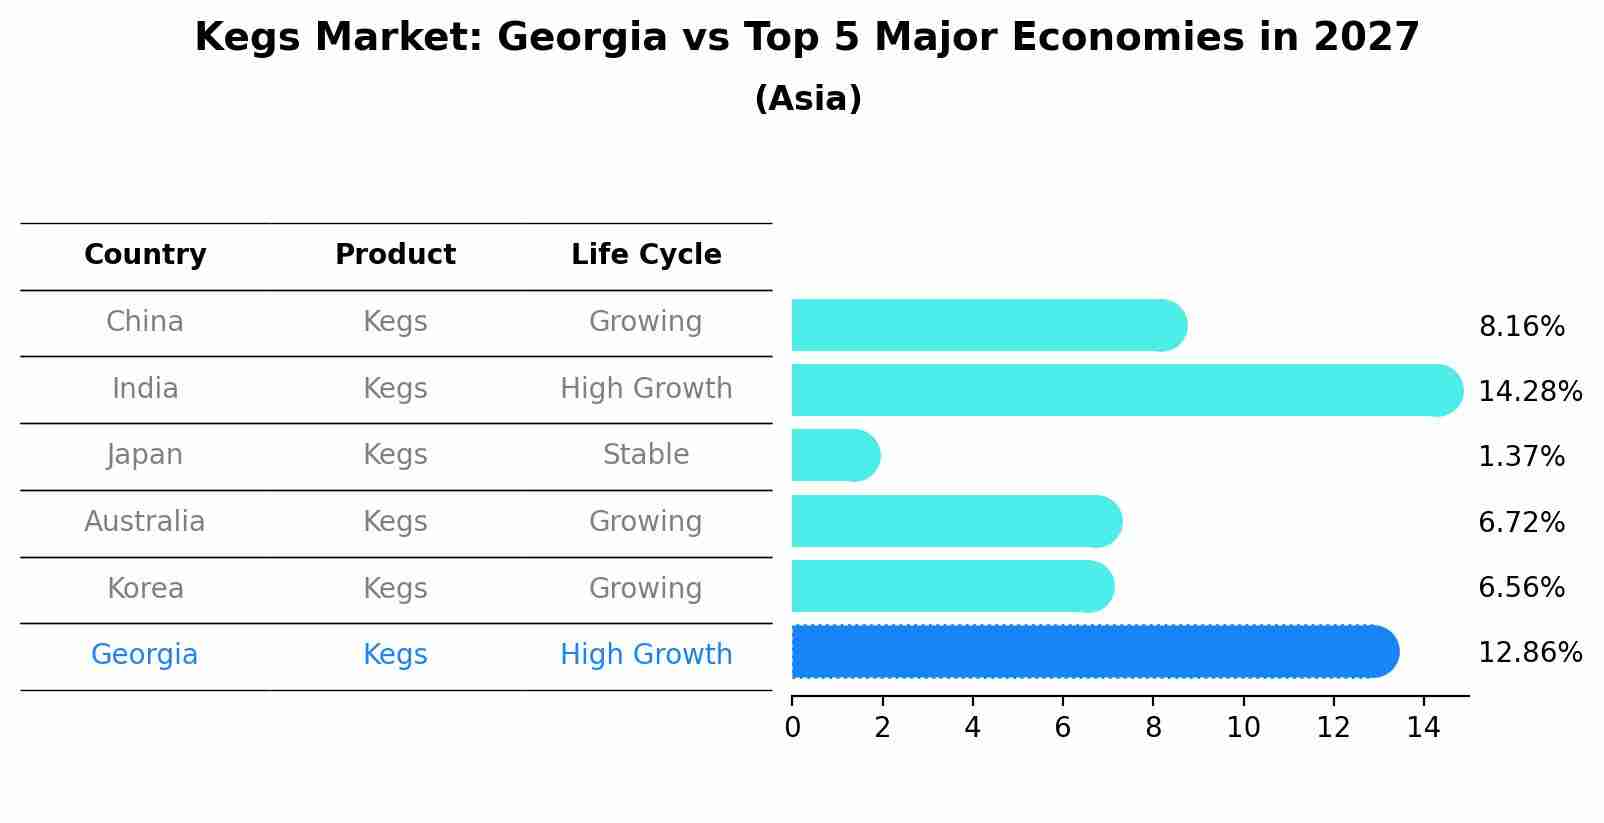
Kegs Market: Georgia vs Top 5 Major Economies in 2027 (Asia)
In the Asia region, the Kegs market in Georgia is projected to expand at a high growth rate of 12.86% by 2027. The largest economy is China, followed by India, Japan, Australia and South Korea.
Georgia Kegs Market Overview
In Georgia, the kegs market is witnessing robust growth fueled by the thriving hospitality industry and the rising popularity of craft beer. Kegs serve as essential vessels for storing and dispensing various beverages, including beer, cider, and kombucha. With an increasing number of breweries and bars across the country, the demand for kegs is consistently growing. Additionally, the shift towards eco-friendly and reusable packaging solutions is driving the adoption of kegs among beverage producers, further boosting market growth.
Drivers of the market
The rising popularity of craft beer and microbreweries in Georgia is a significant driver for the kegs market. As the beer industry expands, the demand for kegs for packaging and distribution purposes increases correspondingly.
Challenges of the market
The Georgia Kegs Market faces significant logistical challenges, particularly in terms of distribution and storage. Ensuring the timely delivery of kegs to various retail outlets and maintaining optimal conditions for product freshness can be demanding tasks, especially considering the perishable nature of certain beverages.
Government Policy of the market
In response to the growing demand for kegs in the beverage industry, the Georgian government has enacted policies to support the kegs market. These policies include providing incentives for the establishment of keg manufacturing facilities, streamlining regulatory processes for keg producers, and fostering partnerships between keg manufacturers and beverage companies to promote the use of kegs as a sustainable packaging solution.
Key Highlights of the Report:
- Georgia Kegs Market Outlook
- Market Size of Georgia Kegs Market, 2021
- Forecast of Georgia Kegs Market, 2028
- Historical Data and Forecast of Georgia Kegs Revenues & Volume for the Period 2018 - 2028
- Georgia Kegs Market Trend Evolution
- Georgia Kegs Market Drivers and Challenges
- Georgia Kegs Price Trends
- Georgia Kegs Porter's Five Forces
- Georgia Kegs Industry Life Cycle
- Historical Data and Forecast of Georgia Kegs Market Revenues & Volume By Material for the Period 2018 - 2028
- Historical Data and Forecast of Georgia Kegs Market Revenues & Volume By Plastic for the Period 2018 - 2028
- Historical Data and Forecast of Georgia Kegs Market Revenues & Volume By Tin for the Period 2018 - 2028
- Historical Data and Forecast of Georgia Kegs Market Revenues & Volume By Stainless Steel for the Period 2018 - 2028
- Historical Data and Forecast of Georgia Kegs Market Revenues & Volume By Capacity for the Period 2018 - 2028
- Historical Data and Forecast of Georgia Kegs Market Revenues & Volume By Up to 20 Liter for the Period 2018 - 2028
- Historical Data and Forecast of Georgia Kegs Market Revenues & Volume By 20 Liter to 40 Liter for the Period 2018 - 2028
- Historical Data and Forecast of Georgia Kegs Market Revenues & Volume By 40 Liter to 60 Liter for the Period 2018 - 2028
- Historical Data and Forecast of Georgia Kegs Market Revenues & Volume By Above 60 Liter for the Period 2018 - 2028
- Historical Data and Forecast of Georgia Kegs Market Revenues & Volume By End Use for the Period 2018 - 2028
- Historical Data and Forecast of Georgia Kegs Market Revenues & Volume By Alcoholic Beverages for the Period 2018 - 2028
- Historical Data and Forecast of Georgia Kegs Market Revenues & Volume By Non-Alcoholic Beverages for the Period 2018 - 2028
- Historical Data and Forecast of Georgia Kegs Market Revenues & Volume By Cooking Oil for the Period 2018 - 2028
- Historical Data and Forecast of Georgia Kegs Market Revenues & Volume By Chemicals for the Period 2018 - 2028
- Historical Data and Forecast of Georgia Kegs Market Revenues & Volume By Others for the Period 2018 - 2028
- Historical Data and Forecast of Georgia Kegs Market Revenues & Volume By Distribution Channel for the Period 2018 - 2028
- Historical Data and Forecast of Georgia Kegs Market Revenues & Volume By Supermarket/Hypermarket for the Period 2018 - 2028
- Historical Data and Forecast of Georgia Kegs Market Revenues & Volume By Commercial Liquor Store for the Period 2018 - 2028
- Historical Data and Forecast of Georgia Kegs Market Revenues & Volume By Others for the Period 2018 - 2028
- Georgia Kegs Import Export Trade Statistics
- Market Opportunity Assessment By Material
- Market Opportunity Assessment By Capacity
- Market Opportunity Assessment By End Use
- Market Opportunity Assessment By Distribution Channel
- Georgia Kegs Top Companies Market Share
- Georgia Kegs Competitive Benchmarking By Technical and Operational Parameters
- Georgia Kegs Company Profiles
- Georgia Kegs Key Strategic Recommendations
Frequently Asked Questions About the Market Study (FAQs):
6Wresearch actively monitors the Georgia Kegs Market and publishes its comprehensive annual report, highlighting emerging trends, growth drivers, revenue analysis, and forecast outlook. Our insights help businesses to make data-backed strategic decisions with ongoing market dynamics. Our analysts track relevent industries related to the Georgia Kegs Market, allowing our clients with actionable intelligence and reliable forecasts tailored to emerging regional needs.
Yes, we provide customisation as per your requirements. To learn more, feel free to contact us on sales@6wresearch.com
1 Executive Summary |
2 Introduction |
2.1 Key Highlights of the Report |
2.2 Report Description |
2.3 Market Scope & Segmentation |
2.4 Research Methodology |
2.5 Assumptions |
3 Georgia Kegs Market Overview |
3.1 Georgia Country Macro Economic Indicators |
3.2 Georgia Kegs Market Revenues & Volume, 2021 & 2028F |
3.3 Georgia Kegs Market - Industry Life Cycle |
3.4 Georgia Kegs Market - Porter's Five Forces |
3.5 Georgia Kegs Market Revenues & Volume Share, By Material, 2021 & 2028F |
3.6 Georgia Kegs Market Revenues & Volume Share, By Capacity, 2021 & 2028F |
3.7 Georgia Kegs Market Revenues & Volume Share, By End Use, 2021 & 2028F |
3.8 Georgia Kegs Market Revenues & Volume Share, By Distribution Channel, 2021 & 2028F |
4 Georgia Kegs Market Dynamics |
4.1 Impact Analysis |
4.2 Market Drivers |
4.2.1 Increasing popularity of craft beer in Georgia |
4.2.2 Growth in the number of breweries and brewpubs in the region |
4.2.3 Rise in consumer preferences for draught beer over bottled beer |
4.3 Market Restraints |
4.3.1 Stringent regulations on alcohol distribution and sales in Georgia |
4.3.2 Competition from alternative packaging solutions like cans and bottles in the beverage industry |
5 Georgia Kegs Market Trends |
6 Georgia Kegs Market, By Types |
6.1 Georgia Kegs Market, By Material |
6.1.1 Overview and Analysis |
6.1.2 Georgia Kegs Market Revenues & Volume, By Material, 2018 - 2028F |
6.1.3 Georgia Kegs Market Revenues & Volume, By Plastic, 2018 - 2028F |
6.1.4 Georgia Kegs Market Revenues & Volume, By Tin, 2018 - 2028F |
6.1.5 Georgia Kegs Market Revenues & Volume, By Stainless Steel, 2018 - 2028F |
6.2 Georgia Kegs Market, By Capacity |
6.2.1 Overview and Analysis |
6.2.2 Georgia Kegs Market Revenues & Volume, By Up to 20 Liter, 2018 - 2028F |
6.2.3 Georgia Kegs Market Revenues & Volume, By 20 Liter to 40 Liter, 2018 - 2028F |
6.2.4 Georgia Kegs Market Revenues & Volume, By 40 Liter to 60 Liter, 2018 - 2028F |
6.2.5 Georgia Kegs Market Revenues & Volume, By Above 60 Liter, 2018 - 2028F |
6.3 Georgia Kegs Market, By End Use |
6.3.1 Overview and Analysis |
6.3.2 Georgia Kegs Market Revenues & Volume, By Alcoholic Beverages, 2018 - 2028F |
6.3.3 Georgia Kegs Market Revenues & Volume, By Non-Alcoholic Beverages, 2018 - 2028F |
6.3.4 Georgia Kegs Market Revenues & Volume, By Cooking Oil, 2018 - 2028F |
6.3.5 Georgia Kegs Market Revenues & Volume, By Chemicals, 2018 - 2028F |
6.3.6 Georgia Kegs Market Revenues & Volume, By Others, 2018 - 2028F |
6.4 Georgia Kegs Market, By Distribution Channel |
6.4.1 Overview and Analysis |
6.4.2 Georgia Kegs Market Revenues & Volume, By Supermarket/Hypermarket, 2018 - 2028F |
6.4.3 Georgia Kegs Market Revenues & Volume, By Commercial Liquor Store, 2018 - 2028F |
6.4.4 Georgia Kegs Market Revenues & Volume, By Others, 2018 - 2028F |
7 Georgia Kegs Market Import-Export Trade Statistics |
7.1 Georgia Kegs Market Export to Major Countries |
7.2 Georgia Kegs Market Imports from Major Countries |
8 Georgia Kegs Market Key Performance Indicators |
8.1 Percentage growth in the number of craft breweries using kegs in Georgia |
8.2 Average revenue per keg in the Georgia market |
8.3 Adoption rate of kegs by new breweries in the region |
9 Georgia Kegs Market - Opportunity Assessment |
9.1 Georgia Kegs Market Opportunity Assessment, By Material, 2021 & 2028F |
9.2 Georgia Kegs Market Opportunity Assessment, By Capacity, 2021 & 2028F |
9.3 Georgia Kegs Market Opportunity Assessment, By End Use, 2021 & 2028F |
9.4 Georgia Kegs Market Opportunity Assessment, By Distribution Channel, 2021 & 2028F |
10 Georgia Kegs Market - Competitive Landscape |
10.1 Georgia Kegs Market Revenue Share, By Companies, 2021 |
10.2 Georgia Kegs Market Competitive Benchmarking, By Operating and Technical Parameters |
11 Company Profiles |
12 Recommendations |
13 Disclaimer |
Global Go To Market Strategy - 2030
Export potential enables firms to identify high-growth global markets with greater confidence by combining advanced trade intelligence with a structured quantitative methodology. The framework analyzes emerging demand trends and country-level import patterns while integrating macroeconomic and trade datasets such as GDP and population forecasts, bilateral import–export flows, tariff structures, elasticity differentials between developed and developing economies, geographic distance, and import demand projections. Using weighted trade values from 2020–2024 as the base period to project country-to-country export potential for 2030, these inputs are operationalized through calculated drivers such as gravity model parameters, tariff impact factors, and projected GDP per-capita growth. Through an analysis of hidden potentials, demand hotspots, and market conditions that are most favorable to success, this method enables firms to focus on target countries, maximize returns, and global expansion with data, backed by accuracy.
By factoring in the projected importer demand gap that is currently unmet and could be potential opportunity, it identifies the potential for the Exporter (Country) among 190 countries, against the general trade analysis, which identifies the biggest importer or exporter.
To discover high-growth global markets and optimize your business strategy:
Click Here
Pricing
- Single User License$ 1,995
- Department License$ 2,400
- Site License$ 3,120
- Global License$ 3,795

Leadership Perspectives from Industry Events
Search
Thought Leadership and Analyst Meet


Our Clients
6WResearch In News
- India Air Conditioner Market Set for Strong Rebound in 2026 After Weather-Led Correction and GST-Driven Recovery: 6Wresearch
- ADAS in India: How Automatic Emergency Braking, Blind Spot Detection & Driver Monitoring are Transforming Road Safety
- Doha a strategic location for EV manufacturing hub: IPA Qatar
- Demand for luxury TVs surging in the GCC, says Samsung
- Empowering Growth: The Thriving Journey of Bangladesh’s Cable Industry
- Demand for luxury TVs surging in the GCC, says Samsung
Latest Reports
- Poland Fire Protection Systems Market (2026-2032)
- Cape Verde Portable Hand-Thrown Extinguisher Market (2026-2032)
- Canada Portable Hand-Thrown Extinguisher Market (2026-2032)
- Cameroon Portable Hand-Thrown Extinguisher Market (2026-2032)
- Burundi Portable Hand-Thrown Extinguisher Market (2026-2032)
- Burkina Faso Portable Hand-Thrown Extinguisher Market (2026-2032)
- Bulgaria Portable Hand-Thrown Extinguisher Market (2026-2032)
- Brunei Portable Hand-Thrown Extinguisher Market (2026-2032)
- Botswana Portable Hand-Thrown Extinguisher Market (2026-2032)
- Bosnia and Herzegovina Portable Hand-Thrown Extinguisher Market (2026-2032)
Industry Events and Analyst Meet

HIMTEX 2026

India Refining Summit 2026

India EV Show 2026

EV tech India Expo 2026

Auto Tech Asia 2026
Whitepaper
- Middle East & Africa Commercial Security Market Click here to view more.
- Middle East & Africa Fire Safety Systems & Equipment Market Click here to view more.
- GCC Drone Market Click here to view more.
- Middle East Lighting Fixture Market Click here to view more.
- GCC Physical & Perimeter Security Market Click here to view more.