Georgia Neon Gas Market (2026-2032) Outlook | Analysis, Companies, Trends, Value, Revenue, Share, Forecast, Growth, Industry & Size
Market Forecast By Type (Low, High, Ultra High), By Application (Semiconductor, LCD, Imaging and Lighting, Refrigerator, Laser, Medical, Others) And Competitive Landscape
| Product Code: ETC094879 | Publication Date: Jun 2021 | Updated Date: Jun 2026 | Product Type: Report | |
| Publisher: 6Wresearch | Author: Shubham Deep | No. of Pages: 70 | No. of Figures: 35 | No. of Tables: 5 |
Georgia Neon Gas Market Size, Share & Growth Rate
The Georgia Neon Gas Market was estimated at USD 746 Million in 2025 and is projected to reach USD 1078 Million by 2032, growing at a CAGR of 5.4% from 2026 to 2032. This growth is primarily driven by the expanding demand across the electronics and healthcare sectors, with neon gas becoming essential for applications such as plasma displays and neonatal care. Additionally, the increasing trend towards energy-efficient lighting solutions is further enhancing the market's growth trajectory.
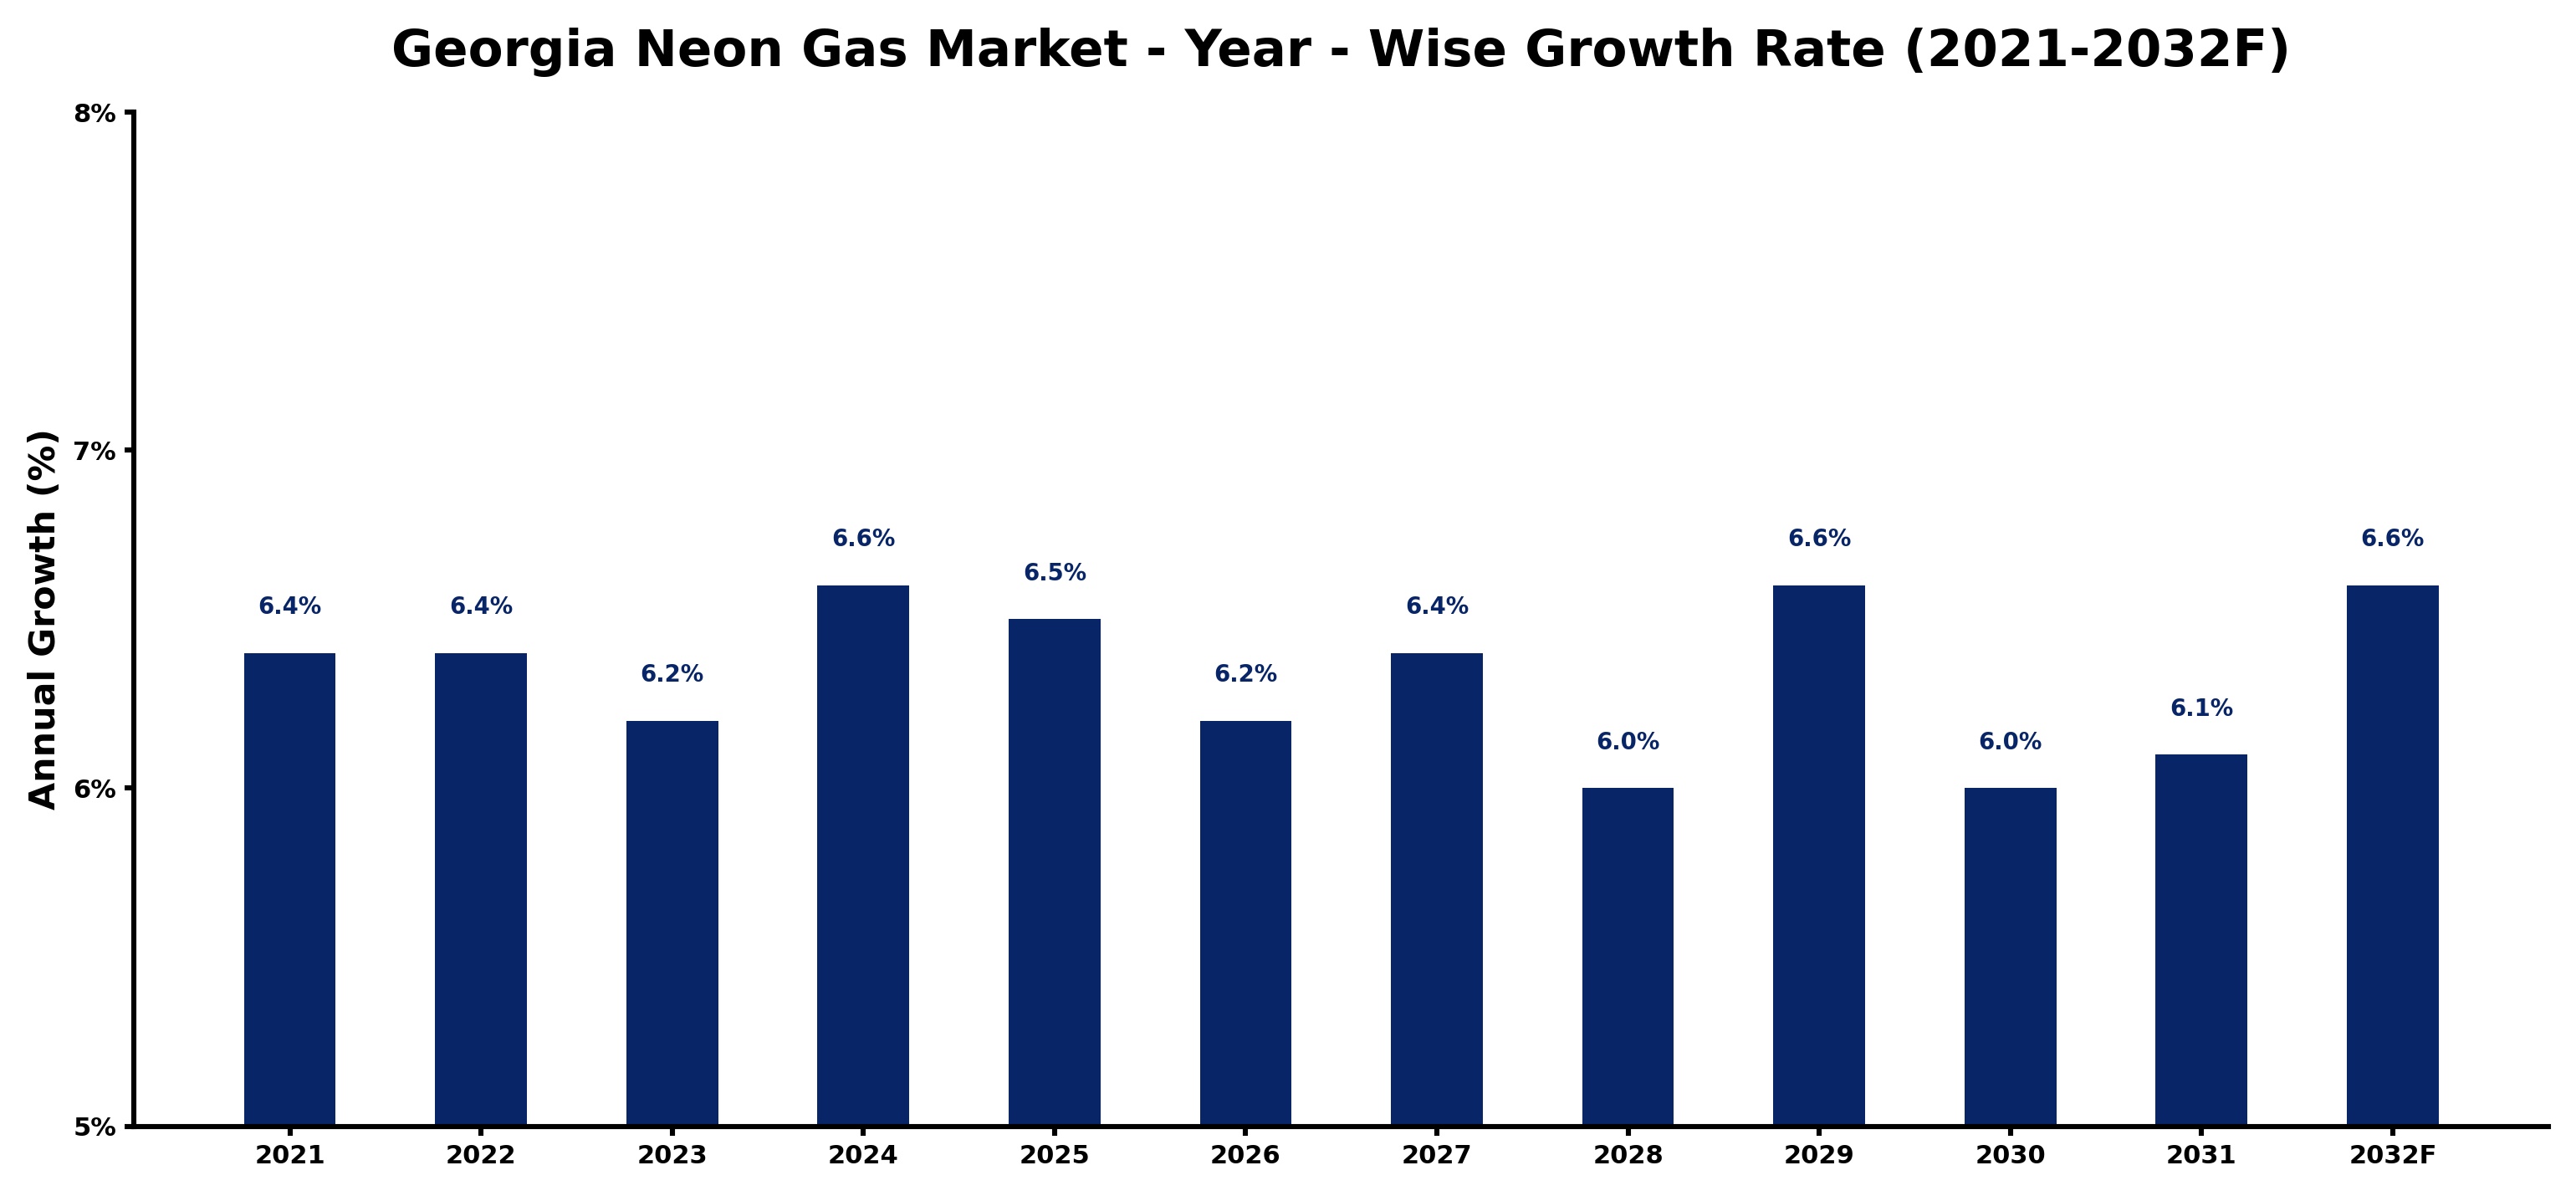
Georgia Neon Gas Market Growth Rate Analysis (2021-2032)
The Georgia Neon Gas Market has exhibited stable growth over the past years, with a notable annual increase of 6.4% in both 2021 and 2022. This upward trend can be attributed to rising consumer demand for vibrant signage and artistic installations, paired with advancements in manufacturing technology that enhance production efficiency. While growth slightly dipped to 6.2% in 2023, it rebounded to 6.6% in 2024, underscoring a resilient market response to infrastructure development and energy transition initiatives. The fluctuations observed, such as the 6.0% growth in 2028 and 2030, highlight the market’s adaptability to digitalization trends and evolving regulatory policies, ensuring continued investment and engagement from stakeholders through 2032.
Georgia Neon Gas Market Year-wise Growth Rate and Key Drivers
This graph highlights how the Georgia Neon Gas Market has steadily grown over the past five years, supported by major growth factors.
The table below presents the year‑wise growth rates along with the key drivers influencing the market
| Year | Growth Rate | Major Drivers |
| 2021 | 6.4% | Tech advancements in gas recovery enhanced nitrogen production efficiency |
| 2022 | 6.4% | Adoption of advanced gas management systems boosts production efficiency |
| 2023 | 6.2% | Manufacturing investments in renewable energy bolster specialty gas production |
| 2024 | 6.6% | Domestic neon gas suppliers optimized production to meet semiconductor demand |
| 2025 | 6.5% | Chemical manufacturing upgrades bolstered demand for specialty gas mixtures |
| 2026 | 6.2% | New production facilities boost local neon gas supply chain efficiency |
| 2027 | 6.4% | Manufacturing investments in specialty gases enhance local production capabilities |
| 2028 | 6.0% | Investment in automated gas production facilities drives operational efficiency |
| 2029 | 6.6% | Advanced monitoring technologies boost efficiency in gas distribution networks |
| 2030 | 6.0% | Utility upgrades boosted efficiency in Georgia's neon gas production |
| 2031 | 6.1% | Neon gas manufacturing upgrades boost semiconductor production capabilities in Georgia |
| 2032 | 6.6% | Regional construction projects boost demand for specialty gas supplies |
Note - Market size estimations and growth projections presented in this report are based on 6Wresearch’s advanced forecasting approach, validated with industry datasets as of June 2026.
Georgia Neon Gas Market Synopsis
In Georgia, the adoption of neon gas in healthcare applications, particularly for neonatal respiratory support, is surging, reflecting the market's crucial role in life-saving technologies. Simultaneously, the electronics industry is leveraging neon gas for advanced manufacturing processes, including semiconductor lasers and plasma displays, which underscores the gas's versatile applications.
The competitive landscape in the Georgia Neon Gas Market showcases a diverse array of suppliers focused on high-purity neon gas, essential for specialized applications. As industrial activities ramp up and technological advancements proliferate, the market is poised for significant growth, creating a fertile ground for innovation and expansion.
Georgia Neon Gas Market Key Takeaways
- The market is driven by increasing applications in electronics, healthcare, and lighting industries.
- Growing focus on sustainable practices is prompting innovations in neon gas production and usage.
- Key sectors benefiting from neon gas include semiconductor manufacturing and laser technology.
- Challenges such as supply chain disruptions and price volatility could affect market dynamics.
- Government policies are encouraging market competition and sustainability initiatives.
Evaluation of Restraints in Georgia Neon Gas Market
Despite the promising growth prospects, the Georgia Neon Gas Market faces significant restraints that could impede its expansion. Price volatility linked to global supply and demand can create uncertainty for suppliers and customers alike. Moreover, limited availability of neon gas providers in the region further complicates supply chains. Additionally, the costs associated with the transportation and specialized storage of neon gas can add to operational expenses, ultimately affecting the overall market performance. Compliance with stringent safety regulations also places a burden on businesses, necessitating careful adherence to industry standards.
Georgia Neon Gas Market Trends
Emerging trends within the Georgia Neon Gas Market illustrate a shift toward environmentally friendly practices and innovative applications. The increasing popularity of neon lighting in commercial and residential settings is notably elevating demand, as consumers and businesses alike seek energy-efficient alternatives. Furthermore, advancements in technology related to the healthcare sector are propelling the utilization of neon gas in diagnostic imaging and laser surgical applications, reflecting a broader trend of interdisciplinary collaboration.
Georgia Neon Gas Market Opportunities
The market presents several lucrative investment opportunities, particularly in the realm of specialized manufacturing for neon signage and lighting systems. With the burgeoning demand in Georgia's commercial and residential markets, investors can benefit from entering this sector. Additionally, firms providing neon gas supply services tailored to the healthcare and automotive industries are well-positioned for growth. Investing in research and development efforts to explore new neon gas technologies and applications may yield significant returns as demand continues to escalate.
Government Initiatives in the Georgia Neon Gas Market
The government of Georgia has implemented various initiatives aimed at regulating the neon gas market to ensure safety, environmental sustainability, and competitive practices. Policies focus on licensing requirements for suppliers and emphasize adherence to stringent safety and environmental standards in production and distribution. Furthermore, initiatives that promote research and development in neon gas applications are encouraged, contributing to the long-term sustainability and growth of the market.
Future Insights of the Georgia Neon Gas Market
Looking ahead to 2026-2032, the Georgia Neon Gas Market is projected to maintain its growth trajectory, bolstered by advances in technology and expanding industrial applications. The healthcare sector's increasing reliance on neon gas for innovative treatments and diagnostic procedures, alongside the growth of the electronics manufacturing industry, will significantly influence market dynamics. Nevertheless, vigilance concerning pricing fluctuations and supply chain integrity will be essential as the market evolves, ensuring companies can navigate potential challenges effectively.
Georgia Neon Gas Market Latest Developments (May 2025 - June 2026)
In recent months, the Georgia Neon Gas Market has seen a shift towards heightened innovation, with various companies enhancing their capabilities in high-purity neon gas production. There's a growing emphasis on sustainable practices within the industry, as businesses seek to reduce their environmental footprints. Collaboration between healthcare providers and technology firms is also increasing, focusing on developing new applications for neon gas in medical settings, thus promising to shape the future landscape of the market.
Georgia Neon Gas Market - Key Attractiveness of the Report
- 10 Years of Market Numbers
- Historical Data Starting from 2022 to 2025
- Base Year: 2025
- Forecast Data until 2032
- Key Performance Indicators Impacting the Market
- Major Upcoming Developments and Projects
Key Highlights of the Report:
- Georgia Neon Gas Market Outlook
- Market Size of Georgia Neon Gas Market, 2025
- Forecast of Georgia Neon Gas Market, 2032
- Historical Data and Forecast of Georgia Neon Gas Revenues & Volume for the Period 2022-2032F
- Georgia Neon Gas Market Trend Evolution
- Georgia Neon Gas Market Drivers and Challenges
- Georgia Neon Gas Price Trends
- Georgia Neon Gas Porter's Five Forces
- Georgia Neon Gas Industry Life Cycle
- Historical Data and Forecast of Georgia Neon Gas Market Revenues & Volume By Type for the Period 2022-2032F
- Historical Data and Forecast of Georgia Neon Gas Market Revenues & Volume By Low for the Period 2022-2032F
- Historical Data and Forecast of Georgia Neon Gas Market Revenues & Volume By High for the Period 2022-2032F
- Historical Data and Forecast of Georgia Neon Gas Market Revenues & Volume By Ultra High for the Period 2022-2032F
- Historical Data and Forecast of Georgia Neon Gas Market Revenues & Volume By Application for the Period 2022-2032F
- Historical Data and Forecast of Georgia Neon Gas Market Revenues & Volume By Semiconductor for the Period 2022-2032F
- Historical Data and Forecast of Georgia Neon Gas Market Revenues & Volume By LCD for the Period 2022-2032F
- Historical Data and Forecast of Georgia Neon Gas Market Revenues & Volume By Imaging and Lighting for the Period 2022-2032F
- Historical Data and Forecast of Georgia Neon Gas Market Revenues & Volume By Refrigerator for the Period 2022-2032F
- Historical Data and Forecast of Georgia Neon Gas Market Revenues & Volume By Laser for the Period 2022-2032F
- Historical Data and Forecast of Georgia Neon Gas Market Revenues & Volume By Medical for the Period 2022-2032F
- Historical Data and Forecast of Georgia Neon Gas Market Revenues & Volume By Others for the Period 2022-2032F
- Georgia Neon Gas Import Export Trade Statistics
- Market Opportunity Assessment By Type
- Market Opportunity Assessment By Application
- Georgia Neon Gas Top Companies Market Share
- Georgia Neon Gas Competitive Benchmarking By Technical and Operational Parameters
- Georgia Neon Gas Company Profiles
- Georgia Neon Gas Key Strategic Recommendations
Georgia Neon Gas Market - Frequently Asked Questions
The growth is largely driven by the expanding applications in healthcare and electronics, particularly in neonatal care and plasma displays, as well as the rising demand for energy-efficient lighting solutions.
The market is projected to reach USD 1078 Million by 2032, growing at a CAGR of 5.4% from 2026 to 2032.
Neon gas plays a vital role in neonatal care, providing respiratory support for premature infants, as well as in diagnostic imaging and laser surgical applications.
Yes, there are concerns about the environmental impact of neon gas production and disposal, prompting companies to adopt more sustainable practices in their operations.
Companies may encounter challenges such as fluctuating prices of raw materials, limited local suppliers, and stringent regulatory compliance requirements.
6Wresearch actively monitors the Georgia Neon Gas Market and publishes its comprehensive annual report, highlighting emerging trends, growth drivers, revenue analysis, and forecast outlook. Our insights help businesses to make data-backed strategic decisions with ongoing market dynamics. Our analysts track relevent industries related to the Georgia Neon Gas Market, allowing our clients with actionable intelligence and reliable forecasts tailored to emerging regional needs.
Yes, we provide customisation as per your requirements. To learn more, feel free to contact us on sales@6wresearch.com
1 Executive Summary |
2 Introduction |
2.1 Key Highlights of the Report |
2.2 Report Description |
2.3 Market Scope & Segmentation |
2.4 Research Methodology |
2.5 Assumptions |
3 Georgia Neon Gas Market Overview |
3.1 Georgia Country Macro Economic Indicators |
3.2 Georgia Neon Gas Market Revenues & Volume, 2022 & 2032F |
3.3 Georgia Neon Gas Market - Industry Life Cycle |
3.4 Georgia Neon Gas Market - Porter's Five Forces |
3.5 Georgia Neon Gas Market Revenues & Volume Share, By Type, 2022 & 2032F |
3.6 Georgia Neon Gas Market Revenues & Volume Share, By Form, 2022 & 2032F |
4 Georgia Neon Gas Market Dynamics |
4.1 Impact Analysis |
4.2 Market Drivers |
4.3 Market Restraints |
5 Georgia Neon Gas Market Trends |
6 Georgia Neon Gas Market, By Types |
6.1 Georgia Neon Gas Market, By Type |
6.1.1 Overview and Analysis |
6.1.2 Georgia Neon Gas Market Revenues & Volume, By Type, 2022-2032F |
6.1.3 Georgia Neon Gas Market Revenues & Volume, By Low, 2022-2032F |
6.1.4 Georgia Neon Gas Market Revenues & Volume, By High, 2022-2032F |
6.1.5 Georgia Neon Gas Market Revenues & Volume, By Ultra High, 2022-2032F |
6.2 Georgia Neon Gas Market, By Application |
6.2.1 Overview and Analysis |
6.2.2 Georgia Neon Gas Market Revenues & Volume, By Semiconductor, 2022-2032F |
6.2.3 Georgia Neon Gas Market Revenues & Volume, By LCD, 2022-2032F |
6.2.4 Georgia Neon Gas Market Revenues & Volume, By Imaging and Lighting, 2022-2032F |
6.2.5 Georgia Neon Gas Market Revenues & Volume, By Refrigerator, 2022-2032F |
6.2.6 Georgia Neon Gas Market Revenues & Volume, By Laser, 2022-2032F |
6.2.7 Georgia Neon Gas Market Revenues & Volume, By Medical, 2022-2032F |
7 Georgia Neon Gas Market Import-Export Trade Statistics |
7.1 Georgia Neon Gas Market Export to Major Countries |
7.2 Georgia Neon Gas Market Imports from Major Countries |
8 Georgia Neon Gas Market Key Performance Indicators |
9 Georgia Neon Gas Market - Opportunity Assessment |
9.1 Georgia Neon Gas Market Opportunity Assessment, By Type, 2022 & 2032F |
9.2 Georgia Neon Gas Market Opportunity Assessment, By Application, 2022 & 2032F |
10 Georgia Neon Gas Market - Competitive Landscape |
10.1 Georgia Neon Gas Market Revenue Share, By Companies, 2025 |
10.2 Georgia Neon Gas Market Competitive Benchmarking, By Operating and Technical Parameters |
11 Company Profiles |
12 Recommendations |
13 Disclaimer |
Global Go To Market Strategy - 2030
Export potential enables firms to identify high-growth global markets with greater confidence by combining advanced trade intelligence with a structured quantitative methodology. The framework analyzes emerging demand trends and country-level import patterns while integrating macroeconomic and trade datasets such as GDP and population forecasts, bilateral import–export flows, tariff structures, elasticity differentials between developed and developing economies, geographic distance, and import demand projections. Using weighted trade values from 2020–2024 as the base period to project country-to-country export potential for 2030, these inputs are operationalized through calculated drivers such as gravity model parameters, tariff impact factors, and projected GDP per-capita growth. Through an analysis of hidden potentials, demand hotspots, and market conditions that are most favorable to success, this method enables firms to focus on target countries, maximize returns, and global expansion with data, backed by accuracy.
By factoring in the projected importer demand gap that is currently unmet and could be potential opportunity, it identifies the potential for the Exporter (Country) among 190 countries, against the general trade analysis, which identifies the biggest importer or exporter.
To discover high-growth global markets and optimize your business strategy:
Click Here
Pricing
- Single User License$ 1,995
- Department License$ 2,400
- Site License$ 3,120
- Global License$ 3,795

Leadership Perspectives from Industry Events
Search
Thought Leadership and Analyst Meet


Our Clients
6WResearch In News
- India Air Conditioner Market Set for Strong Rebound in 2026 After Weather-Led Correction and GST-Driven Recovery: 6Wresearch
- ADAS in India: How Automatic Emergency Braking, Blind Spot Detection & Driver Monitoring are Transforming Road Safety
- Doha a strategic location for EV manufacturing hub: IPA Qatar
- Demand for luxury TVs surging in the GCC, says Samsung
- Empowering Growth: The Thriving Journey of Bangladesh’s Cable Industry
- Demand for luxury TVs surging in the GCC, says Samsung
Latest Reports
- Nicaragua RPG Gaming Market (2026-2032)
- New Zealand RPG Gaming Market (2026-2032)
- Netherlands RPG Gaming Market (2026-2032)
- Nauru RPG Gaming Market (2026-2032)
- Namibia RPG Gaming Market (2026-2032)
- Mozambique RPG Gaming Market (2026-2032)
- Montenegro RPG Gaming Market (2026-2032)
- Mongolia RPG Gaming Market (2026-2032)
- Monaco RPG Gaming Market (2026-2032)
- Micronesia RPG Gaming Market (2026-2032)
Industry Events and Analyst Meet

HIMTEX 2026

India Refining Summit 2026

India EV Show 2026

EV tech India Expo 2026

Auto Tech Asia 2026
Whitepaper
- Middle East & Africa Commercial Security Market Click here to view more.
- Middle East & Africa Fire Safety Systems & Equipment Market Click here to view more.
- GCC Drone Market Click here to view more.
- Middle East Lighting Fixture Market Click here to view more.
- GCC Physical & Perimeter Security Market Click here to view more.