Georgia Nitrogen Market (2025-2031) Outlook | Size, Value, Growth, Trends, Companies, Share, Revenue, Analysis, Forecast & Industry
Market Forecast By End Users (Metal manufacturing & fabrication, Oil & Gas, Petrochemical, Pharmaceutical & Healthcare, Chemical, Food & Beverages, Electronics), By Form (Gas, Liquid), By Applications (Adhesives, Sealants used as rubber roof repair, Tubeless tire liners) And Competitive Landscape
| Product Code: ETC416756 | Publication Date: Oct 2022 | Updated Date: Aug 2025 | Product Type: Market Research Report | |
| Publisher: 6Wresearch | Author: Sachin Kumar Rai | No. of Pages: 75 | No. of Figures: 35 | No. of Tables: 20 |
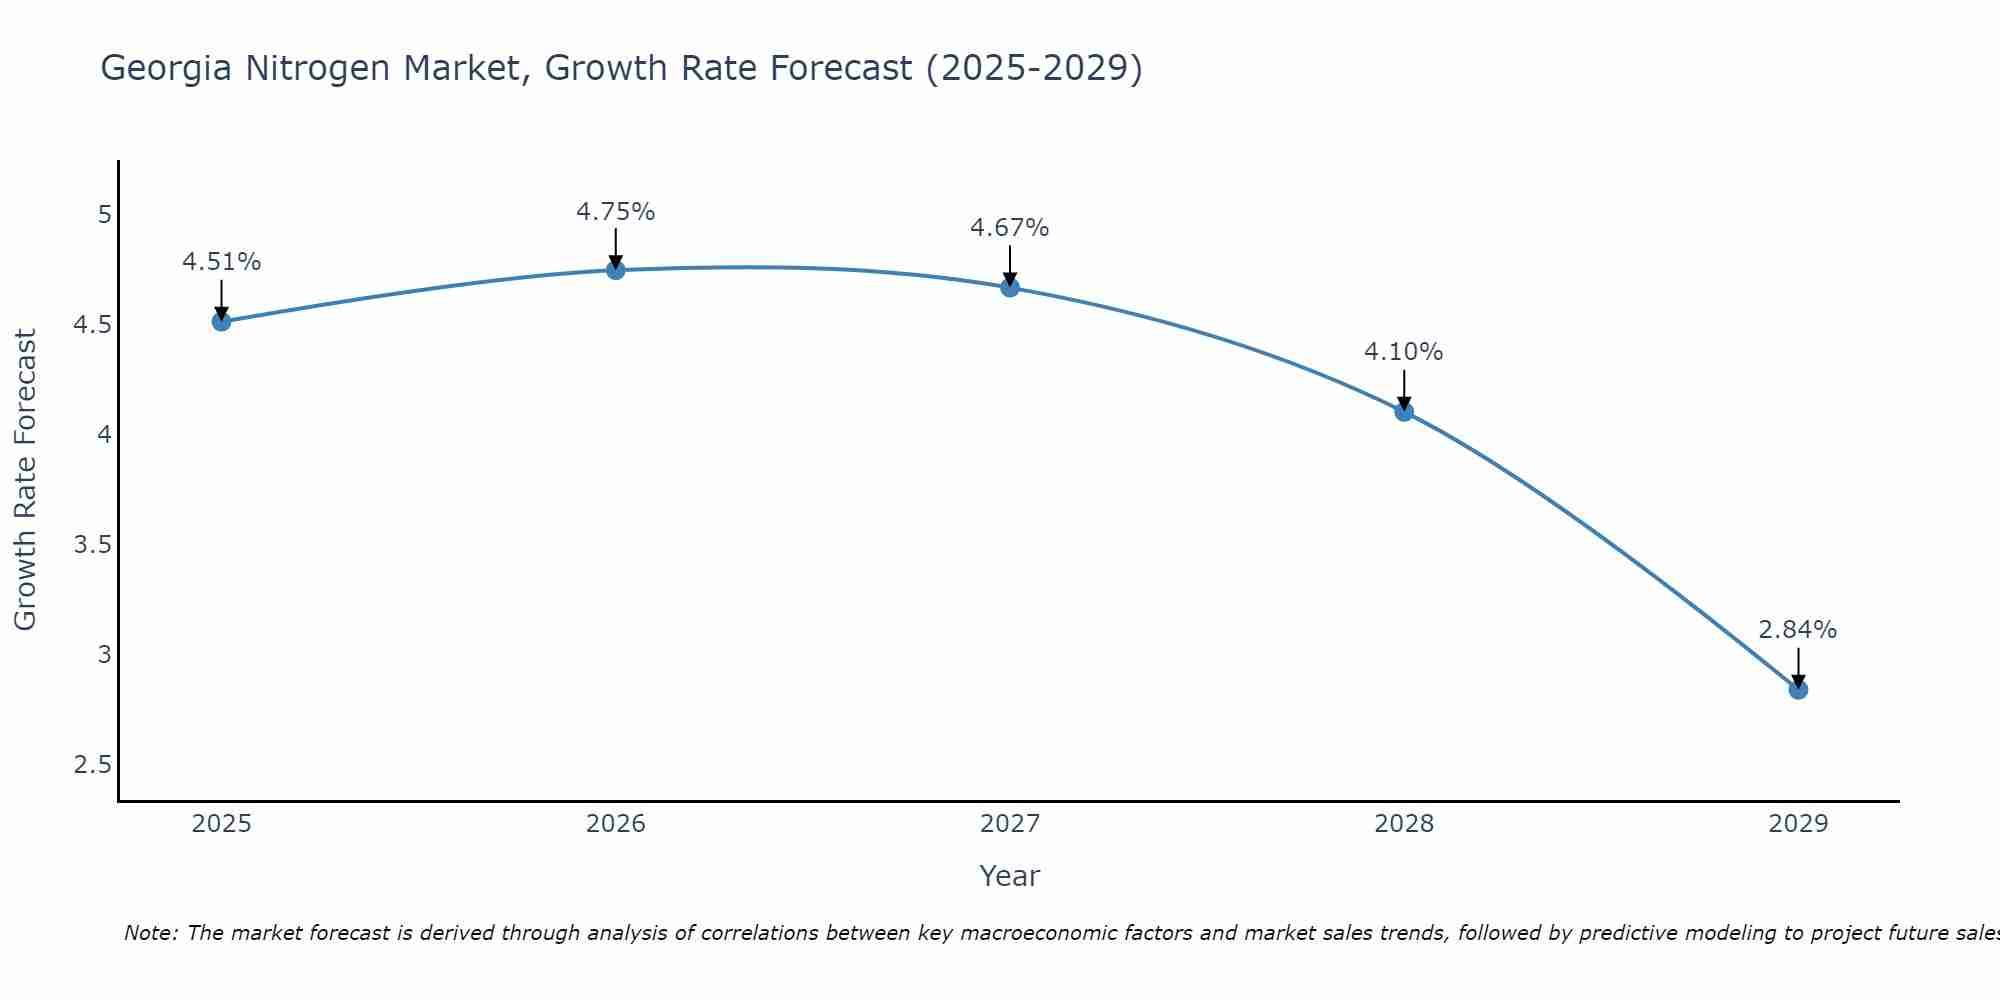
Georgia Nitrogen Market Size Growth Rate
The Georgia Nitrogen Market is projected to witness mixed growth rate patterns during 2025 to 2029. The growth rate begins at 4.51% in 2025, climbs to a high of 4.75% in 2026, and moderates to 2.84% by 2029.
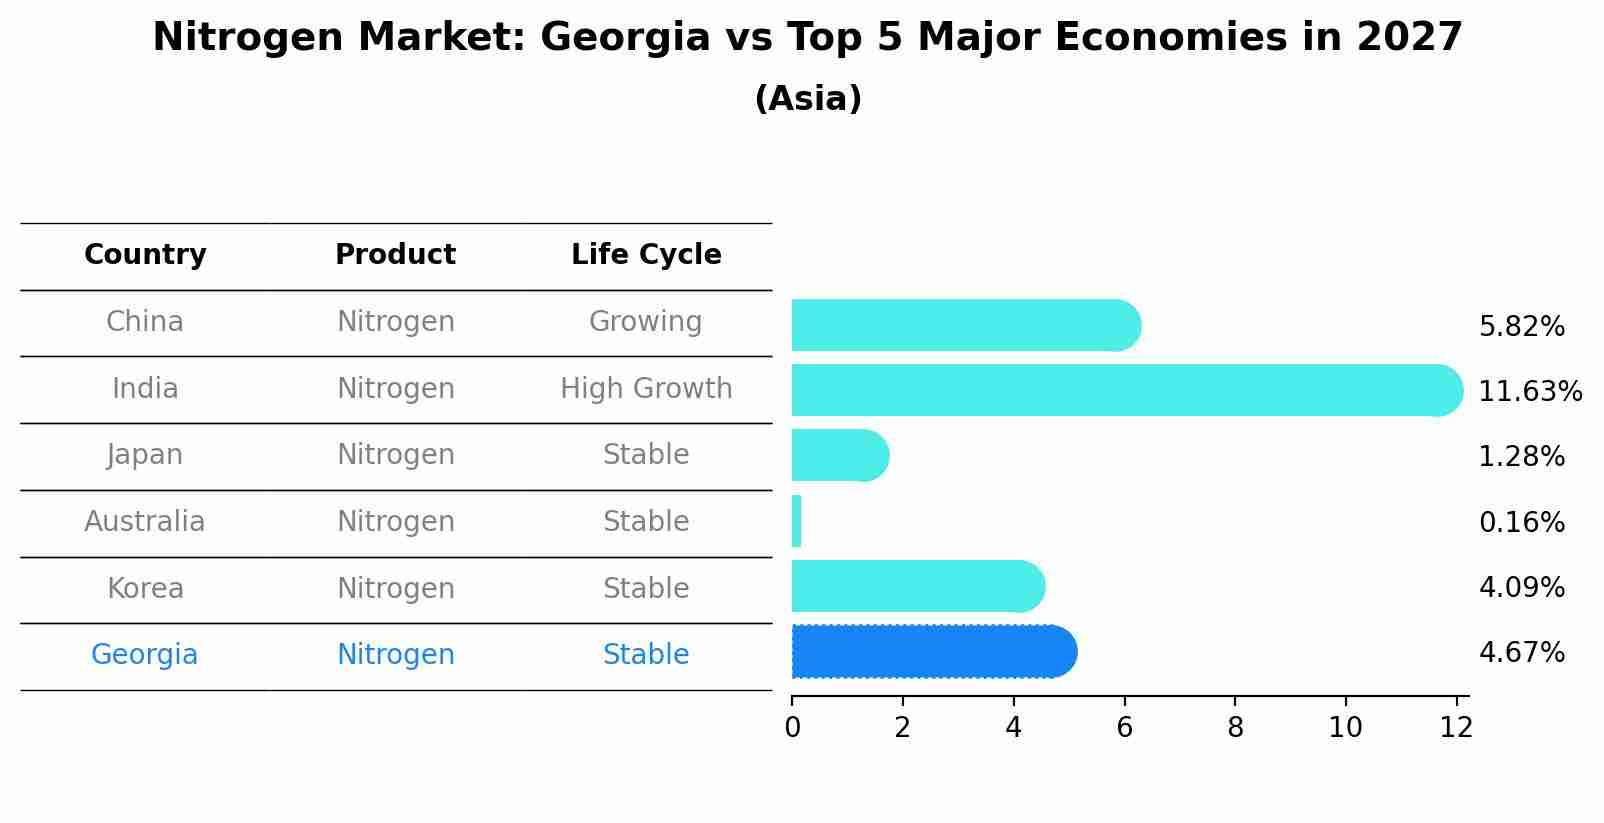
Nitrogen Market: Georgia vs Top 5 Major Economies in 2027 (Asia)
In the Asia region, the Nitrogen market in Georgia is projected to expand at a stable growth rate of 4.67% by 2027. The largest economy is China, followed by India, Japan, Australia and South Korea.
Georgia Nitrogen Market Synopsis
The Georgia Nitrogen Market is a vital component of the state`s agricultural industry, with nitrogen being a key nutrient essential for crop growth. Farmers in Georgia heavily rely on nitrogen fertilizers to improve soil fertility and enhance crop yields, particularly for staple crops like corn, cotton, and peanuts. The market is characterized by a competitive landscape with several key players offering a range of nitrogen fertilizers such as urea, ammonium nitrate, and ammonium sulfate. Local production facilities and importation channels ensure a steady supply of nitrogen products to meet the demand of Georgia`s agricultural sector. Market dynamics are influenced by factors like weather conditions, global market trends, and government regulations on fertilizer use, all of which impact pricing and availability of nitrogen fertilizers in Georgia. Overall, the Georgia Nitrogen Market plays a crucial role in sustaining the state`s agricultural productivity and economic growth.
Georgia Nitrogen Market Trends
The Georgia Nitrogen Market is currently experiencing a trend towards increased demand for nitrogen fertilizers driven by the growing need for higher crop yields and improved agricultural productivity. Farmers in Georgia are seeking more efficient ways to boost soil fertility and enhance plant growth, leading to a rise in nitrogen fertilizer utilization. Additionally, there is a shift towards environmentally sustainable nitrogen products, such as slow-release fertilizers and precision application techniques, as growers aim to minimize nutrient runoff and reduce environmental impact. Market players are also focusing on developing innovative nitrogen formulations and technologies to cater to the evolving needs of Georgia`s agricultural sector, including customized blends and specialty products tailored to specific crop requirements. Overall, the Georgia Nitrogen Market is witnessing a shift towards advanced, sustainable solutions to meet the demands of modern agriculture while prioritizing environmental stewardship.
Georgia Nitrogen Market Challenges
In the Georgia Nitrogen Market, challenges include volatile fertilizer prices driven by factors such as global supply and demand dynamics, weather conditions, and currency fluctuations. Additionally, regulatory changes and environmental concerns related to nitrogen runoff and water pollution are pressing issues for industry players. Competition from international nitrogen suppliers, particularly in regions with lower production costs, poses a threat to local producers in Georgia. Furthermore, the need for continuous technological advancements and investments in infrastructure to enhance efficiency and sustainability in nitrogen production and distribution further compound the challenges faced by market participants in Georgia. Overall, navigating these complexities while ensuring profitability and compliance with industry standards remains a key challenge in the Georgia Nitrogen Market.
Georgia Nitrogen Market Investment Opportunities
The Georgia Nitrogen Market presents several investment opportunities due to the state`s growing agricultural industry and increasing demand for nitrogen-based fertilizers. Investing in companies that produce nitrogen fertilizers, such as urea or ammonium nitrate, can be lucrative as farmers continue to rely on these products to enhance crop yields. Additionally, there is potential for investment in nitrogen storage and distribution facilities to support the efficient transportation of fertilizers within the state and to neighboring regions. With Georgia being a prominent player in the agriculture sector, investing in the nitrogen market can provide stable returns and long-term growth potential as the demand for fertilizers is expected to remain strong in the foreseeable future.
Jordan Agar Market Government Policies
The Georgia Nitrogen Market is influenced by various government policies aimed at regulating the use and distribution of nitrogen-based fertilizers. The state`s Department of Agriculture enforces regulations on nitrogen application rates to prevent environmental pollution, particularly in sensitive areas like water bodies. Additionally, the government offers subsidies and incentives to encourage farmers to adopt sustainable nitrogen management practices, such as precision agriculture techniques and nitrogen-efficient crop varieties. Furthermore, there are restrictions on the sale of nitrogen products containing harmful additives, ensuring the safety and efficacy of fertilizers used in agricultural activities. Overall, these government policies play a crucial role in promoting responsible nitrogen use, protecting the environment, and supporting the long-term sustainability of the Georgia Nitrogen Market.
Georgia Nitrogen Market Future Outlook
The future outlook for the Georgia Nitrogen Market appears promising due to factors such as increasing demand for nitrogen-based fertilizers in the agriculture sector to support crop production. Georgia`s strong agricultural industry, particularly in sectors like corn, cotton, and peanuts, will continue to drive the demand for nitrogen products. Additionally, the state`s growing population and economy are expected to further boost the demand for nitrogen-based products in industrial applications. However, challenges such as fluctuating global prices for nitrogen products and environmental regulations regarding nitrogen usage may pose some risks. Overall, the Georgia Nitrogen Market is anticipated to experience steady growth in the coming years, presenting opportunities for market players to capitalize on the increasing demand within the state.
Key Highlights of the Report:
- Georgia Nitrogen Market Outlook
- Market Size of Georgia Nitrogen Market, 2024
- Forecast of Georgia Nitrogen Market, 2031
- Historical Data and Forecast of Georgia Nitrogen Revenues & Volume for the Period 2021 - 2031
- Georgia Nitrogen Market Trend Evolution
- Georgia Nitrogen Market Drivers and Challenges
- Georgia Nitrogen Price Trends
- Georgia Nitrogen Porter's Five Forces
- Georgia Nitrogen Industry Life Cycle
- Historical Data and Forecast of Georgia Nitrogen Market Revenues & Volume By End Users for the Period 2021 - 2031
- Historical Data and Forecast of Georgia Nitrogen Market Revenues & Volume By Metal manufacturing & fabrication for the Period 2021 - 2031
- Historical Data and Forecast of Georgia Nitrogen Market Revenues & Volume By Oil & Gas for the Period 2021 - 2031
- Historical Data and Forecast of Georgia Nitrogen Market Revenues & Volume By Petrochemical for the Period 2021 - 2031
- Historical Data and Forecast of Georgia Nitrogen Market Revenues & Volume By Pharmaceutical & Healthcare for the Period 2021 - 2031
- Historical Data and Forecast of Georgia Nitrogen Market Revenues & Volume By Chemical for the Period 2021 - 2031
- Historical Data and Forecast of Georgia Nitrogen Market Revenues & Volume By Food & Beverages for the Period 2021 - 2031
- Historical Data and Forecast of Georgia Nitrogen Market Revenues & Volume By Electronics for the Period 2021 - 2031
- Historical Data and Forecast of Georgia Nitrogen Market Revenues & Volume By Form for the Period 2021 - 2031
- Historical Data and Forecast of Georgia Nitrogen Market Revenues & Volume By Gas for the Period 2021 - 2031
- Historical Data and Forecast of Georgia Nitrogen Market Revenues & Volume By Liquid for the Period 2021 - 2031
- Historical Data and Forecast of Georgia Nitrogen Market Revenues & Volume By Applications for the Period 2021 - 2031
- Historical Data and Forecast of Georgia Nitrogen Market Revenues & Volume By Adhesives for the Period 2021 - 2031
- Historical Data and Forecast of Georgia Nitrogen Market Revenues & Volume By Sealants used as rubber roof repair for the Period 2021 - 2031
- Historical Data and Forecast of Georgia Nitrogen Market Revenues & Volume By Tubeless tire liners for the Period 2021 - 2031
- Georgia Nitrogen Import Export Trade Statistics
- Market Opportunity Assessment By End Users
- Market Opportunity Assessment By Form
- Market Opportunity Assessment By Applications
- Georgia Nitrogen Top Companies Market Share
- Georgia Nitrogen Competitive Benchmarking By Technical and Operational Parameters
- Georgia Nitrogen Company Profiles
- Georgia Nitrogen Key Strategic Recommendations
Frequently Asked Questions About the Market Study (FAQs):
6Wresearch actively monitors the Georgia Nitrogen Market and publishes its comprehensive annual report, highlighting emerging trends, growth drivers, revenue analysis, and forecast outlook. Our insights help businesses to make data-backed strategic decisions with ongoing market dynamics. Our analysts track relevent industries related to the Georgia Nitrogen Market, allowing our clients with actionable intelligence and reliable forecasts tailored to emerging regional needs.
Yes, we provide customisation as per your requirements. To learn more, feel free to contact us on sales@6wresearch.com
1 Executive Summary |
2 Introduction |
2.1 Key Highlights of the Report |
2.2 Report Description |
2.3 Market Scope & Segmentation |
2.4 Research Methodology |
2.5 Assumptions |
3 Georgia Nitrogen Market Overview |
3.1 Georgia Country Macro Economic Indicators |
3.2 Georgia Nitrogen Market Revenues & Volume, 2021 & 2031F |
3.3 Georgia Nitrogen Market - Industry Life Cycle |
3.4 Georgia Nitrogen Market - Porter's Five Forces |
3.5 Georgia Nitrogen Market Revenues & Volume Share, By End Users, 2021 & 2031F |
3.6 Georgia Nitrogen Market Revenues & Volume Share, By Form, 2021 & 2031F |
3.7 Georgia Nitrogen Market Revenues & Volume Share, By Applications, 2021 & 2031F |
4 Georgia Nitrogen Market Dynamics |
4.1 Impact Analysis |
4.2 Market Drivers |
4.2.1 Increasing demand for nitrogen-based fertilizers in the agriculture sector in Georgia |
4.2.2 Technological advancements in nitrogen production processes leading to cost efficiencies |
4.2.3 Government initiatives promoting the use of nitrogen fertilizers for sustainable agriculture practices |
4.3 Market Restraints |
4.3.1 Fluctuating prices of raw materials used in nitrogen production |
4.3.2 Environmental concerns regarding nitrogen runoff and its impact on water quality |
4.3.3 Competition from alternative fertilizers like phosphorus and potassium-based fertilizers |
5 Georgia Nitrogen Market Trends |
6 Georgia Nitrogen Market, By Types |
6.1 Georgia Nitrogen Market, By End Users |
6.1.1 Overview and Analysis |
6.1.2 Georgia Nitrogen Market Revenues & Volume, By End Users, 2021 - 2031F |
6.1.3 Georgia Nitrogen Market Revenues & Volume, By Metal manufacturing & fabrication, 2021 - 2031F |
6.1.4 Georgia Nitrogen Market Revenues & Volume, By Oil & Gas, 2021 - 2031F |
6.1.5 Georgia Nitrogen Market Revenues & Volume, By Petrochemical, 2021 - 2031F |
6.1.6 Georgia Nitrogen Market Revenues & Volume, By Pharmaceutical & Healthcare, 2021 - 2031F |
6.1.7 Georgia Nitrogen Market Revenues & Volume, By Chemical, 2021 - 2031F |
6.1.8 Georgia Nitrogen Market Revenues & Volume, By Food & Beverages, 2021 - 2031F |
6.2 Georgia Nitrogen Market, By Form |
6.2.1 Overview and Analysis |
6.2.2 Georgia Nitrogen Market Revenues & Volume, By Gas, 2021 - 2031F |
6.2.3 Georgia Nitrogen Market Revenues & Volume, By Liquid, 2021 - 2031F |
6.3 Georgia Nitrogen Market, By Applications |
6.3.1 Overview and Analysis |
6.3.2 Georgia Nitrogen Market Revenues & Volume, By Adhesives, 2021 - 2031F |
6.3.3 Georgia Nitrogen Market Revenues & Volume, By Sealants used as rubber roof repair, 2021 - 2031F |
6.3.4 Georgia Nitrogen Market Revenues & Volume, By Tubeless tire liners, 2021 - 2031F |
7 Georgia Nitrogen Market Import-Export Trade Statistics |
7.1 Georgia Nitrogen Market Export to Major Countries |
7.2 Georgia Nitrogen Market Imports from Major Countries |
8 Georgia Nitrogen Market Key Performance Indicators |
8.1 Nitrogen fertilizer application rates per acre in Georgia |
8.2 Adoption rate of nitrogen-efficient farming practices in the agriculture sector |
8.3 Average nitrogen fertilizer prices in the Georgia market compared to historical data |
9 Georgia Nitrogen Market - Opportunity Assessment |
9.1 Georgia Nitrogen Market Opportunity Assessment, By End Users, 2021 & 2031F |
9.2 Georgia Nitrogen Market Opportunity Assessment, By Form, 2021 & 2031F |
9.3 Georgia Nitrogen Market Opportunity Assessment, By Applications, 2021 & 2031F |
10 Georgia Nitrogen Market - Competitive Landscape |
10.1 Georgia Nitrogen Market Revenue Share, By Companies, 2024 |
10.2 Georgia Nitrogen Market Competitive Benchmarking, By Operating and Technical Parameters |
11 Company Profiles |
12 Recommendations |
13 Disclaimer |
Global Go To Market Strategy - 2030
Export potential enables firms to identify high-growth global markets with greater confidence by combining advanced trade intelligence with a structured quantitative methodology. The framework analyzes emerging demand trends and country-level import patterns while integrating macroeconomic and trade datasets such as GDP and population forecasts, bilateral import–export flows, tariff structures, elasticity differentials between developed and developing economies, geographic distance, and import demand projections. Using weighted trade values from 2020–2024 as the base period to project country-to-country export potential for 2030, these inputs are operationalized through calculated drivers such as gravity model parameters, tariff impact factors, and projected GDP per-capita growth. Through an analysis of hidden potentials, demand hotspots, and market conditions that are most favorable to success, this method enables firms to focus on target countries, maximize returns, and global expansion with data, backed by accuracy.
By factoring in the projected importer demand gap that is currently unmet and could be potential opportunity, it identifies the potential for the Exporter (Country) among 190 countries, against the general trade analysis, which identifies the biggest importer or exporter.
To discover high-growth global markets and optimize your business strategy:
Click Here
Pricing
- Single User License$ 1,995
- Department License$ 2,400
- Site License$ 3,120
- Global License$ 3,795

Leadership Perspectives from Industry Events
Search
Thought Leadership and Analyst Meet


Our Clients
6WResearch In News
- India Air Conditioner Market Set for Strong Rebound in 2026 After Weather-Led Correction and GST-Driven Recovery: 6Wresearch
- ADAS in India: How Automatic Emergency Braking, Blind Spot Detection & Driver Monitoring are Transforming Road Safety
- Doha a strategic location for EV manufacturing hub: IPA Qatar
- Demand for luxury TVs surging in the GCC, says Samsung
- Empowering Growth: The Thriving Journey of Bangladesh’s Cable Industry
- Demand for luxury TVs surging in the GCC, says Samsung
Latest Reports
- Poland Fire Protection Systems Market (2026-2032)
- Cape Verde Portable Hand-Thrown Extinguisher Market (2026-2032)
- Canada Portable Hand-Thrown Extinguisher Market (2026-2032)
- Cameroon Portable Hand-Thrown Extinguisher Market (2026-2032)
- Burundi Portable Hand-Thrown Extinguisher Market (2026-2032)
- Burkina Faso Portable Hand-Thrown Extinguisher Market (2026-2032)
- Bulgaria Portable Hand-Thrown Extinguisher Market (2026-2032)
- Brunei Portable Hand-Thrown Extinguisher Market (2026-2032)
- Botswana Portable Hand-Thrown Extinguisher Market (2026-2032)
- Bosnia and Herzegovina Portable Hand-Thrown Extinguisher Market (2026-2032)
Industry Events and Analyst Meet

HIMTEX 2026

India Refining Summit 2026

India EV Show 2026

EV tech India Expo 2026

Auto Tech Asia 2026
Whitepaper
- Middle East & Africa Commercial Security Market Click here to view more.
- Middle East & Africa Fire Safety Systems & Equipment Market Click here to view more.
- GCC Drone Market Click here to view more.
- Middle East Lighting Fixture Market Click here to view more.
- GCC Physical & Perimeter Security Market Click here to view more.