Georgia Solenoid Valve Market (2026-2032) Outlook | Analysis, Companies, Trends, Forecast, Share, Size, Industry, Value, Growth & Revenue
Market Forecast By Body Material (Stainless Steel, Brass, Aluminium, Plastic), By Valve Design Type (2-way, 3-way, 4-way, 5-way), By Industry (Oil & Gas, Chemical & Petrochemical, Water & Wastewater, Food & Beverages, Power Generation, Pharmaceuticals, Automotive, Others) And Competitive Landscape
| Product Code: ETC129220 | Publication Date: Jun 2021 | Updated Date: Jun 2026 | Product Type: Report | |
| Publisher: 6Wresearch | Author: Summon Dutta | No. of Pages: 70 | No. of Figures: 35 | No. of Tables: 5 |
Georgia Solenoid Valve Market Size, Share & Growth Rate
The Georgia Solenoid Valve Market was estimated at USD 1275 Million in 2025 and is projected to reach USD 1825 Million by 2032, growing at a CAGR of 5.3% from 2026 to 2032. This upward trajectory is largely fueled by the state's dynamic industrial landscape, which encompasses sectors such as manufacturing, oil & gas, and water treatment. The ongoing trends towards automation and infrastructure development are further amplifying the demand for solenoid valves, which are integral to efficient fluid control systems across various applications.
Georgia Solenoid Valve Market Growth Rate Analysis (2021-2032)
The Georgia solenoid valve market has exhibited a stable growth pattern, beginning with a 6.2% increase in 2021 and tapering slightly to 5.9% in 2022 due to brief disruptions in industrial production. However, demand regained momentum in 2023, recording a 6.0% growth as sectors like manufacturing and water management ramped up their operations. Projections indicate continued expansion, with growth anticipated to reach 6.4% by 2026. This trend is driven by advancements in automation and a shift towards energy-efficient solutions, as businesses increasingly invest in modernizing their infrastructure. By 2032, the market is expected to stabilize around 6.2%, reflecting ongoing consumer demand amid the digitalization of industrial practices.
Georgia Solenoid Valve Market Year-wise Growth Rate and Key Drivers
This graph highlights how the Georgia Solenoid Valve Market has steadily grown over the past five years, supported by major growth factors.
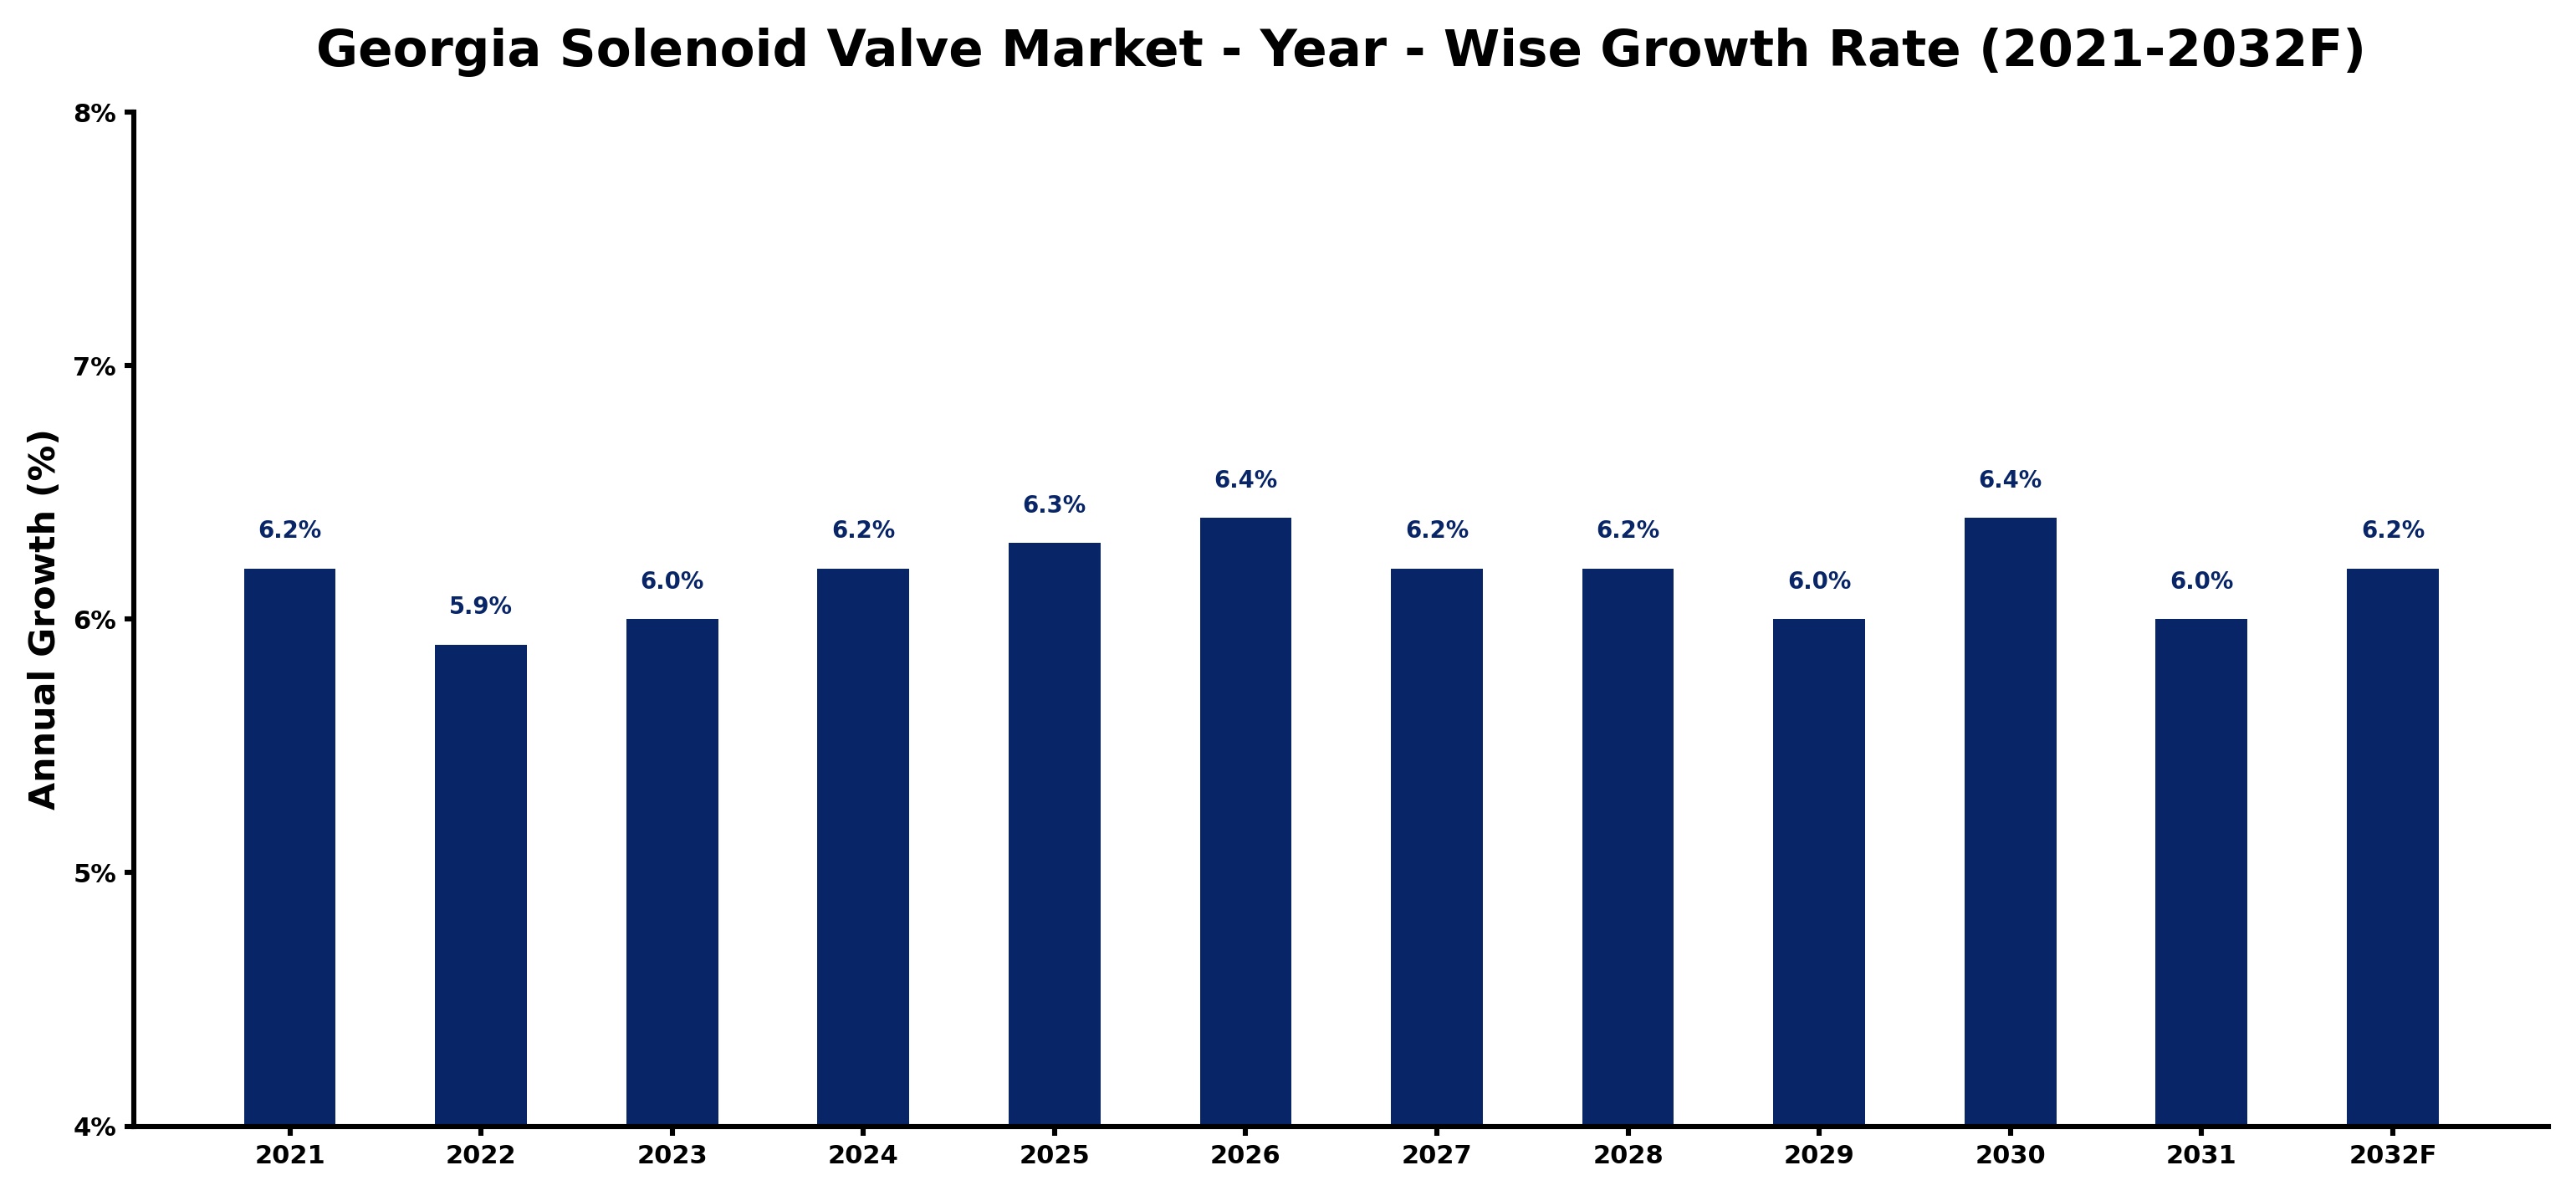
The table below presents the year‑wise growth rates along with the key drivers influencing the market
| Year | Growth Rate | Major Drivers |
| 2021 | 6.2% | Government infrastructure modernization initiatives |
| 2022 | 5.9% | Growing renewable energy integration projects |
| 2023 | 6.0% | Rapid growth in telecom and data center sectors |
| 2024 | 6.2% | Rising electricity demand across industries |
| 2025 | 6.3% | Increasing smart city development projects |
| 2026 | 6.4% | Increasing industrial infrastructure investments |
| 2027 | 6.2% | Rapid growth in telecom and data center sectors |
| 2028 | 6.2% | Expansion of manufacturing activities |
| 2029 | 6.0% | Growing urbanization and commercial development |
| 2030 | 6.4% | Rising electricity demand across industries |
| 2031 | 6.0% | Expansion of manufacturing activities |
| 2032 | 6.2% | Rapid growth in telecom and data center sectors |
Note - Market size estimations and growth projections presented in this report are based on 6Wresearch’s advanced forecasting approach, validated with industry datasets as of June 2026.
Georgia Solenoid Valve Market Synopsis
While the Georgia Solenoid Valve Market has experienced recent momentum driven by increasing investments and technological adoption, it stands at the precipice of even greater growth. The confluence of industrial advancements and a shift towards energy-efficient solutions positions this market for robust expansion in the coming years.
The market's trajectory is not only influenced by internal industrial demands but also by external regulatory pressures aimed at enhancing environmental sustainability. As organizations seek to comply with stringent regulations and focus on minimizing their carbon footprint, the adoption of advanced solenoid valves is expected to accelerate.
Georgia Solenoid Valve Market Key Takeaways
- The Georgia Solenoid Valve Market is experiencing a significant growth trajectory, driven by rising industrial automation and infrastructure development.
- Investment in environmentally sustainable solutions is reshaping product offerings and driving innovation in solenoid valve technology.
- Strategic partnerships and product customization are essential for manufacturers to maintain a competitive edge in this evolving landscape.
- Key industries such as automotive, oil & gas, and water treatment are primary demand drivers for solenoid valves in Georgia.
- The market is poised for growth, reflecting an increasing focus on energy efficiency and automation across various sectors.
Evaluation of Restraints in Georgia Solenoid Valve Market
Despite the positive outlook, several restraints challenge the growth of the Georgia Solenoid Valve Market. Intense competition among domestic and international manufacturers means companies must continuously innovate to meet customer expectations for reliability and efficiency. Furthermore, fluctuations in raw material prices can pose significant obstacles, impacting overall production costs. Regulatory changes can also create uncertainty, compelling businesses to adapt their strategies promptly to remain compliant and competitive.
Georgia Solenoid Valve Market Trends
A prominent trend shaping the Georgia Solenoid Valve Market is the integration of smart technologies. Manufacturers are increasingly adopting features like remote monitoring and predictive maintenance, allowing for enhanced operational efficiency and reduced downtime. Additionally, there is a rising demand for valves that prioritize reliability, durability, and energy efficiency. This trend is echoed by the growing preference for eco-friendly solutions, as industries strive to align with environmental regulations.
Georgia Solenoid Valve Market Opportunities
The market presents several investment opportunities, particularly in sectors poised for growth, such as automotive and healthcare. With Georgia's strong manufacturing base and ongoing infrastructure projects, the need for solenoid valves remains consistent. Companies focusing on innovation, especially in automation technologies, are well-positioned to capitalize on this increasing demand. Furthermore, investors can explore partnerships with firms engaged in developing energy-efficient solenoid valve solutions.
Government Initiatives in the Georgia Solenoid Valve Market
Government policies in Georgia play a significant role in shaping the Solenoid Valve Market. The state's adherence to environmental protection laws and safety standards promotes the adoption of more efficient and sustainable valve solutions. Moreover, incentives or subsidies may be available for businesses that invest in energy-efficient technologies. It's essential for market players to stay informed about these initiatives, as they can provide both support and guidance for strategic business decisions.
Future Insights of the Georgia Solenoid Valve Market
Looking ahead to 2026-2032, the Georgia Solenoid Valve Market is anticipated to thrive, driven by ongoing advancements in industrial automation and the increasing integration of IoT technology. The push for energy-efficient and smart manufacturing practices will further fuel the demand for solenoid valves, positioning them as critical components in modern fluid control systems. Companies that prioritize innovation and adapt quickly to evolving market dynamics will find themselves leading in this promising landscape.
Georgia Solenoid Valve Market Latest Developments (May 2025 - June 2026)
Recent developments in the Georgia Solenoid Valve Market reflect a growing emphasis on smart technologies and automation. New collaborations between manufacturers aim to enhance product features, such as predictive maintenance capabilities and energy-efficient designs. Additionally, industry players are increasingly focusing on developing solutions that comply with new environmental regulations, aligning their products with the market's shift towards sustainability. These directions not only highlight technological advancements but also showcase the market's responsiveness to regulatory changes.
Georgia Solenoid Valve Market - Key Attractiveness of the Report
- 10 Years of Market Numbers
- Historical Data Starting from 2022 to 2025
- Base Year: 2025
- Forecast Data until 2032
- Key Performance Indicators Impacting the Market
- Major Upcoming Developments and Projects
Key Highlights of the Report:
- Georgia Solenoid Valve Market Outlook
- Market Size of Georgia Solenoid Valve Market, 2025
- Forecast of Georgia Solenoid Valve Market, 2032
- Historical Data and Forecast of Georgia Solenoid Valve Revenues & Volume for the Period 2022-2032F
- Georgia Solenoid Valve Market Trend Evolution
- Georgia Solenoid Valve Market Drivers and Challenges
- Georgia Solenoid Valve Price Trends
- Georgia Solenoid Valve Porter's Five Forces
- Georgia Solenoid Valve Industry Life Cycle
- Historical Data and Forecast of Georgia Solenoid Valve Market Revenues & Volume By Body Material for the Period 2022-2032F
- Historical Data and Forecast of Georgia Solenoid Valve Market Revenues & Volume By Stainless Steel for the Period 2022-2032F
- Historical Data and Forecast of Georgia Solenoid Valve Market Revenues & Volume By Brass for the Period 2022-2032F
- Historical Data and Forecast of Georgia Solenoid Valve Market Revenues & Volume By Aluminium for the Period 2022-2032F
- Historical Data and Forecast of Georgia Solenoid Valve Market Revenues & Volume By Plastic for the Period 2022-2032F
- Historical Data and Forecast of Georgia Solenoid Valve Market Revenues & Volume By Valve Design Type for the Period 2022-2032F
- Historical Data and Forecast of Georgia Solenoid Valve Market Revenues & Volume By 2-way for the Period 2022-2032F
- Historical Data and Forecast of Georgia Solenoid Valve Market Revenues & Volume By 3-way for the Period 2022-2032F
- Historical Data and Forecast of Georgia Solenoid Valve Market Revenues & Volume By 4-way for the Period 2022-2032F
- Historical Data and Forecast of Georgia Solenoid Valve Market Revenues & Volume By 5-way for the Period 2022-2032F
- Historical Data and Forecast of Georgia Solenoid Valve Market Revenues & Volume By Industry for the Period 2022-2032F
- Historical Data and Forecast of Georgia Solenoid Valve Market Revenues & Volume By Oil & Gas for the Period 2022-2032F
- Historical Data and Forecast of Georgia Solenoid Valve Market Revenues & Volume By Chemical & Petrochemical for the Period 2022-2032F
- Historical Data and Forecast of Georgia Solenoid Valve Market Revenues & Volume By Water & Wastewater for the Period 2022-2032F
- Historical Data and Forecast of Georgia Solenoid Valve Market Revenues & Volume By Food & Beverages for the Period 2022-2032F
- Historical Data and Forecast of Georgia Solenoid Valve Market Revenues & Volume By Power Generation for the Period 2022-2032F
- Historical Data and Forecast of Georgia Solenoid Valve Market Revenues & Volume By Pharmaceuticals for the Period 2022-2032F
- Historical Data and Forecast of Georgia Solenoid Valve Market Revenues & Volume By Automotive for the Period 2022-2032F
- Historical Data and Forecast of Georgia Solenoid Valve Market Revenues & Volume By Others for the Period 2022-2032F
- Georgia Solenoid Valve Import Export Trade Statistics
- Market Opportunity Assessment By Body Material
- Market Opportunity Assessment By Valve Design Type
- Market Opportunity Assessment By Industry
- Georgia Solenoid Valve Top Companies Market Share
- Georgia Solenoid Valve Competitive Benchmarking By Technical and Operational Parameters
- Georgia Solenoid Valve Company Profiles
- Georgia Solenoid Valve Key Strategic Recommendations
Georgia Solenoid Valve Market - Frequently Asked Questions
Key drivers include increasing industrial automation, infrastructure investments, and a push for energy-efficient solutions across various sectors, including oil & gas and water treatment.
The market was estimated at USD 1275 Million in 2025 and is projected to reach USD 1825 Million by 2032, growing at a CAGR of 5.3% from 2026 to 2032.
Companies face challenges such as fluctuating raw material prices, regulatory compliance, and the need to continuously innovate to stay competitive in a crowded marketplace.
The largest consumers include the manufacturing, oil & gas, water treatment, and automotive sectors, each driving unique demand for solenoid valve solutions.
Environmental regulations are promoting the adoption of energy-efficient and sustainable solenoid valve solutions, compelling manufacturers to innovate in line with these regulatory frameworks.
Automation is a significant trend, with manufacturers integrating smart features into solenoid valves, enhancing operational efficiency and reducing the need for manual intervention.
6Wresearch actively monitors the Georgia Solenoid Valve Market and publishes its comprehensive annual report, highlighting emerging trends, growth drivers, revenue analysis, and forecast outlook. Our insights help businesses to make data-backed strategic decisions with ongoing market dynamics. Our analysts track relevent industries related to the Georgia Solenoid Valve Market, allowing our clients with actionable intelligence and reliable forecasts tailored to emerging regional needs.
Yes, we provide customisation as per your requirements. To learn more, feel free to contact us on sales@6wresearch.com
Georgia Solenoid Valve |
1 Executive Summary |
2 Introduction |
2.1 Key Highlights of the Report |
2.2 Report Description |
2.3 Market Scope & Segmentation |
2.4 Research Methodology |
2.5 Assumptions |
3 Georgia Solenoid Valve Market Overview |
3.1 Georgia Country Macro Economic Indicators |
3.2 Georgia Solenoid Valve Market Revenues & Volume, 2022 & 2032F |
3.3 Georgia Solenoid Valve Market - Industry Life Cycle |
3.4 Georgia Solenoid Valve Market - Porter's Five Forces |
3.5 Georgia Solenoid Valve Market Revenues & Volume Share, By Body Material, 2022 & 2032F |
3.6 Georgia Solenoid Valve Market Revenues & Volume Share, By Valve Design Type, 2022 & 2032F |
3.7 Georgia Solenoid Valve Market Revenues & Volume Share, By Industry, 2022 & 2032F |
4 Georgia Solenoid Valve Market Dynamics |
4.1 Impact Analysis |
4.2 Market Drivers |
4.3 Market Restraints |
5 Georgia Solenoid Valve Market Trends |
6 Georgia Solenoid Valve Market, By Types |
6.1 Georgia Solenoid Valve Market, By Body Material |
6.1.1 Overview and Analysis |
6.1.2 Georgia Solenoid Valve Market Revenues & Volume, By Body Material, 2022-2032F |
6.1.3 Georgia Solenoid Valve Market Revenues & Volume, By Stainless Steel, 2022-2032F |
6.1.4 Georgia Solenoid Valve Market Revenues & Volume, By Brass, 2022-2032F |
6.1.5 Georgia Solenoid Valve Market Revenues & Volume, By Aluminium, 2022-2032F |
6.1.6 Georgia Solenoid Valve Market Revenues & Volume, By Plastic, 2022-2032F |
6.2 Georgia Solenoid Valve Market, By Valve Design Type |
6.2.1 Overview and Analysis |
6.2.2 Georgia Solenoid Valve Market Revenues & Volume, By 2-way, 2022-2032F |
6.2.3 Georgia Solenoid Valve Market Revenues & Volume, By 3-way, 2022-2032F |
6.2.4 Georgia Solenoid Valve Market Revenues & Volume, By 4-way, 2022-2032F |
6.2.5 Georgia Solenoid Valve Market Revenues & Volume, By 5-way, 2022-2032F |
6.3 Georgia Solenoid Valve Market, By Industry |
6.3.1 Overview and Analysis |
6.3.2 Georgia Solenoid Valve Market Revenues & Volume, By Oil & Gas, 2022-2032F |
6.3.3 Georgia Solenoid Valve Market Revenues & Volume, By Chemical & Petrochemical, 2022-2032F |
6.3.4 Georgia Solenoid Valve Market Revenues & Volume, By Water & Wastewater, 2022-2032F |
6.3.5 Georgia Solenoid Valve Market Revenues & Volume, By Food & Beverages, 2022-2032F |
6.3.6 Georgia Solenoid Valve Market Revenues & Volume, By Power Generation, 2022-2032F |
6.3.7 Georgia Solenoid Valve Market Revenues & Volume, By Pharmaceuticals, 2022-2032F |
6.3.8 Georgia Solenoid Valve Market Revenues & Volume, By Others, 2022-2032F |
6.3.9 Georgia Solenoid Valve Market Revenues & Volume, By Others, 2022-2032F |
7 Georgia Solenoid Valve Market Import-Export Trade Statistics |
7.1 Georgia Solenoid Valve Market Export to Major Countries |
7.2 Georgia Solenoid Valve Market Imports from Major Countries |
8 Georgia Solenoid Valve Market Key Performance Indicators |
9 Georgia Solenoid Valve Market - Opportunity Assessment |
9.1 Georgia Solenoid Valve Market Opportunity Assessment, By Body Material, 2022 & 2032F |
9.2 Georgia Solenoid Valve Market Opportunity Assessment, By Valve Design Type, 2022 & 2032F |
9.3 Georgia Solenoid Valve Market Opportunity Assessment, By Industry, 2022 & 2032F |
10 Georgia Solenoid Valve Market - Competitive Landscape |
10.1 Georgia Solenoid Valve Market Revenue Share, By Companies, 2025 |
10.2 Georgia Solenoid Valve Market Competitive Benchmarking, By Operating and Technical Parameters |
11 Company Profiles |
12 Recommendations |
13 Disclaimer |
Global Go To Market Strategy - 2030
Export potential enables firms to identify high-growth global markets with greater confidence by combining advanced trade intelligence with a structured quantitative methodology. The framework analyzes emerging demand trends and country-level import patterns while integrating macroeconomic and trade datasets such as GDP and population forecasts, bilateral import–export flows, tariff structures, elasticity differentials between developed and developing economies, geographic distance, and import demand projections. Using weighted trade values from 2020–2024 as the base period to project country-to-country export potential for 2030, these inputs are operationalized through calculated drivers such as gravity model parameters, tariff impact factors, and projected GDP per-capita growth. Through an analysis of hidden potentials, demand hotspots, and market conditions that are most favorable to success, this method enables firms to focus on target countries, maximize returns, and global expansion with data, backed by accuracy.
By factoring in the projected importer demand gap that is currently unmet and could be potential opportunity, it identifies the potential for the Exporter (Country) among 190 countries, against the general trade analysis, which identifies the biggest importer or exporter.
To discover high-growth global markets and optimize your business strategy:
Click Here
Pricing
- Single User License$ 1,995
- Department License$ 2,400
- Site License$ 3,120
- Global License$ 3,795

Leadership Perspectives from Industry Events
Search
Thought Leadership and Analyst Meet


Our Clients
6WResearch In News
- India Air Conditioner Market Set for Strong Rebound in 2026 After Weather-Led Correction and GST-Driven Recovery: 6Wresearch
- ADAS in India: How Automatic Emergency Braking, Blind Spot Detection & Driver Monitoring are Transforming Road Safety
- Doha a strategic location for EV manufacturing hub: IPA Qatar
- Demand for luxury TVs surging in the GCC, says Samsung
- Empowering Growth: The Thriving Journey of Bangladesh’s Cable Industry
- Demand for luxury TVs surging in the GCC, says Samsung
Latest Reports
- Nicaragua RPG Gaming Market (2026-2032)
- New Zealand RPG Gaming Market (2026-2032)
- Netherlands RPG Gaming Market (2026-2032)
- Nauru RPG Gaming Market (2026-2032)
- Namibia RPG Gaming Market (2026-2032)
- Mozambique RPG Gaming Market (2026-2032)
- Montenegro RPG Gaming Market (2026-2032)
- Mongolia RPG Gaming Market (2026-2032)
- Monaco RPG Gaming Market (2026-2032)
- Micronesia RPG Gaming Market (2026-2032)
Industry Events and Analyst Meet

HIMTEX 2026

India Refining Summit 2026

India EV Show 2026

EV tech India Expo 2026

Auto Tech Asia 2026
Whitepaper
- Middle East & Africa Commercial Security Market Click here to view more.
- Middle East & Africa Fire Safety Systems & Equipment Market Click here to view more.
- GCC Drone Market Click here to view more.
- Middle East Lighting Fixture Market Click here to view more.
- GCC Physical & Perimeter Security Market Click here to view more.