Ghana 3D Holographic Display and Services Market (2026-2032) Outlook | Analysis, Size, Forecast, Growth, Value, Trends, Companies, Industry, Share & Revenue
Market Forecast By End-users (Media and Entertainment, Consumer Electronics, Healthcare, Automotive, Retail, Others) And Competitive Landscape
| Product Code: ETC066795 | Publication Date: Aug 2021 | Updated Date: Jun 2026 | Product Type: Report | |
| Publisher: 6Wresearch | Author: Sachin Kumar Rai | No. of Pages: 70 | No. of Figures: 35 | No. of Tables: 5 |
Ghana 3D Holographic Display and Services Market Size, Share & Growth Rate
The Ghana 3D Holographic Display and Services Market was estimated at USD 169 Million in 2025 and is projected to reach USD 234 Million by 2032, growing at a CAGR of 4.8% from 2026 to 2032. This growth trajectory is fueled by an increasing appetite for innovative marketing solutions, with businesses eager to captivate their audiences through immersive experiences. Enhanced customer engagement, particularly in sectors such as retail and entertainment, further underpins this expansion as companies leverage holographic displays to differentiate their branding and messaging.
Ghana 3D Holographic Display and Services Market Year-wise Growth Rate and Key Drivers
This graph highlights how the Ghana 3D Holographic Display and Services Market has steadily grown over the years, supported by major growth factors.
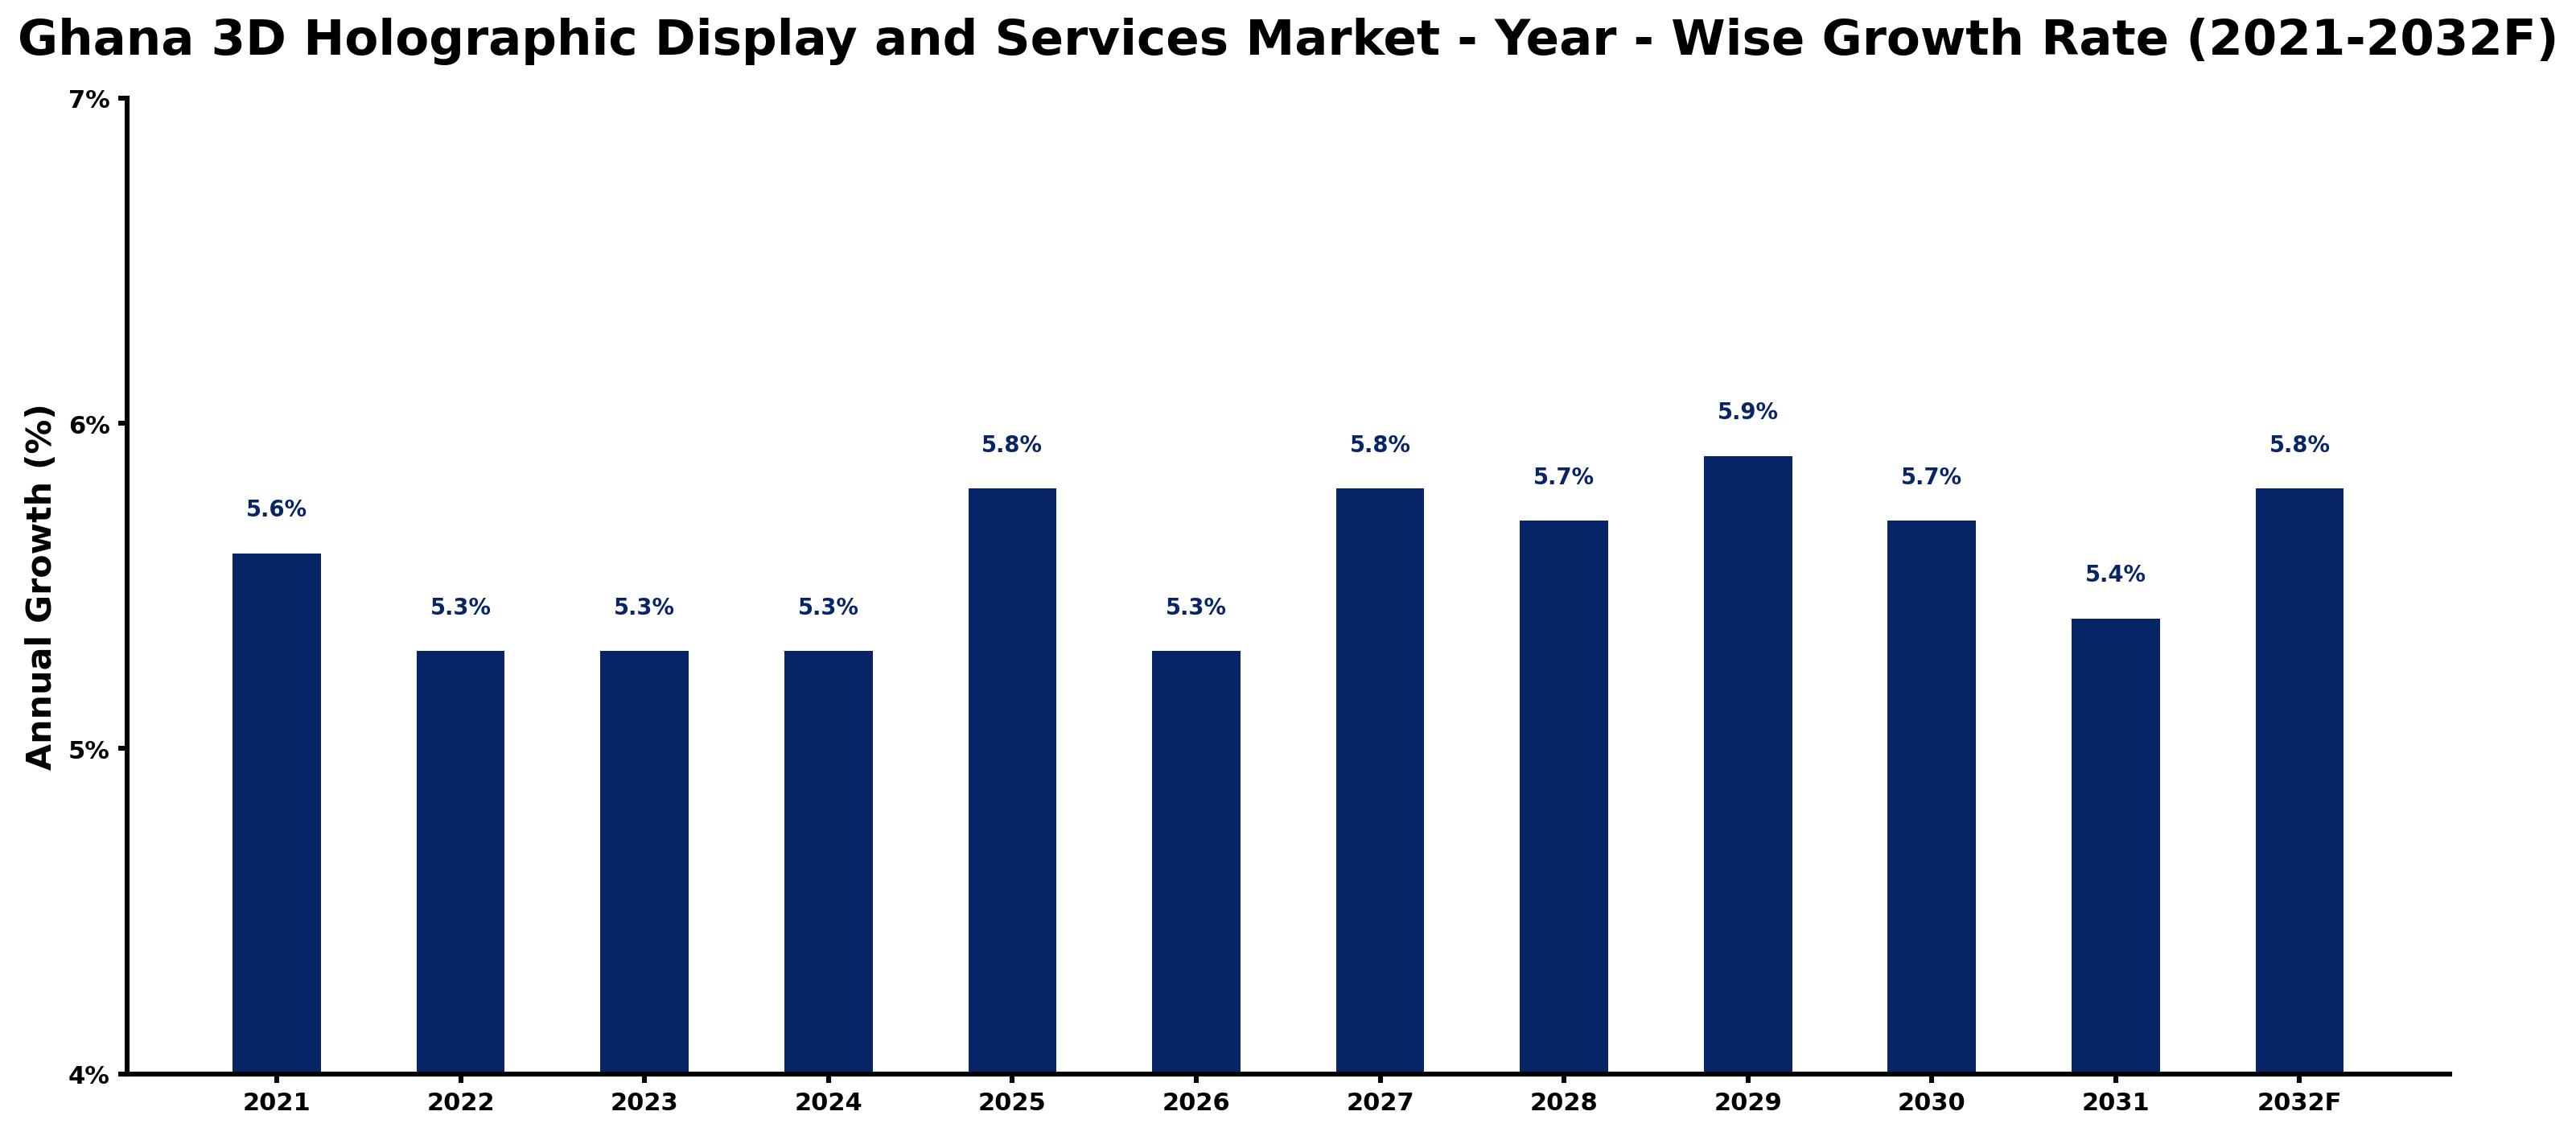
The table below presents the year‑wise growth rates along with the key drivers influencing the market
| Year | Growth Rate | Major Drivers |
| 2021 | 5.6% | Increasing industrial infrastructure investments |
| 2022 | 5.3% | Growing urbanization and commercial development |
| 2023 | 5.3% | Rising electricity demand across industries |
| 2024 | 5.3% | Increasing adoption of advanced technologies |
| 2025 | 5.8% | Increasing industrial infrastructure investments |
| 2026 | 5.3% | Increasing adoption of advanced technologies |
| 2027 | 5.8% | Growing urbanization and commercial development |
| 2028 | 5.7% | Expansion of commercial construction activities |
| 2029 | 5.9% | Expansion of manufacturing activities |
| 2030 | 5.7% | Increasing adoption of advanced technologies |
| 2031 | 5.4% | Increasing smart city development projects |
| 2032 | 5.8% | Rising electricity demand across industries |
Note - Market size estimations and growth projections presented in this report are based on 6Wresearch’s advanced forecasting approach, validated with industry datasets as of June 2026.
Ghana 3D Holographic Display and Services Market Synopsis
In Ghana, the 3D holographic display and services market is witnessing transformative changes, driven by advancements in technology and the need for engaging visual experiences. Businesses across diverse sectors, from advertising to education, are increasingly incorporating holographic displays to enhance their outreach and appeal.
Current developments highlight a shift towards utilizing holography not only for marketing but also for educational purposes, thereby broadening its applicability. As technology improves, it becomes more accessible, allowing a wider range of companies to utilize these captivating displays for various events and promotions.
Ghana 3D Holographic Display and Services Market Key Takeaways
- The market is projected to grow at a CAGR of 4.8% from 2026 to 2032, indicating a robust demand for holographic solutions.
- Technological advancements are enhancing display quality and interactivity, making holographic displays more appealing to consumers.
- The adoption of 3D holographic displays is rising across sectors like retail, healthcare, and education.
- Investment opportunities abound in companies that specialize in innovative display solutions.
- Government initiatives are creating a favorable environment for market growth through policy support and infrastructure development.
Evaluation of Restraints in Ghana 3D Holographic Display and Services Market
Despite the promising growth potential, the Ghana 3D holographic display and services market faces notable constraints. One significant hurdle is the limited understanding of holographic technology among consumers and businesses, which hampers widespread adoption. Moreover, the initial investment costs associated with implementing these advanced displays can deter potential users. Compounding these issues, infrastructure challenges, such as inconsistent internet connectivity and frequent power outages, pose additional barriers to successful implementation. Lastly, the competition from traditional advertising mediums and emerging technologies like augmented and virtual reality complicates the landscape further.
Ghana 3D Holographic Display and Services Market Trends
Several trends are shaping the Ghana 3D holographic display and services market. A noticeable shift towards experiential marketing is evident, as brands seek to create memorable experiences for consumers. The rising utilization of holographic displays in virtual events, product launches, and digital signage illustrates this trend. Furthermore, ongoing technological innovations are enhancing the interactivity and realism of holograms, significantly elevating consumer engagement levels. As industries continue to prioritize unique branding strategies, the demand for captivating visual experiences is set to increase.
Ghana 3D Holographic Display and Services Market Opportunities
Genuine growth opportunities are present across various sectors in the Ghana 3D holographic display and services market. As companies increasingly embrace digital marketing strategies, investment in 3D holographic display technology can provide a competitive edge. The healthcare sector, for instance, is beginning to explore these displays for educational and training purposes, creating new avenues for application. Additionally, as the trend of virtual events continues to rise, there is significant potential for organizations that can offer innovative holographic solutions tailored to this demand.
Government Initiatives in the Ghana 3D Holographic Display and Services Market
The Ghanaian government is actively fostering the growth of the 3D holographic display and services market through various supportive policies. Initiatives include tax incentives for companies investing in research and development of advanced technologies and promoting partnerships between local and international firms. Furthermore, there are ongoing programs aimed at enhancing digital literacy among the workforce, ensuring a skilled talent pool is available to meet industry needs. Efforts to streamline regulations related to the holographic display sector are also noteworthy, as they aim to cultivate a conducive business environment.
Future Insights of the Ghana 3D Holographic Display and Services Market
Looking ahead to the period between 2026 and 2032, the Ghana 3D holographic display and services market appears poised for substantial growth. The ongoing technological advancements will likely drive further demand for innovative advertising solutions across various industries. As businesses focus increasingly on enhancing customer experiences and engagement, holographic displays will become essential in marketing and communication strategies. With the potential for increased adoption and the continuous evolution of the technology, the market is set to flourish in the coming years.
Ghana 3D Holographic Display and Services Market Latest Developments (May 2025 - June 2026)
Recent industry developments indicate a surge in interest toward the deployment of holographic displays for both marketing and educational purposes. As companies explore hybrid event formats, the integration of holographic technology into virtual settings is gaining traction. Additionally, there is a noticeable uptick in collaborations between local firms and international technology partners, enhancing the development and customization of holographic solutions tailored to the Ghanaian market.
Ghana 3D Holographic Display and Services Market - Key Attractiveness of the Report
- 10 Years of Market Numbers
- Historical Data Starting from 2022 to 2025
- Base Year: 2025
- Forecast Data until 2032
- Key Performance Indicators Impacting the Market
- Major Upcoming Developments and Projects
Key Highlights of the Report:
- Ghana 3D Holographic Display and Services Market Outlook
- Market Size of Ghana 3D Holographic Display and Services Market, 2025
- Forecast of Ghana 3D Holographic Display and Services Market, 2032
- Historical Data and Forecast of Ghana 3D Holographic Display and Services Revenues & Volume for the Period 2022-2032F
- Ghana 3D Holographic Display and Services Market Trend Evolution
- Ghana 3D Holographic Display and Services Market Drivers and Challenges
- Ghana 3D Holographic Display and Services Price Trends
- Ghana 3D Holographic Display and Services Porter's Five Forces
- Ghana 3D Holographic Display and Services Industry Life Cycle
- Historical Data and Forecast of Ghana 3D Holographic Display and Services Market Revenues & Volume By End-users for the Period 2022-2032F
- Historical Data and Forecast of Ghana 3D Holographic Display and Services Market Revenues & Volume By Media and Entertainment for the Period 2022-2032F
- Historical Data and Forecast of Ghana 3D Holographic Display and Services Market Revenues & Volume By Consumer Electronics for the Period 2022-2032F
- Historical Data and Forecast of Ghana 3D Holographic Display and Services Market Revenues & Volume By Healthcare for the Period 2022-2032F
- Historical Data and Forecast of Ghana 3D Holographic Display and Services Market Revenues & Volume By Automotive for the Period 2022-2032F
- Historical Data and Forecast of Ghana 3D Holographic Display and Services Market Revenues & Volume By Retail for the Period 2022-2032F
- Historical Data and Forecast of Ghana 3D Holographic Display and Services Market Revenues & Volume By Others for the Period 2022-2032F
- Ghana 3D Holographic Display and Services Import Export Trade Statistics
- Market Opportunity Assessment By End-users
- Ghana 3D Holographic Display and Services Top Companies Market Share
- Ghana 3D Holographic Display and Services Competitive Benchmarking By Technical and Operational Parameters
- Ghana 3D Holographic Display and Services Company Profiles
- Ghana 3D Holographic Display and Services Key Strategic Recommendations
Ghana 3D Holographic Display and Services Market - Frequently Asked Questions
The market is projected to grow at a CAGR of 4.8% from 2026 to 2032, reaching USD 234 Million by 2032 from an estimated USD 169 Million in 2025.
The retail and entertainment sectors are leading the charge, but we are seeing increasing interest in education and healthcare applications as well.
Major challenges include high initial costs, limited consumer awareness, and infrastructure issues such as power outages and connectivity problems.
Yes, the Ghanaian government is implementing policies that offer tax incentives and promote partnerships between local and international companies to support growth in this sector.
Digital marketing strategies are crucial, as businesses are increasingly looking for innovative ways to enhance customer engagement, making holographic displays an attractive option.
The demand is largely driven by the need for captivating visual experiences that enhance marketing efforts and create immersive brand interactions.
6Wresearch actively monitors the Ghana 3D Holographic Display and Services Market and publishes its comprehensive annual report, highlighting emerging trends, growth drivers, revenue analysis, and forecast outlook. Our insights help businesses to make data-backed strategic decisions with ongoing market dynamics. Our analysts track relevent industries related to the Ghana 3D Holographic Display and Services Market, allowing our clients with actionable intelligence and reliable forecasts tailored to emerging regional needs.
Yes, we provide customisation as per your requirements. To learn more, feel free to contact us on sales@6wresearch.com
1 Executive Summary |
2 Introduction |
2.1 Key Highlights of the Report |
2.2 Report Description |
2.3 Market Scope & Segmentation |
2.4 Research Methodology |
2.5 Assumptions |
3 Ghana 3D Holographic Display and Services Market Overview |
3.1 Ghana Country Macro Economic Indicators |
3.2 Ghana 3D Holographic Display and Services Market Revenues & Volume, 2022 & 2032F |
3.3 Ghana 3D Holographic Display and Services Market - Industry Life Cycle |
3.4 Ghana 3D Holographic Display and Services Market - Porter's Five Forces |
3.5 Ghana 3D Holographic Display and Services Market Revenues & Volume Share, By End-users, 2022 & 2032F |
4 Ghana 3D Holographic Display and Services Market Dynamics |
4.1 Impact Analysis |
4.2 Market Drivers |
4.3 Market Restraints |
5 Ghana 3D Holographic Display and Services Market Trends |
6 Ghana 3D Holographic Display and Services Market, By Types |
6.1 Ghana 3D Holographic Display and Services Market, By End-users |
6.1.1 Overview and Analysis |
6.1.2 Ghana 3D Holographic Display and Services Market Revenues & Volume, By End-users, 2022-2032F |
6.1.3 Ghana 3D Holographic Display and Services Market Revenues & Volume, By Media and Entertainment, 2022-2032F |
6.1.4 Ghana 3D Holographic Display and Services Market Revenues & Volume, By Consumer Electronics, 2022-2032F |
6.1.5 Ghana 3D Holographic Display and Services Market Revenues & Volume, By Healthcare, 2022-2032F |
6.1.6 Ghana 3D Holographic Display and Services Market Revenues & Volume, By Automotive, 2022-2032F |
6.1.7 Ghana 3D Holographic Display and Services Market Revenues & Volume, By Retail, 2022-2032F |
6.1.8 Ghana 3D Holographic Display and Services Market Revenues & Volume, By Others, 2022-2032F |
7 Ghana 3D Holographic Display and Services Market Import-Export Trade Statistics |
7.1 Ghana 3D Holographic Display and Services Market Export to Major Countries |
7.2 Ghana 3D Holographic Display and Services Market Imports from Major Countries |
8 Ghana 3D Holographic Display and Services Market Key Performance Indicators |
9 Ghana 3D Holographic Display and Services Market - Opportunity Assessment |
9.1 Ghana 3D Holographic Display and Services Market Opportunity Assessment, By End-users, 2022 & 2032F |
10 Ghana 3D Holographic Display and Services Market - Competitive Landscape |
10.1 Ghana 3D Holographic Display and Services Market Revenue Share, By Companies, 2025 |
10.2 Ghana 3D Holographic Display and Services Market Competitive Benchmarking, By Operating and Technical Parameters |
11 Company Profiles |
12 Recommendations |
13 Disclaimer |
Global Go To Market Strategy - 2030
Export potential enables firms to identify high-growth global markets with greater confidence by combining advanced trade intelligence with a structured quantitative methodology. The framework analyzes emerging demand trends and country-level import patterns while integrating macroeconomic and trade datasets such as GDP and population forecasts, bilateral import–export flows, tariff structures, elasticity differentials between developed and developing economies, geographic distance, and import demand projections. Using weighted trade values from 2020–2024 as the base period to project country-to-country export potential for 2030, these inputs are operationalized through calculated drivers such as gravity model parameters, tariff impact factors, and projected GDP per-capita growth. Through an analysis of hidden potentials, demand hotspots, and market conditions that are most favorable to success, this method enables firms to focus on target countries, maximize returns, and global expansion with data, backed by accuracy.
By factoring in the projected importer demand gap that is currently unmet and could be potential opportunity, it identifies the potential for the Exporter (Country) among 190 countries, against the general trade analysis, which identifies the biggest importer or exporter.
To discover high-growth global markets and optimize your business strategy:
Click Here
Pricing
- Single User License$ 1,995
- Department License$ 2,400
- Site License$ 3,120
- Global License$ 3,795

Leadership Perspectives from Industry Events
Search
Thought Leadership and Analyst Meet


Our Clients
6WResearch In News
- India Air Conditioner Market Set for Strong Rebound in 2026 After Weather-Led Correction and GST-Driven Recovery: 6Wresearch
- ADAS in India: How Automatic Emergency Braking, Blind Spot Detection & Driver Monitoring are Transforming Road Safety
- Doha a strategic location for EV manufacturing hub: IPA Qatar
- Demand for luxury TVs surging in the GCC, says Samsung
- Empowering Growth: The Thriving Journey of Bangladesh’s Cable Industry
- Demand for luxury TVs surging in the GCC, says Samsung
Latest Reports
- Nicaragua RPG Gaming Market (2026-2032)
- New Zealand RPG Gaming Market (2026-2032)
- Netherlands RPG Gaming Market (2026-2032)
- Nauru RPG Gaming Market (2026-2032)
- Namibia RPG Gaming Market (2026-2032)
- Mozambique RPG Gaming Market (2026-2032)
- Montenegro RPG Gaming Market (2026-2032)
- Mongolia RPG Gaming Market (2026-2032)
- Monaco RPG Gaming Market (2026-2032)
- Micronesia RPG Gaming Market (2026-2032)
Industry Events and Analyst Meet

EV India Expo 2026

HIMTEX 2026

India Refining Summit 2026

India EV Show 2026

EV tech India Expo 2026
Whitepaper
- Middle East & Africa Commercial Security Market Click here to view more.
- Middle East & Africa Fire Safety Systems & Equipment Market Click here to view more.
- GCC Drone Market Click here to view more.
- Middle East Lighting Fixture Market Click here to view more.
- GCC Physical & Perimeter Security Market Click here to view more.