Ghana Tables Market (2026-2032) | Share, Size, Forecast, Analysis, Trends, Industry, Companies, Growth, Outlook, Revenue & Value
Market Forecast By Types (Fabric, Leather, Metal, Wooden, Others), By Applications (Family, Office, Others) And Competitive Landscape
| Product Code: ETC034696 | Publication Date: Oct 2020 | Updated Date: Jun 2026 | Product Type: Report | |
| Publisher: 6Wresearch | Author: Sachin Kumar Rai | No. of Pages: 70 | No. of Figures: 35 | No. of Tables: 5 |
Ghana Tables Market Summary
The ghana tables market was estimated at USD 987 Million in 2025 and is projected to reach USD 1412 Million by 2032, growing at a CAGR of 6.5% from 2026 to 2032.
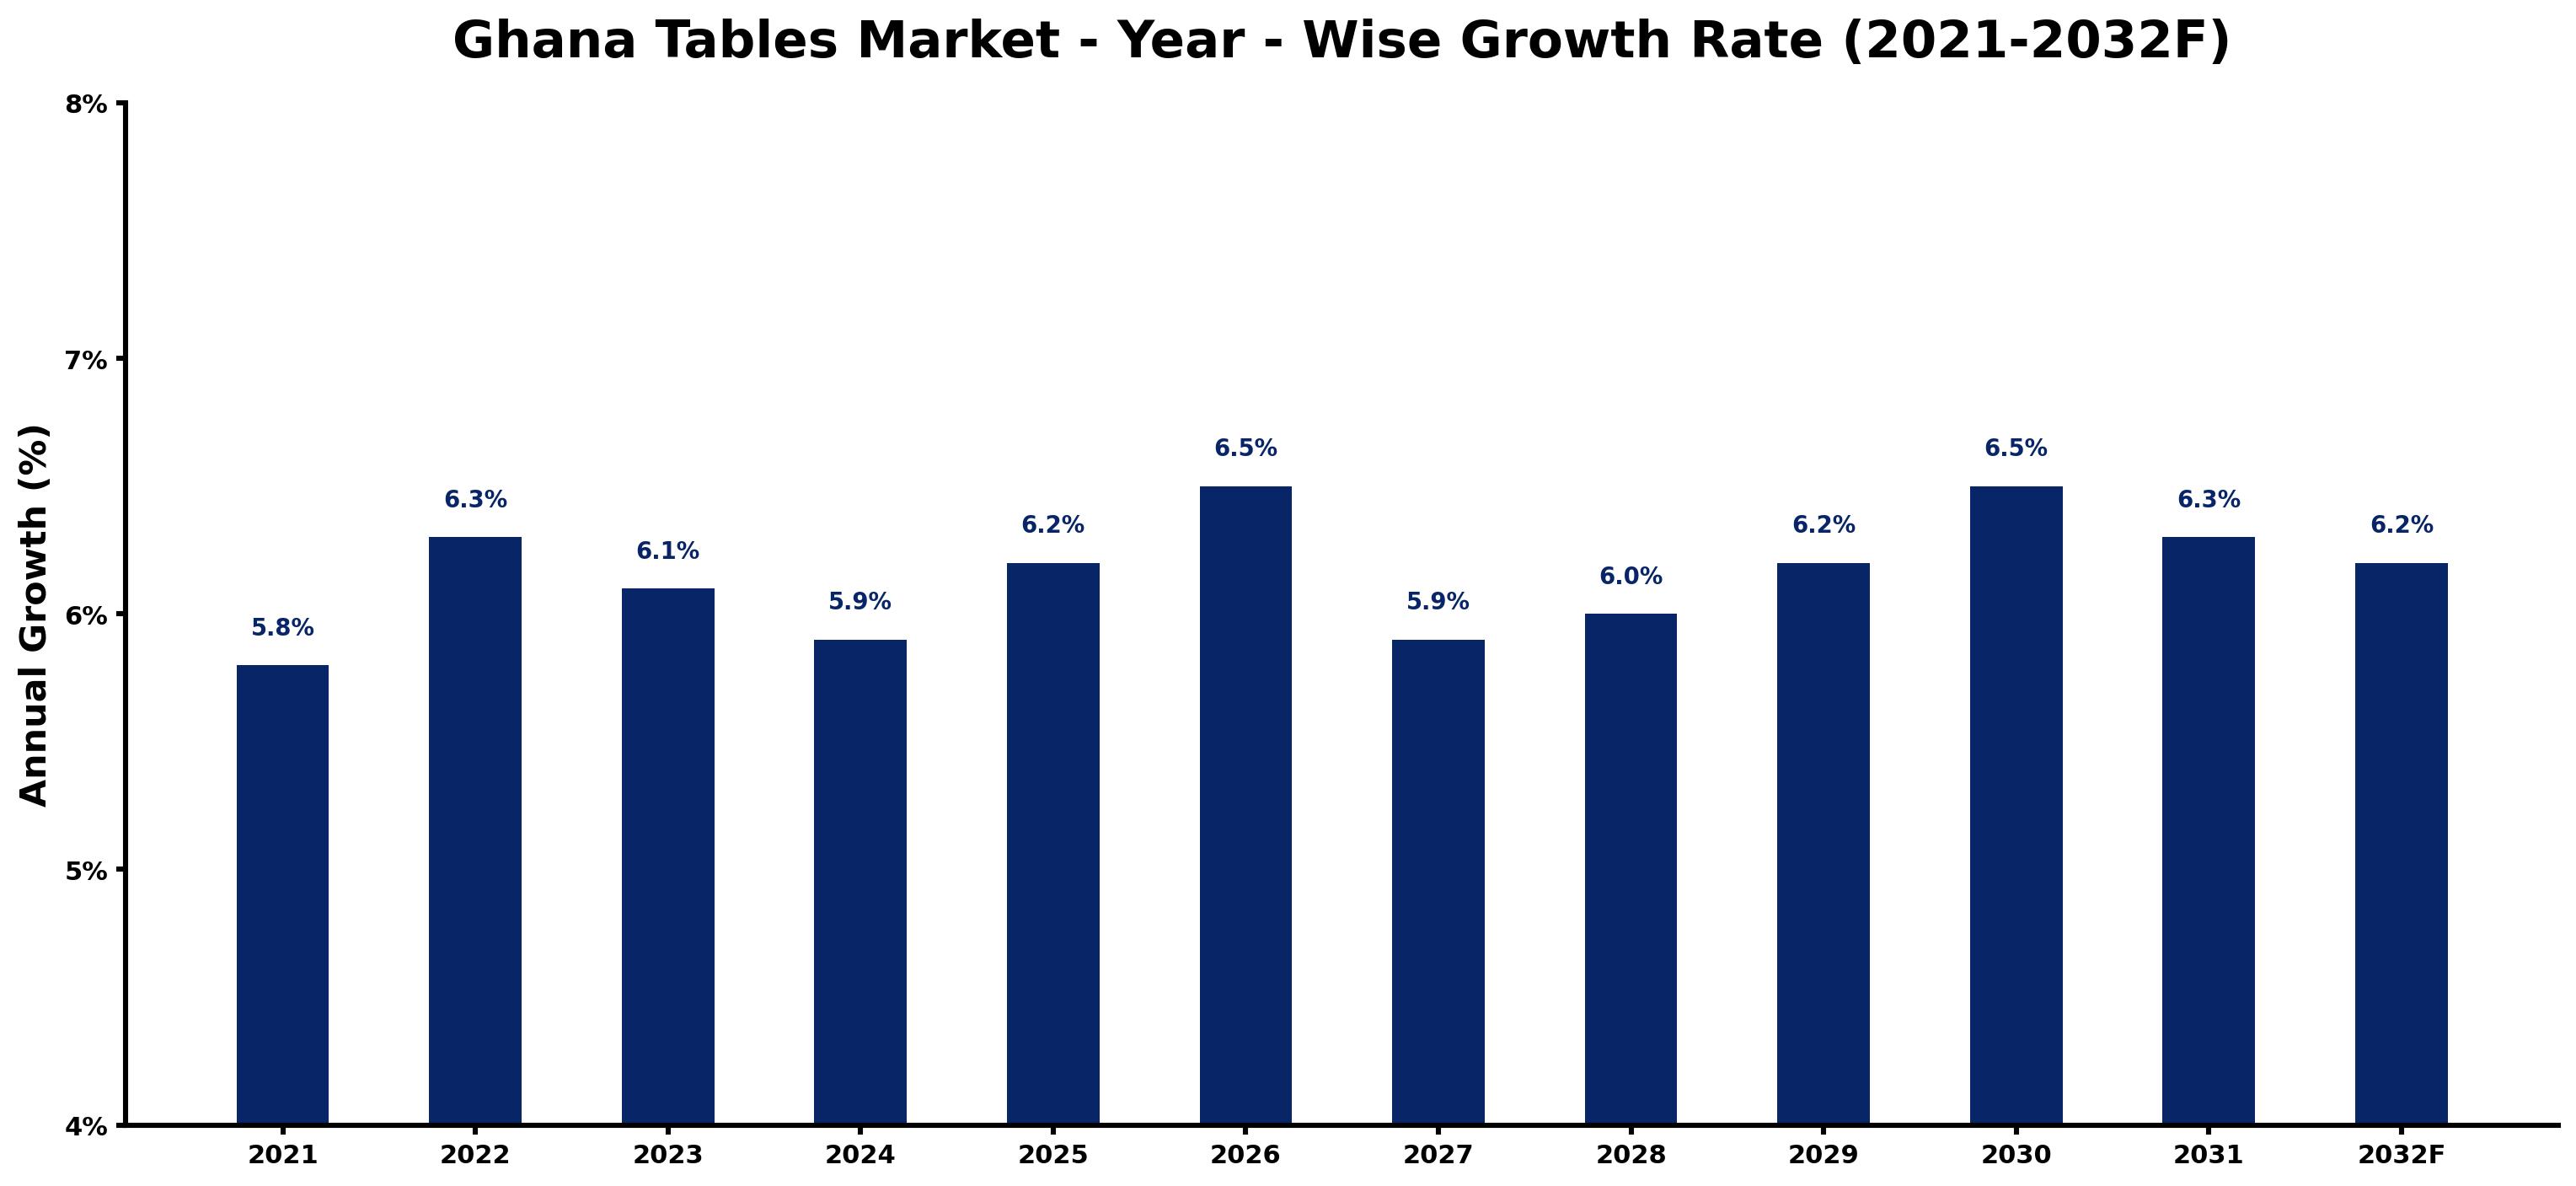
Ghana Tables Market Growth Rate Analysis (2021-2032)
The Ghana tables market has shown a stable growth pattern, with notable annual increases peaking at 6.5% in both 2026 and 2030. This growth reflects a rising consumer demand, driven by urbanization and an expanding middle class that prioritizes furniture quality and design. Furthermore, investments in local manufacturing have bolstered the market, helping to meet domestic needs more efficiently. Fluctuations such as a slight dip to 5.9% in 2024 can be attributed to temporary economic adjustments and global supply chain pressures. However, the steady recovery and growth rate of around 6.2% to 6.3% expected through 2032 indicate a resilient market adapting to both industrial advancements and evolving consumer preferences.
Ghana Tables Market Year-wise Growth Rate and Key Drivers
This graph highlights how the Ghana Tables Market has steadily grown over the past five years, supported by major growth factors.
The table below presents the year wise growth rates along with the key drivers influencing the market
| Year | Growth Rate | Major Drivers |
| 2021 | 5.8% | Local artisans began emphasizing unique craftsmanship, elevating table designs significantly. |
| 2022 | 6.3% | Urbanization trends led to increased demand for multifaceted home furnishings in major cities. |
| 2023 | 6.1% | Online retail platforms emerged, enhancing accessibility to diverse table styles and materials. |
| 2024 | 5.9% | Sustainable practices gained traction, with eco-friendly materials becoming increasingly popular. |
| 2025 | 6.2% | Cultural events and festivals promoted local artisans, boosting visibility and market potential. |
| 2026 | 6.5% | Foreign investments in the furniture sector spurred innovation and quality improvements across the board. |
| 2027 | 5.9% | A surge in disposable income encouraged consumers to invest in premium table options. |
| 2028 | 6.0% | Interior design trends shifted towards minimalism, creating demand for versatile table solutions. |
| 2029 | 6.2% | Collaborations between local designers and international brands enriched the product offerings available. |
| 2030 | 6.5% | Technological advancements in manufacturing streamlined processes, leading to cost-effective production methods. |
| 2031 | 6.3% | Consumer preferences leaned towards multifunctional furniture, prompting manufacturers to innovate designs. |
| 2032 | 6.2% | Enhanced logistics networks improved distribution channels, making table products more widely accessible. |
Note - Market size estimations and growth projections presented in this report are based on 6Wresearch's advanced forecasting approach, validated with industry datasets as of June 2026.
Ghana Tables Market Synopsis
The Ghana Tables Market is projected to reach 6.5% and witness significant growth during the forecast period (2026-2032). The market dynamics are influenced by a surge in demand across multiple sectors, notably residential, commercial, and hospitality. With a keen interest in stylish, functional designs crafted from premium materials like wood, metal, and glass, consumer preferences are evolving to encompass both traditional and contemporary aesthetics.
Ghana Tables Market Growth Drivers
Several factors are driving the growth of the Ghana Tables Market, reflecting changing consumer behavior and socio-economic trends. Increasing urbanization is a major contributor, as more individuals move to urban centers and seek furnishings that complement smaller living spaces. Rising disposable incomes enable consumers to invest in quality furniture, enhancing the market landscape.
- Consumer demand for multifunctional furniture is on the rise, with tables designed for dual purposes, such as extendable dining tables that accommodate various guest numbers.
- The trend toward modern and minimalist styles is reshaping product offerings, with consumers favoring clean lines and understated elegance in design.
- Growing awareness of sustainable practices is prompting interest in eco-friendly materials, leading to increased demand for tables made from recycled or renewable resources.
- Online shopping channels are becoming increasingly popular, providing consumers with access to a broader range of styles and price points, thereby stimulating market growth.
- The burgeoning hospitality and tourism sectors in Ghana create additional demand for stylish and functional tables in restaurants, hotels, and cafes, further driving market expansion.
Ghana Tables Market Trends and Opportunities
The Ghana Tables Market is witnessing notable trends that present various opportunities for stakeholders. As consumer behavior shifts, there is growing interest in versatile furnishings that can adapt to changing living conditions. The popularity of minimalist furniture reflects a broader cultural shift towards simplicity and functionality.
- Compact and space-efficient design is increasingly sought after, with consumers favoring tables that can easily fit into smaller rooms without sacrificing style.
- There is a rising demand for customizable furniture options, allowing consumers to select finishes, colors, and materials that reflect their personal style and preferences.
- A growing interest in bespoke and artisanal products presents opportunities for unique, culturally inspired table designs that resonate with local consumers.
- Increased collaborations between furniture designers and local artisans are enriching the market with innovative designs that cater to local tastes.
- The fusion of technology in furniture, such as integrated charging ports and adaptable smart tables, is gaining traction, appealing to tech-savvy consumers.
Ghana Tables Market Challenges and Restraints
While opportunities abound, the Ghana Tables Market faces several challenges that may impede growth. Fluctuating raw material prices pose a significant obstacle for manufacturers, affecting pricing and profitability. Furthermore, the competitive landscape is fierce, with both local and international suppliers vying for market share.
- The pressure to maintain affordable pricing can lead to compromises in quality, impacting consumer trust and brand reputation.
- Infrastructure issues, including unreliable electricity and inefficient transportation networks, hinder distribution and operational efficiency.
- Adapting to rapidly changing consumer preferences requires ongoing innovation, which can be resource-intensive for manufacturers.
- The market's growth is also susceptible to economic fluctuations, which may influence consumer spending on non-essential goods like furniture.
- Regulatory challenges, including compliance with quality standards and import tariffs, can complicate market entry and expansion for new entrants.
Ghana Tables Market Government Investment and Initiatives
The Ghanaian government has implemented several initiatives aimed at fostering growth within the tables market. These policies focus on supporting local manufacturers and promoting sustainable practices. Import tariffs on foreign furniture serve to protect domestic producers, encouraging local production.
- Incentives for local furniture manufacturers are designed to enhance competitiveness and stimulate investment in the industry.
- Quality standards regulations ensure that local products meet consumer expectations while promoting innovation in design and manufacturing processes.
- Public spending on infrastructure developments aims to improve logistics and supply chains, facilitating smoother distribution of furniture products.
- Collaboration with industry stakeholders is encouraged through government-led initiatives, promoting sustainable materials and environmentally friendly production methods.
- Programs that support skill development and training for artisans aim to elevate craftsmanship within the furniture sector, enhancing the quality of locally made tables.
Ghana Tables Market Latest Developments (May 2025 - June 2026)
Recent developments in the Ghana Tables Market highlight ongoing trends and shifts in consumer behavior. The emphasis on environmentally sustainable practices has grown, with manufacturers increasingly exploring the use of recycled materials in table production. Additionally, there has been a notable increase in the launch of online platforms dedicated to furniture sales, enhancing accessibility for consumers across the country.
- Collaborations between local artisans and design firms have led to a rise in unique, culturally relevant table designs, catering to a niche market that values authenticity.
- Market players are focusing on enhancing customization options, allowing customers to personalize their furniture to better suit their individual style and needs.
- The trend towards multifunctionality in furniture has encouraged innovations in table design, resulting in products that serve multiple purposes within compact spaces.
- Promotions and marketing campaigns highlighting the benefits of sustainable furniture are becoming more prevalent, reflecting changing consumer priorities.
- There has been a marked increase in participation in international furniture expos, giving Ghanaian manufacturers a platform to showcase their products and strengthen export capabilities.
Ghana Tables Market - Key Attractiveness of the Report
- 10 Years of Market Numbers
- Historical Data Starting from 2022 to 2025
- Base Year: 2025
- Forecast Data until 2032
- Key Performance Indicators Impacting the Market
- Major Upcoming Developments and Projects
Key Highlights of the Report:
- Ghana Tables Market Outlook
- Market Size of Ghana Tables Market, 2025
- Forecast of Ghana Tables Market, 2032F
- Historical Data and Forecast of Ghana Tables Revenues & Volume for the Period 2022-2032F
- Ghana Tables Market Trend Evolution
- Ghana Tables Market Drivers and Challenges
- Ghana Tables Price Trends
- Ghana Tables Porter's Five Forces
- Ghana Tables Industry Life Cycle
- Historical Data and Forecast of Ghana Tables Market Revenues & Volume By Types for the Period 2022-2032F
- Historical Data and Forecast of Ghana Tables Market Revenues & Volume By Fabric for the Period 2022-2032F
- Historical Data and Forecast of Ghana Tables Market Revenues & Volume By Leather for the Period 2022-2032F
- Historical Data and Forecast of Ghana Tables Market Revenues & Volume By Metal for the Period 2022-2032F
- Historical Data and Forecast of Ghana Tables Market Revenues & Volume By Wooden for the Period 2022-2032F
- Historical Data and Forecast of Ghana Tables Market Revenues & Volume By Others for the Period 2022-2032F
- Historical Data and Forecast of Ghana Tables Market Revenues & Volume By Applications for the Period 2022-2032F
- Historical Data and Forecast of Ghana Tables Market Revenues & Volume By Family for the Period 2022-2032F
- Historical Data and Forecast of Ghana Tables Market Revenues & Volume By Office for the Period 2022-2032F
- Historical Data and Forecast of Ghana Tables Market Revenues & Volume By Others for the Period 2022-2032F
- Ghana Tables Import Export Trade Statistics
- Market Opportunity Assessment By Types
- Market Opportunity Assessment By Applications
- Ghana Tables Top Companies Market Share
- Ghana Tables Competitive Benchmarking By Technical and Operational Parameters
- Ghana Tables Company Profiles
- Ghana Tables Key Strategic Recommendations
Frequently Asked Questions About the Market Study (FAQs):
The market's growth is driven by factors such as increasing urbanization, a rise in disposable incomes, demand for multifunctional furniture, and the shift towards sustainable materials.
Consumers are increasingly seeking stylish, functional designs that can adapt to various living spaces, with a growing preference for compact, multifunctional, and eco-friendly furniture options.
Challenges include fluctuating raw material prices, intense competition, economic fluctuations, and the need for continuous innovation to meet changing consumer preferences.
Government policies aim to protect local manufacturers through tariffs, incentivize sustainable practices, establish quality standards, and enhance skill development within the industry.
6Wresearch actively monitors the Ghana Tables Market and publishes its comprehensive annual report, highlighting emerging trends, growth drivers, revenue analysis, and forecast outlook. Our insights help businesses to make data-backed strategic decisions with ongoing market dynamics. Our analysts track relevent industries related to the Ghana Tables Market, allowing our clients with actionable intelligence and reliable forecasts tailored to emerging regional needs.
Yes, we provide customisation as per your requirements. To learn more, feel free to contact us on sales@6wresearch.com
1 Executive Summary |
2 Introduction |
2.1 Key Highlights of the Report |
2.2 Report Description |
2.3 Market Scope & Segmentation |
2.4 Research Methodology |
2.5 Assumptions |
3 Ghana Tables Market Overview |
3.1 Ghana Country Macro Economic Indicators |
3.2 Ghana Tables Market Revenues & Volume, 2022 & 2032F |
3.3 Ghana Tables Market - Industry Life Cycle |
3.4 Ghana Tables Market - Porter's Five Forces |
3.5 Ghana Tables Market Revenues & Volume Share, By Types, 2022 & 2032F |
3.6 Ghana Tables Market Revenues & Volume Share, By Applications, 2022 & 2032F |
4 Ghana Tables Market Dynamics |
4.1 Impact Analysis |
4.2 Market Drivers |
4.3 Market Restraints |
5 Ghana Tables Market Trends |
6 Ghana Tables Market, By Types |
6.1 Ghana Tables Market, By Types |
6.1.1 Overview and Analysis |
6.1.2 Ghana Tables Market Revenues & Volume, By Types, 2022-2032F |
6.1.3 Ghana Tables Market Revenues & Volume, By Fabric, 2022-2032F |
6.1.4 Ghana Tables Market Revenues & Volume, By Leather, 2022-2032F |
6.1.5 Ghana Tables Market Revenues & Volume, By Metal, 2022-2032F |
6.1.6 Ghana Tables Market Revenues & Volume, By Wooden, 2022-2032F |
6.1.7 Ghana Tables Market Revenues & Volume, By Others, 2022-2032F |
6.2 Ghana Tables Market, By Applications |
6.2.1 Overview and Analysis |
6.2.2 Ghana Tables Market Revenues & Volume, By Family, 2022-2032F |
6.2.3 Ghana Tables Market Revenues & Volume, By Office, 2022-2032F |
6.2.4 Ghana Tables Market Revenues & Volume, By Others, 2022-2032F |
7 Ghana Tables Market Import-Export Trade Statistics |
7.1 Ghana Tables Market Export to Major Countries |
7.2 Ghana Tables Market Imports from Major Countries |
8 Ghana Tables Market Key Performance Indicators |
9 Ghana Tables Market - Opportunity Assessment |
9.1 Ghana Tables Market Opportunity Assessment, By Types, 2022 & 2032F |
9.2 Ghana Tables Market Opportunity Assessment, By Applications, 2022 & 2032F |
10 Ghana Tables Market - Competitive Landscape |
10.1 Ghana Tables Market Revenue Share, By Companies, 2025 |
10.2 Ghana Tables Market Competitive Benchmarking, By Operating and Technical Parameters |
11 Company Profiles |
12 Recommendations |
13 Disclaimer |
Global Go To Market Strategy - 2030
Export potential enables firms to identify high-growth global markets with greater confidence by combining advanced trade intelligence with a structured quantitative methodology. The framework analyzes emerging demand trends and country-level import patterns while integrating macroeconomic and trade datasets such as GDP and population forecasts, bilateral import–export flows, tariff structures, elasticity differentials between developed and developing economies, geographic distance, and import demand projections. Using weighted trade values from 2020–2024 as the base period to project country-to-country export potential for 2030, these inputs are operationalized through calculated drivers such as gravity model parameters, tariff impact factors, and projected GDP per-capita growth. Through an analysis of hidden potentials, demand hotspots, and market conditions that are most favorable to success, this method enables firms to focus on target countries, maximize returns, and global expansion with data, backed by accuracy.
By factoring in the projected importer demand gap that is currently unmet and could be potential opportunity, it identifies the potential for the Exporter (Country) among 190 countries, against the general trade analysis, which identifies the biggest importer or exporter.
To discover high-growth global markets and optimize your business strategy:
Click Here
Pricing
- Single User License$ 1,995
- Department License$ 2,400
- Site License$ 3,120
- Global License$ 3,795

Leadership Perspectives from Industry Events
Search
Thought Leadership and Analyst Meet


Our Clients
6WResearch In News
- India Air Conditioner Market Set for Strong Rebound in 2026 After Weather-Led Correction and GST-Driven Recovery: 6Wresearch
- ADAS in India: How Automatic Emergency Braking, Blind Spot Detection & Driver Monitoring are Transforming Road Safety
- Doha a strategic location for EV manufacturing hub: IPA Qatar
- Demand for luxury TVs surging in the GCC, says Samsung
- Empowering Growth: The Thriving Journey of Bangladesh’s Cable Industry
- Demand for luxury TVs surging in the GCC, says Samsung
Latest Reports
- Poland Fire Protection Systems Market (2026-2032)
- Cape Verde Portable Hand-Thrown Extinguisher Market (2026-2032)
- Canada Portable Hand-Thrown Extinguisher Market (2026-2032)
- Cameroon Portable Hand-Thrown Extinguisher Market (2026-2032)
- Burundi Portable Hand-Thrown Extinguisher Market (2026-2032)
- Burkina Faso Portable Hand-Thrown Extinguisher Market (2026-2032)
- Bulgaria Portable Hand-Thrown Extinguisher Market (2026-2032)
- Brunei Portable Hand-Thrown Extinguisher Market (2026-2032)
- Botswana Portable Hand-Thrown Extinguisher Market (2026-2032)
- Bosnia and Herzegovina Portable Hand-Thrown Extinguisher Market (2026-2032)
Industry Events and Analyst Meet

HIMTEX 2026

India Refining Summit 2026

India EV Show 2026

EV tech India Expo 2026

Auto Tech Asia 2026
Whitepaper
- Middle East & Africa Commercial Security Market Click here to view more.
- Middle East & Africa Fire Safety Systems & Equipment Market Click here to view more.
- GCC Drone Market Click here to view more.
- Middle East Lighting Fixture Market Click here to view more.
- GCC Physical & Perimeter Security Market Click here to view more.