Global 3D Holographic Display and Services Market Highlights
| Market Size (2025) | USD 2.9 Billion |
| Forecast Size (2032) | USD 6.5 Billion |
| CAGR | 11.80% |
| Base Year | 2025 |
| Forecast Period | 2026-2032 |
| Largest Region | North America |
| Fastest Growing Region | Asia |
| Largest Segment | Media and Entertainment |
| Fastest Growing Segment | Healthcare |
| Leading Companies | Microsoft, Panasonic, Samsung, nGage, RealView Imaging |
Global 3D Holographic Display and Services Market Size & Growth Rate (2026-2032)
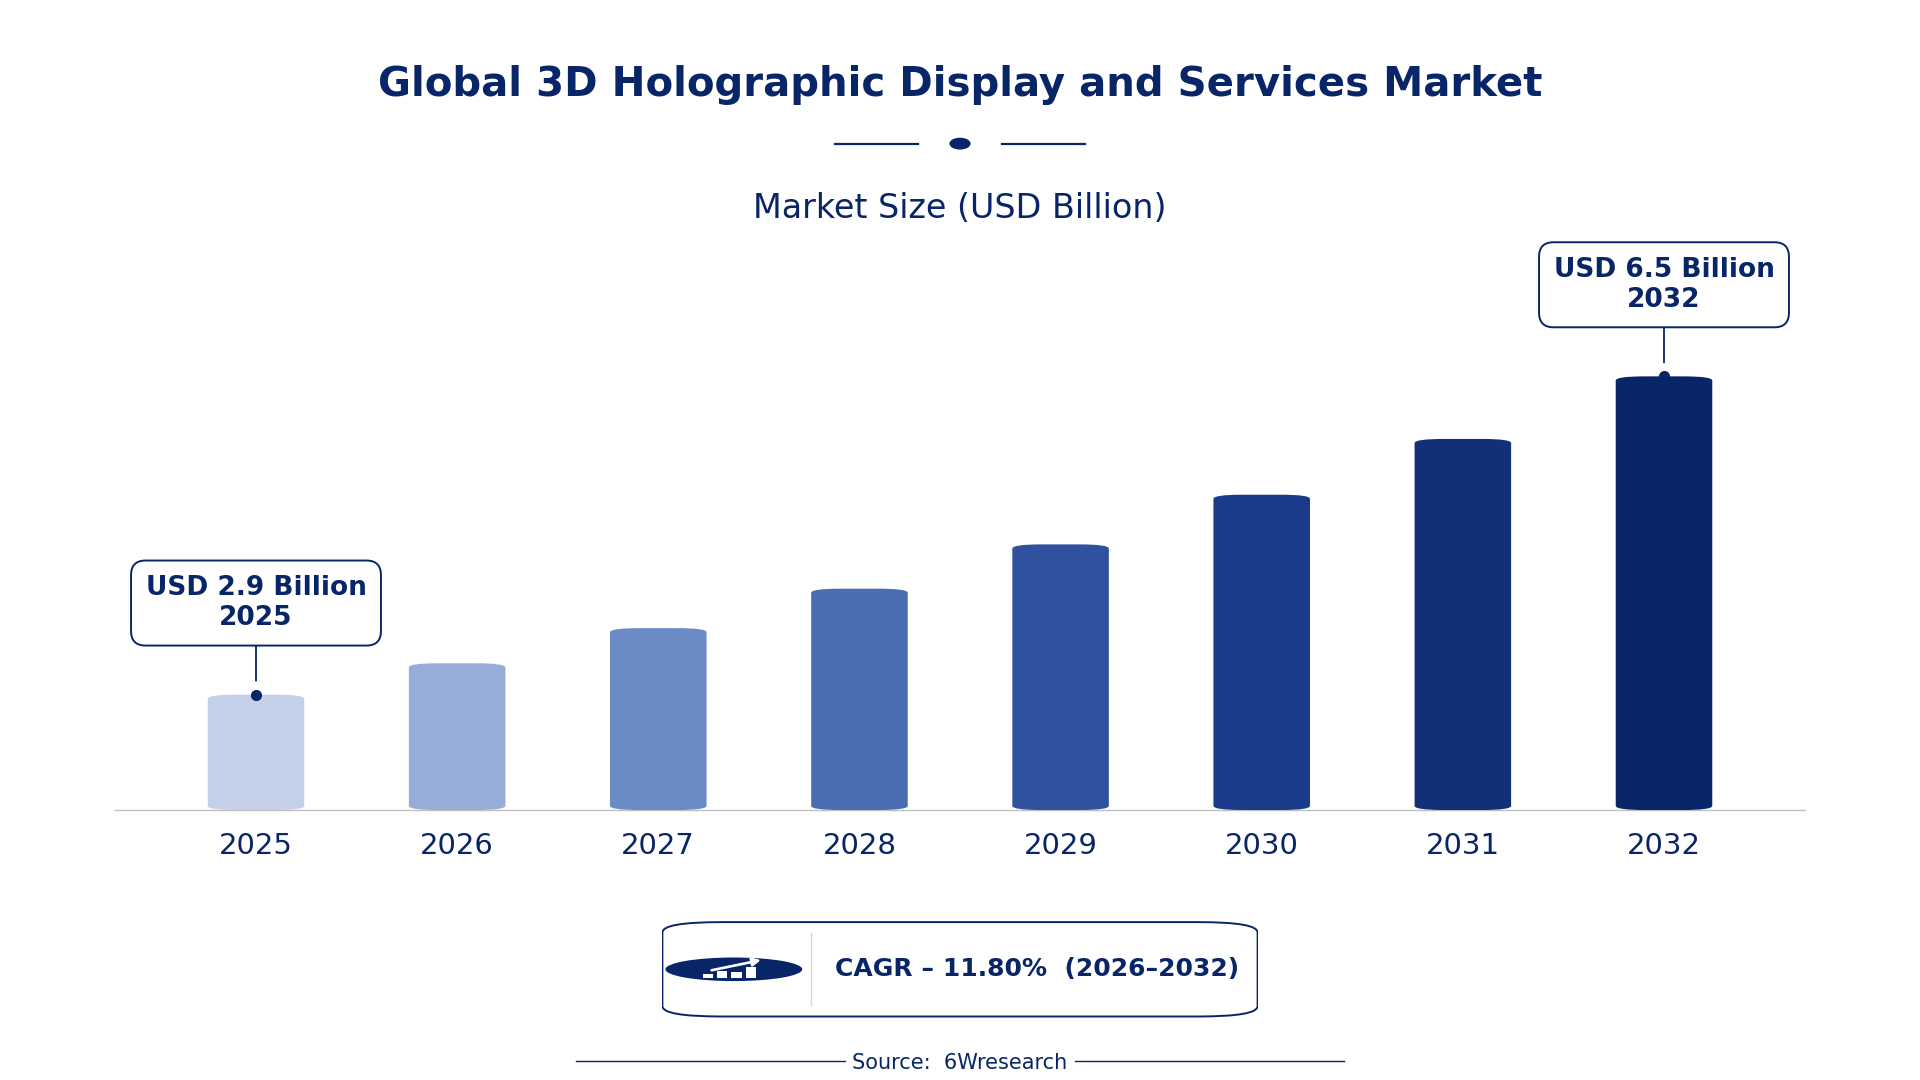
The Global 3D Holographic Display and Services Market was estimated at USD 2.9 Billion in 2025 and is projected to reach USD 6.5 Billion by 2032, growing at a CAGR of 11.80% from 2026 to 2032.
Global 3D Holographic Display and Services Market Synopsis
In recent years, the market has witnessed a paradigm shift towards immersive experiences in various sectors, particularly in Media and Entertainment. This transition is largely driven by advancements in display technology and a growing consumer demand for interactive visual content across sectors such as education and advertising.
Holographic displays are now finding applications beyond their traditional realms, with industries ranging from healthcare to automotive increasingly incorporating these solutions. This diversification of applications signifies a transformation in how visual information is presented and consumed, setting the stage for a robust market trajectory.
Global 3D Holographic Display and Services Market Year-wise Growth Rate and Key Drivers
This graph illustrates the annual growth rates of the Global 3D Holographic Display and Services Market from 2022 to 2032, highlighting a steady upward trajectory and projected expansion over the forecast period.
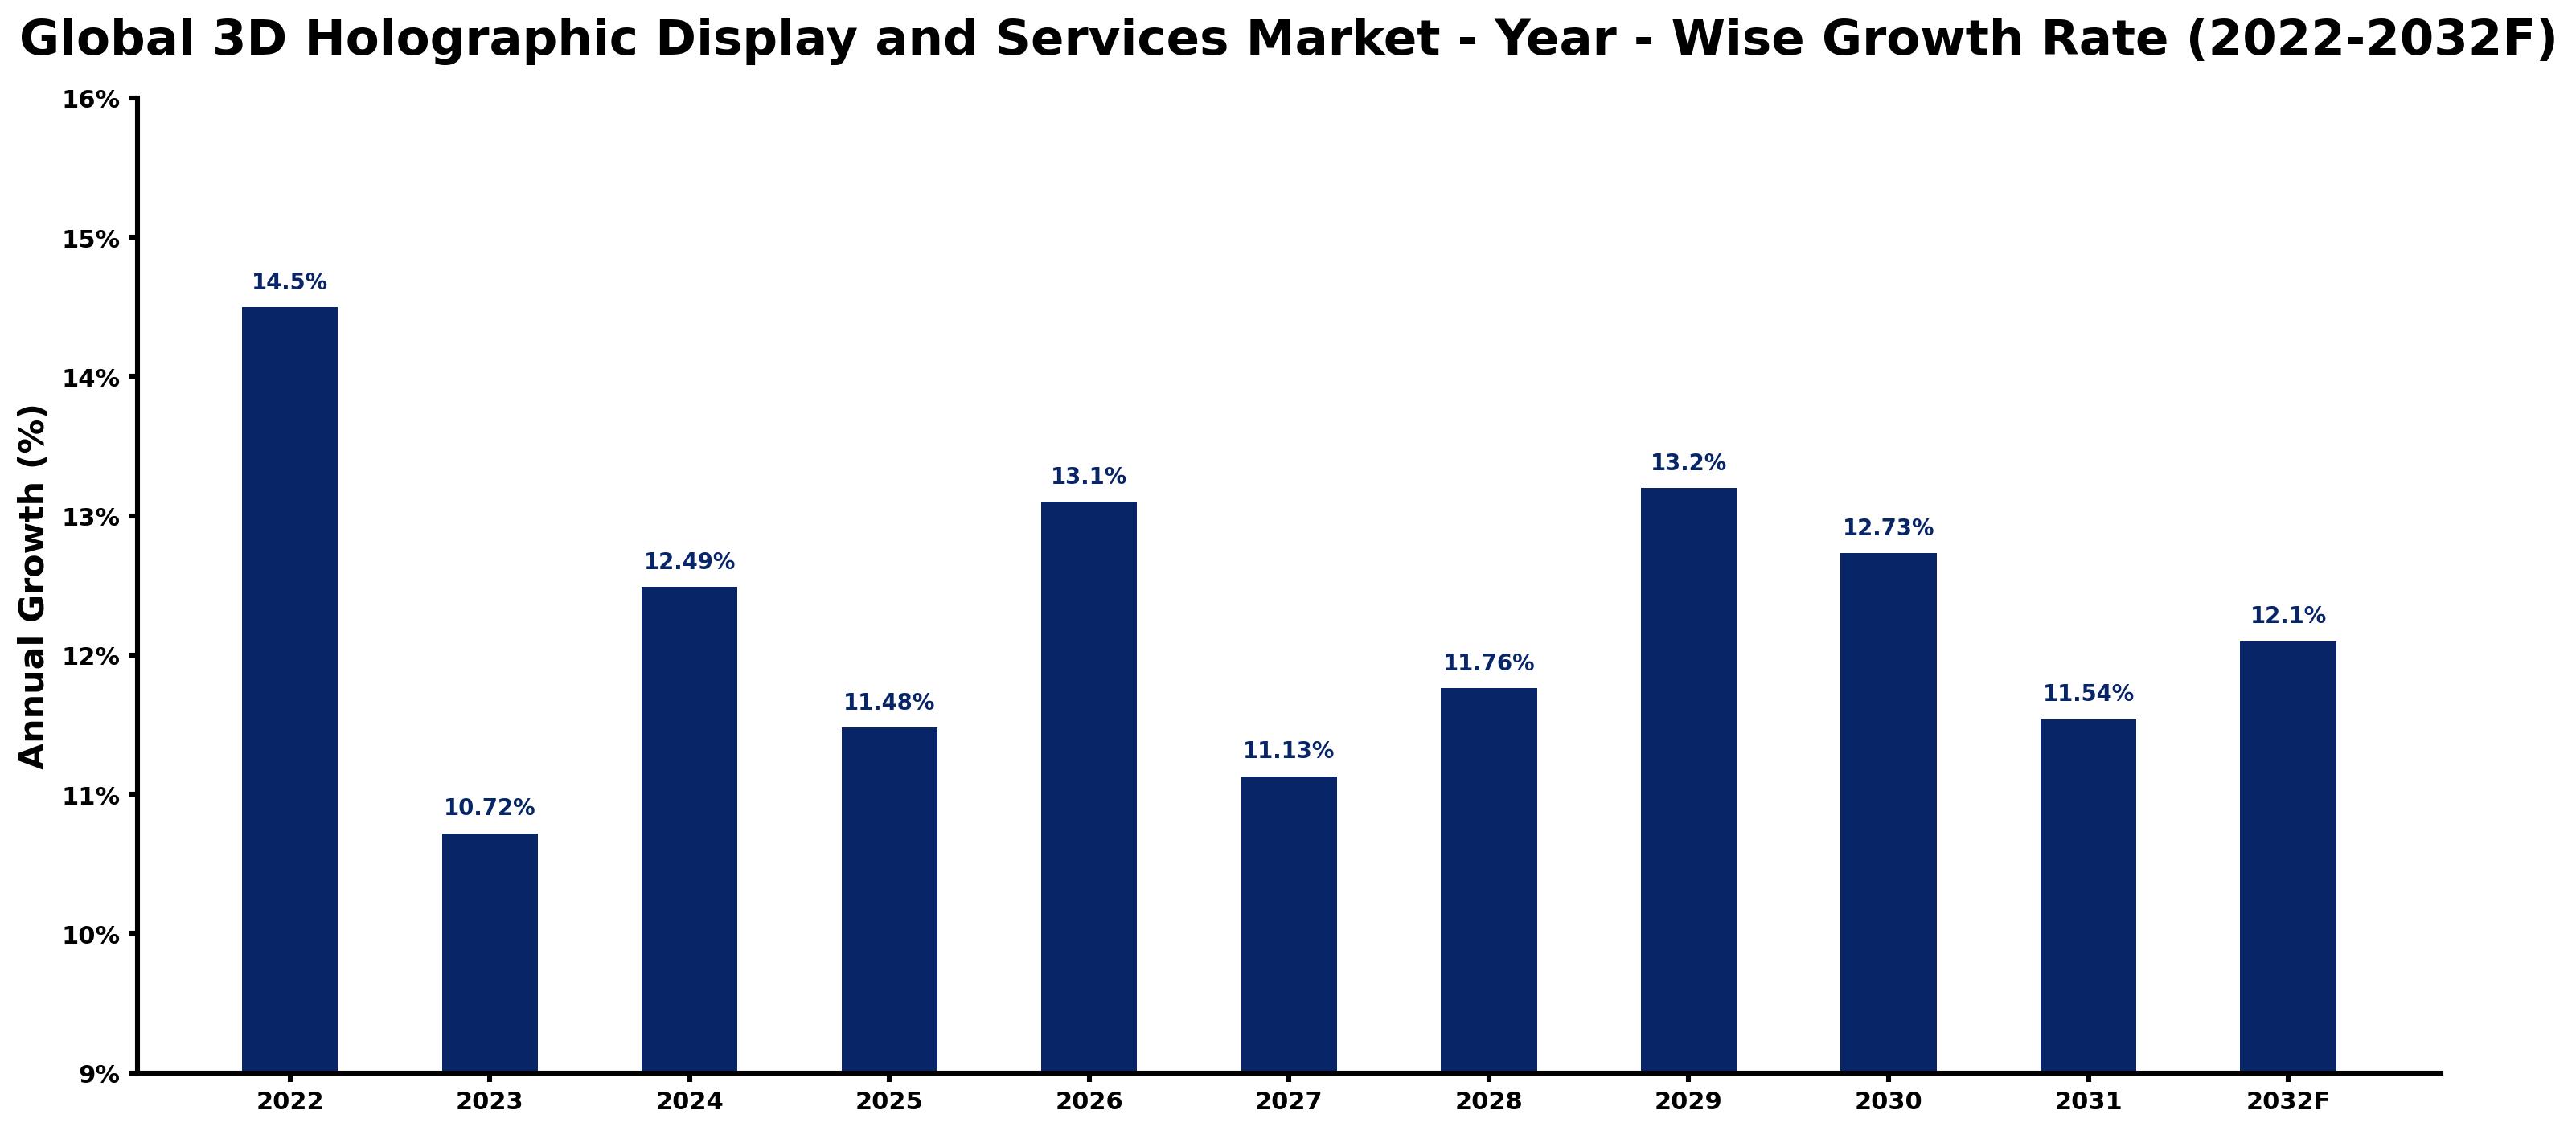
The table below presents the year‑wise growth rates along with the key drivers influencing the market
| Year | Growth Rate (%) | Major Drivers |
| 2022 | 14.5 | Consumers increasingly seek immersive Holographic Display experiences in entertainment content. |
| 2023 | 10.72 | A shortage of skilled technicians limits the growth of Holographic services. |
| 2024 | 12.49 | A surge in audience interest drives demand for innovative holographic displays. |
| 2025 | 11.48 | Reducing costs of advanced display materials enhances the feasibility of holographic services. |
| 2026 | 13.1 | As sustainability concerns rise, eco-friendly holographic production becomes a focal point. |
| 2027 | 11.13 | Companies expanding into emerging markets capitalize on new holographic display opportunities. |
| 2028 | 11.76 | Innovating display technologies enhances realism, compelling greater audience engagement. |
| 2029 | 13.2 | Strategic acquisitions drive consolidation among major players in the holographic display sector. |
| 2030 | 12.73 | Holographic displays gain traction as regulations support digital media innovation. |
| 2031 | 11.54 | Content platforms prioritize exclusive holographic experiences, reshaping viewer engagement models. |
| 2032 | 12.1 | In North America, supply chain efficiencies improve access to advanced holographic displays. |
Note - Market size estimations and growth projections presented in this report are based on 6Wresearch's proprietary research methodology, combining internal industry data, secondary research, and primary validation, updated periodically to reflect current market conditions. As markets evolve rapidly, figures for certain industries may vary slightly and are intended as informed estimates rather than absolute figures. For the most current market sizing, we recommend validating figures with a 6Wresearch analyst.
Global 3D Holographic Display and Services Market Key Takeaways
Below are some of the specific key takeaways from the market, including:
- The Media and Entertainment segment holds the largest market share, making up approximately ~42% share in 2025.
- Healthcare is projected to dominate with a CAGR of 15.2% from 2026 to 2032, indicating rising demand for holographic solutions in medical imaging.
- Panasonic has launched advanced holographic projectors, enhancing the quality of visual experiences for retail settings.
- As of 2022, the 3D Holographic Display market grew by 7.5%, fueled by the expanding application of virtual reality in various sectors.
- Microsoft has invested $1 billion in R&D focused on developing holographic solutions for corporate environments, enhancing collaboration.
Evaluation of Restraints in Global 3D Holographic Display and Services Market
One of the significant restraints in the Global 3D Holographic Display and Services Market is the high cost of advanced holographic display technology, which can exceed $300,000 per unit for professional-grade solutions. This cost factor limits widespread adoption, especially among small to medium-sized enterprises. For example, the installation of comprehensive holographic systems in healthcare settings has been reported to require investments of over $500,000, presenting a barrier to entry for many providers. Regulatory hurdles, such as compliance with medical imaging standards, can further complicate adoption for new entrants in this market.
Global 3D Holographic Display and Services Market Trends
A prominent trend is the integration of Augmented Reality (AR) with holographic displays, especially in the retail sector. Companies like nGage are leading the charge, utilizing AR to enhance customer engagement by providing immersive shopping experiences. Research indicates a 30% increase in customer interaction rates when using AR-enabled displays. In the automotive industry, manufacturers are experimenting with holographic interfaces for dashboard displays; for instance, Toyota has developed holographic navigation systems that boost driver focus and safety.
Moreover, the increasing investment in virtual training tools, especially within corporate settings, highlights another critical trend. Major firms are reporting up to 25% reductions in training time by employing holographic visual aids, further illustrating the practicality of this technology in enhancing operational efficiency.
Global 3D Holographic Display and Services Market Opportunities
Future revenue opportunities in the Global 3D Holographic Display and Services Market are substantial, particularly in segments like healthcare and advertising. The healthcare sector, for instance, is increasingly adopting holographic imaging for surgical training and patient education; the projection for investment in such technologies is estimated to reach $2 billion by 2027. Furthermore, companies like RealView Imaging are developing next-generation holographic solutions that enable real-time visualization of complex data, catering to the needs of medical professionals.
In advertising, the potential for interactive holographic displays is immense, with a projected growth of $3 billion in revenue by 2028, driven by campaigns that enhance customer engagement through unique visual experiences. These opportunities underline a significant shift in how industries can use holographic displays to convey information effectively.
Global 3D Holographic Display and Services Market by End-users
The Media and Entertainment sector leads the Global 3D Holographic Display and Services Market, accounting for approximately ~42% share in 2025. This dominance stems from the increasing use of holographic displays in concert performances, exhibitions, and advertising campaigns that require high-quality visuals. In contrast, the Healthcare segment is expected to grow at the fastest rate, with a CAGR of 15.2% from 2026 to 2032, driven by the demand for enhanced training tools and diagnostic imaging solutions that improve patient outcomes.
Global 3D Holographic Display and Services Market by Region
North America is anticipated to be the largest region in the Global 3D Holographic Display and Services Market, with an estimated share of ~45% in 2025. This leadership is anchored by a robust infrastructure for technological innovation and a concentration of key players in the region. Asia, however, is emerging as the fastest-growing region, projected to achieve a CAGR of 16.5% from 2026 to 2032, fueled by an increase in investments in entertainment and healthcare technologies, alongside supportive government initiatives aimed at advancing digitalization.
Government Initiatives in the Global 3D Holographic Display and Services Market
Government initiatives play a crucial role in shaping the Global 3D Holographic Display and Services Market. Various policies are being developed to enhance technological integration and support innovative applications. These regulations help stabilize the market and encourage investment in future technological advancements.
- U.S. Department of Commerce, "Holographic Technology Advancement Program," 2021: This program promotes R&D in holographic technologies, supporting startups and established firms to foster innovation.
- European Union, "Digital Europe Programme," 2021: This initiative allocates €7 billion towards the adoption of cutting-edge technologies, including holographic displays, to enhance public services and business efficiency.
- Ministry of Electronics and Information Technology, India, "Make in India Initiative," 2022: This ongoing initiative aims to boost local manufacturing of advanced display technologies, including holograms, aiming for greater market reach.
- UK Government, "Augmented Reality Support Strategy," slated for 2023: This planned initiative aims to provide funding for research and development of holographic and AR technologies in various sectors.
Future Insights of the Global 3D Holographic Display and Services Market
The structural evolution of the Global 3D Holographic Display and Services Market is increasingly influenced by the convergence of holography and artificial intelligence. Recently, companies such as Microsoft are focusing on incorporating AI-driven holographic solutions in corporate environments, enhancing collaborative efforts and operational efficiency. By 2032, we anticipate a substantial rise in customized holographic applications, particularly in telemedicine and remote training solutions, driven by the adoption of 5G technology and the increasing demand for high-quality remote interactions.
Global 3D Holographic Display and Services Market Latest Developments
The following key developments underline the advancements and competitive positioning within the Global 3D Holographic Display and Services Market:
- In April 2023, Panasonic announced its latest holographic imaging technology aimed at enhancing retail experiences, improving customer engagement through interactive displays.
- Recently in February 2023, Samsung launched a new line of holographic displays tailored for the automotive sector, enhancing driver interfaces and safety features.
- In March 2023, nGage completed the acquisition of a holographic startup focused on integrating Augmented Reality, aiming to expand its service offerings in interactive experiences.
- RealView Imaging is projected to debut an innovative holographic imaging system in Q4 2023, facilitating real-time surgical planning and visualization for medical professionals.
Global 3D Holographic Display and Services Market Key Players and Industry Positioning
The competitive landscape of the Global 3D Holographic Display and Services Market is characterized by substantial innovation and collaboration, marking it as moderately fragmented. Key players leverage technological advancements to create distinct product offerings, with a focus on emerging applications in healthcare, entertainment, and corporate training.
| Leading Company | Core Strength | Strategic Focus |
|---|---|---|
| Microsoft | Strong R&D capabilities in holographic and AI integration. | Developing collaborative corporate solutions. |
| Panasonic | Expertise in high-quality imaging technologies. | Expanding applications in retail and media. |
| Samsung | Leader in consumer electronics with extensive distribution. | Focusing on automotive and dynamic consumer displays. |
| nGage | Innovative in AR/holographic technology for user engagement. | Enhancing interactive retail experiences. |
| RealView Imaging | Pioneer in medical imaging solutions using holography. | Focusing on surgical visualization technologies. |
As emerging applications gain traction, these companies are expected to enhance their efforts toward research and partnerships that drive further advancements in holographic technology.
Key Attractiveness of the Report
- 10 Years of Market Numbers
- Historical Data Starting from 2022 to 2025
- Base Year: 2025
- Forecast Data until 2032
- Key Performance Indicators Impacting the Market
- Major Upcoming Developments and Projects
Key Highlights of the Report:
- 3D Holographic Display and Services Market Overview
- 3D Holographic Display and Services Market Outlook
- 3D Holographic Display and Services Market Forecast
- 3D holographic display and Services Market Forecast
- Historical Data of 3D holographic display and services Market Revenues & Volume for the Period 2022-2032
- 3D holographic display and services Market Size and 3D holographic display and services Market Forecast of Revenues & Volume, Until 2032
- Historical Data of 3D holographic display and services Market Revenues & Volume, by End-users, for the Period 2022-2032
- Market Size & Forecast of 3D holographic display and services Market Revenues & Volume, by End-users, Until 2032
- Historical Data of 3D holographic display and services Market Revenues, by Regions, for the Period 2022-2032
- Market Size & Forecast of 3D holographic display and services Market Revenues, by Regions, Until 2032
- Historical Data of Asia Pacific3D holographic display and services Market Revenues, for the Period 2022-2032
- Market Size & Forecast of Asia Pacific 3D holographic display and services Market Revenues, Until 2032
- Historical Data of Latin America3D holographic display and services Market Revenues, for the Period 2022-2032
- Market Size & Forecast of Latin America 3D holographic display and services Market Revenues, Until 2032
- Historical Data of Europe 3Dholographic display and services Market Revenues, for the Period 2022-2032
- Market Size & Forecast of Europe 3D holographic display and services Market Revenues, Until 2032
- Historical Data of Middle East 3Dholographic display and services Market Revenues, for the Period 2022-2032
- Market Size & Forecast of Middle East 3D holographic display and services Market Revenues, Until 2032
- Historical Data of North America3D holographic display and services Market Revenues, for the Period 2022-2032
- Market Size & Forecast of North America 3D holographic display and services Market Revenues, Until 2032
- Historical Data of Africa 3Dholographic display and services Market Revenues, for the Period 2022-2032
- Market Size & Forecast of Africa 3D holographic display and services Market Revenues, Until 2032
- Market Drivers and Restraints
- 3D holographic display and services Market Trends and Industry Life Cycle
- Porter’s Five Force Analysis
- Market Opportunity Assessment
- 3D Holographic Display and Services Market Share, By Players
- 3D holographic display and Services Market Share, By Regions
- 3D holographic display and services Market Overview on Competitive Benchmarking
- Company Profiles
- Key Strategic Recommendations
Markets Covered
The Global 3D Holographic Display and Services Market report provides a detailed analysis of the following market segments:
By Regions and Countries:
- North America
- Europe
- LATAM
- Middle East
- Asia
- Africa
By End-users:
- Media
- Entertainment
- Consumer Electronics
- Healthcare
- Automotive
- Retail
- Others






































