Greece Broom Market (2026-2032) | Forecast, Size, Outlook, Segmentation, Companies, Trends, Industry, Growth, Value, Share, Analysis & Revenue
Market Forecast By Product (Angle Broom, Corn-fill Broom, Push Broom, Others), By Applications (Indoor Floor, Outdoor Ground, Table, Others) And Competitive Landscape
| Product Code: ETC5684572 | Publication Date: Nov 2023 | Updated Date: Apr 2026 | Product Type: Market Research Report | |
| Publisher: 6Wresearch | Author: Ravi Bhandari | No. of Pages: 60 | No. of Figures: 30 | No. of Tables: 5 |
Greece Broom Market Size (2020-2030)
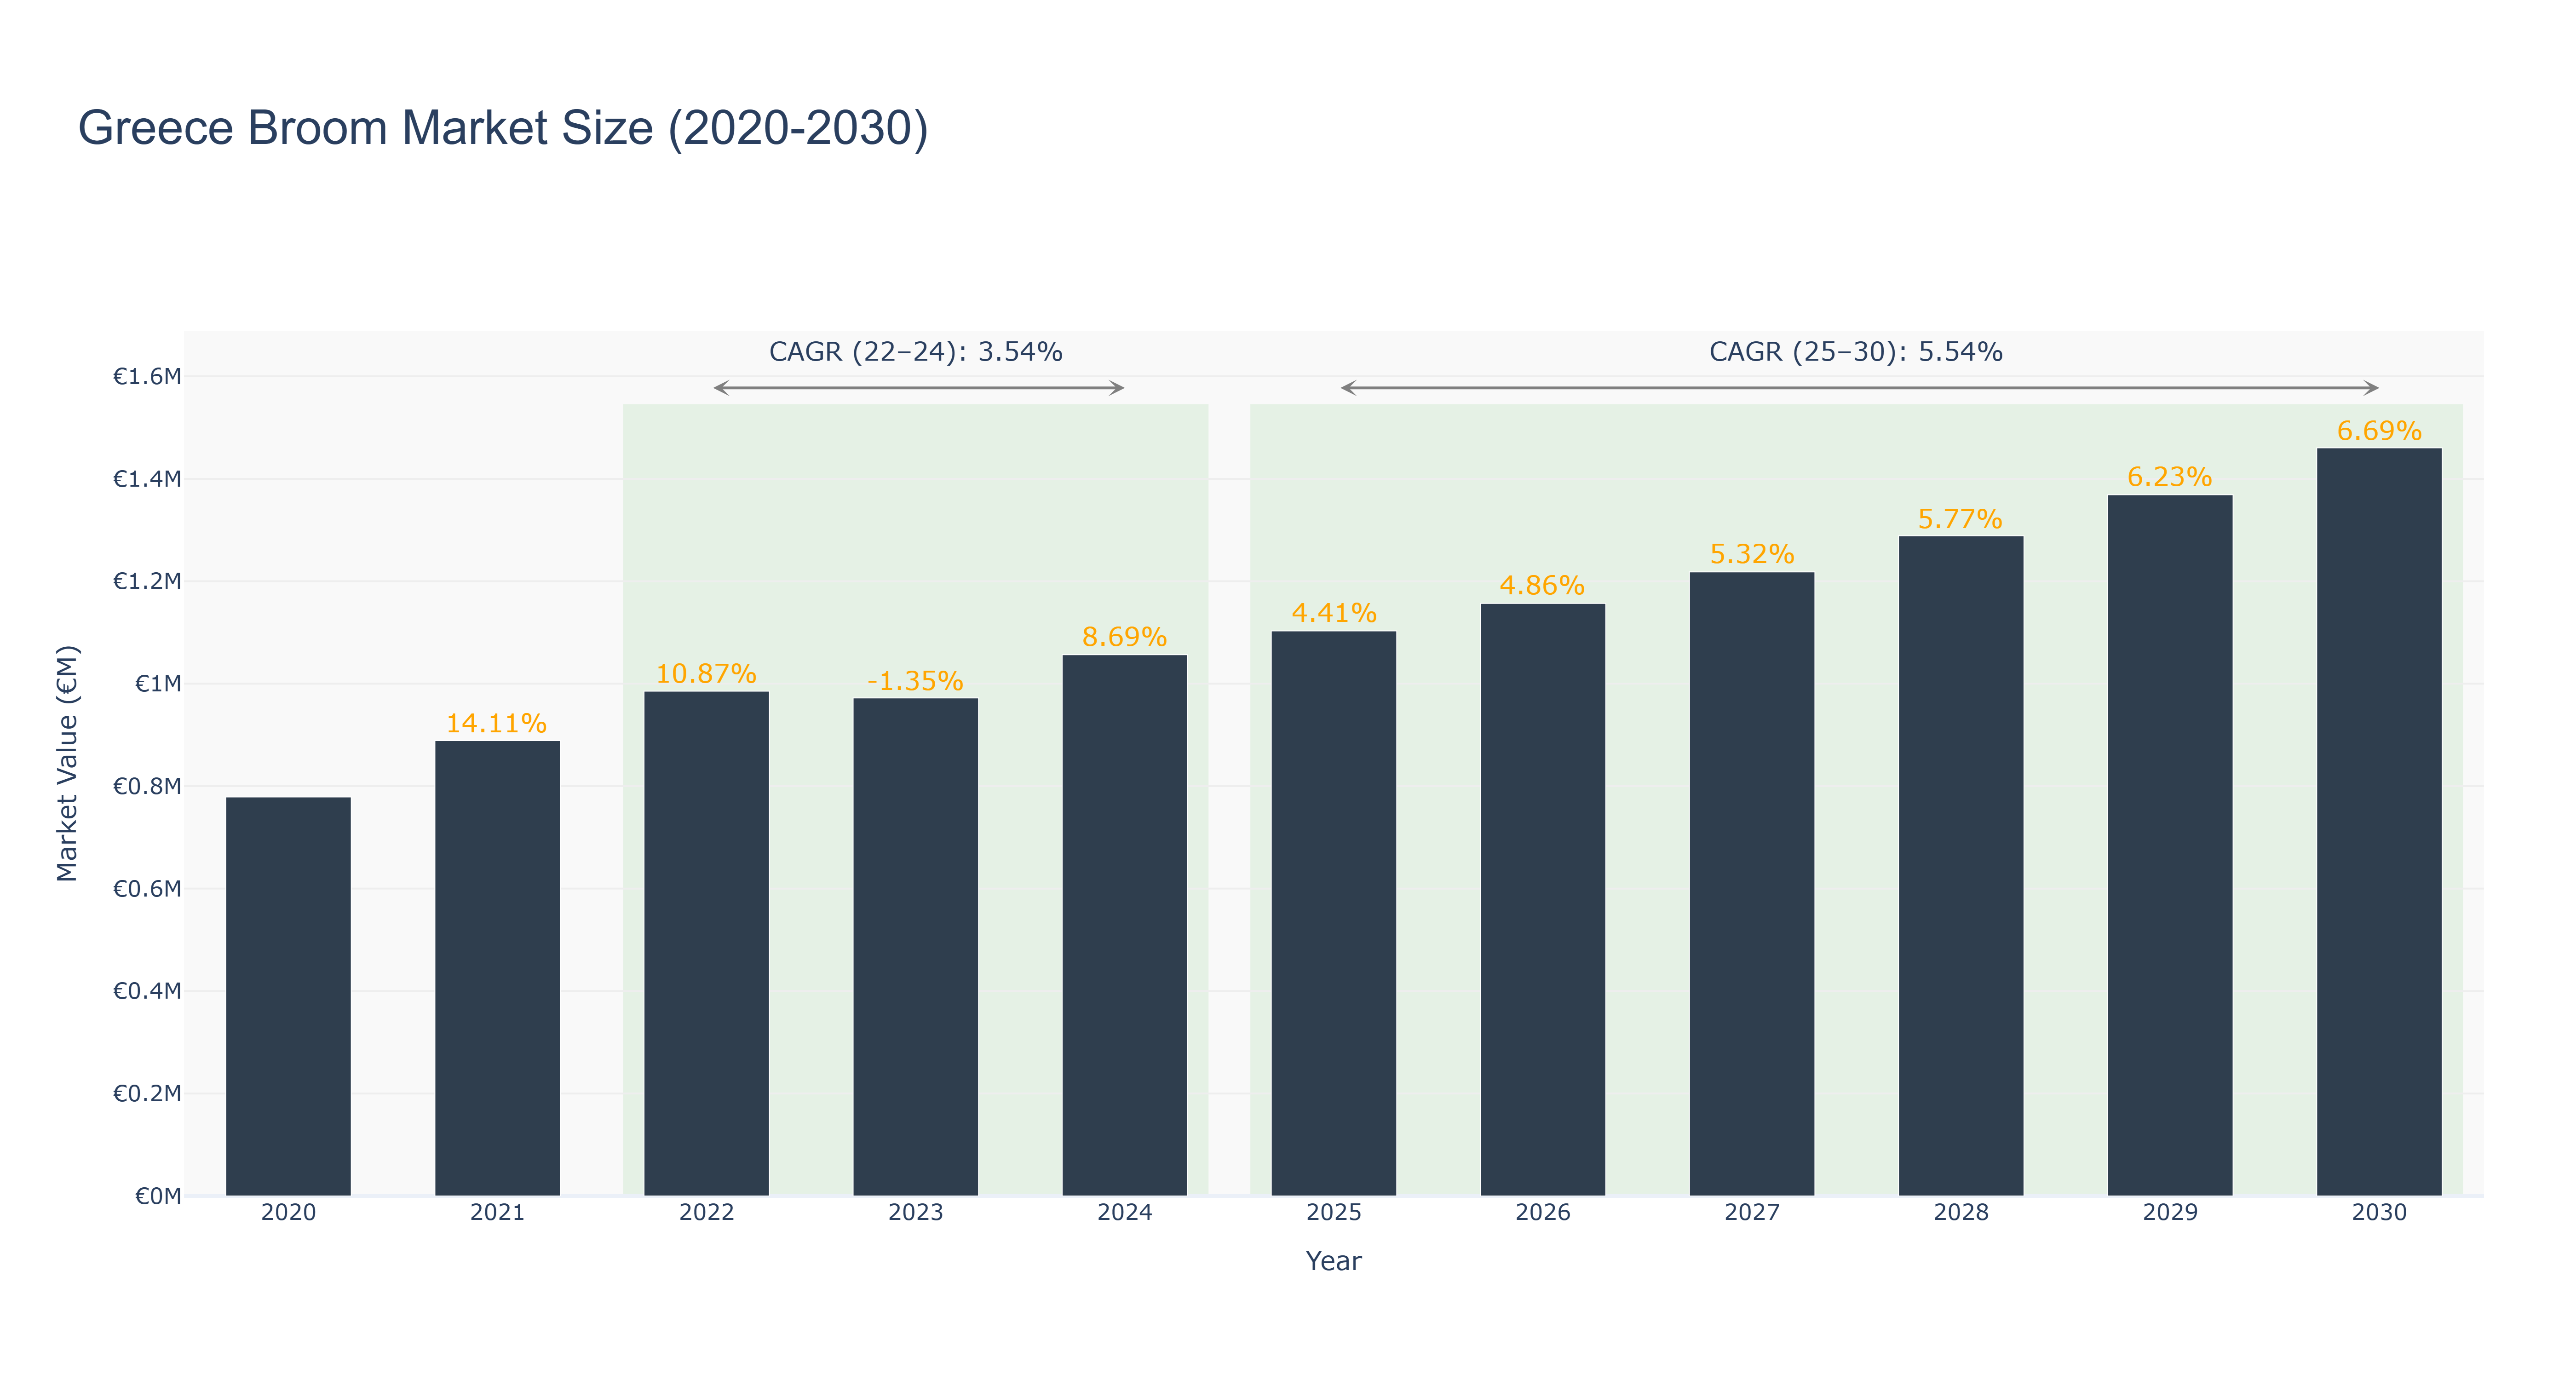
The Greece Broom Market has shown a steady growth trajectory over the years. The peak market size of €1.46 million is forecasted for 2030, with a notable increase in market size from €0.78 million in 2020 to €1.06 million in 2024. The market is expected to continue its growth trend, reaching €1.22 million by 2027 and ultimately €1.46 million by 2030. The CAGR for the period 2022-24 is 3.54%, while for 2025-30 it is projected to be 5.54%. The market's growth can be attributed to increasing consumer awareness of sustainability and eco-friendly products, driving demand for broom products in Greece. Looking ahead, upcoming projects focusing on innovative broom designs and eco-friendly materials are set to propel further growth in the Greece Broom Market.
Greece Broom Market: Production & Trade Performance (2019-2025)
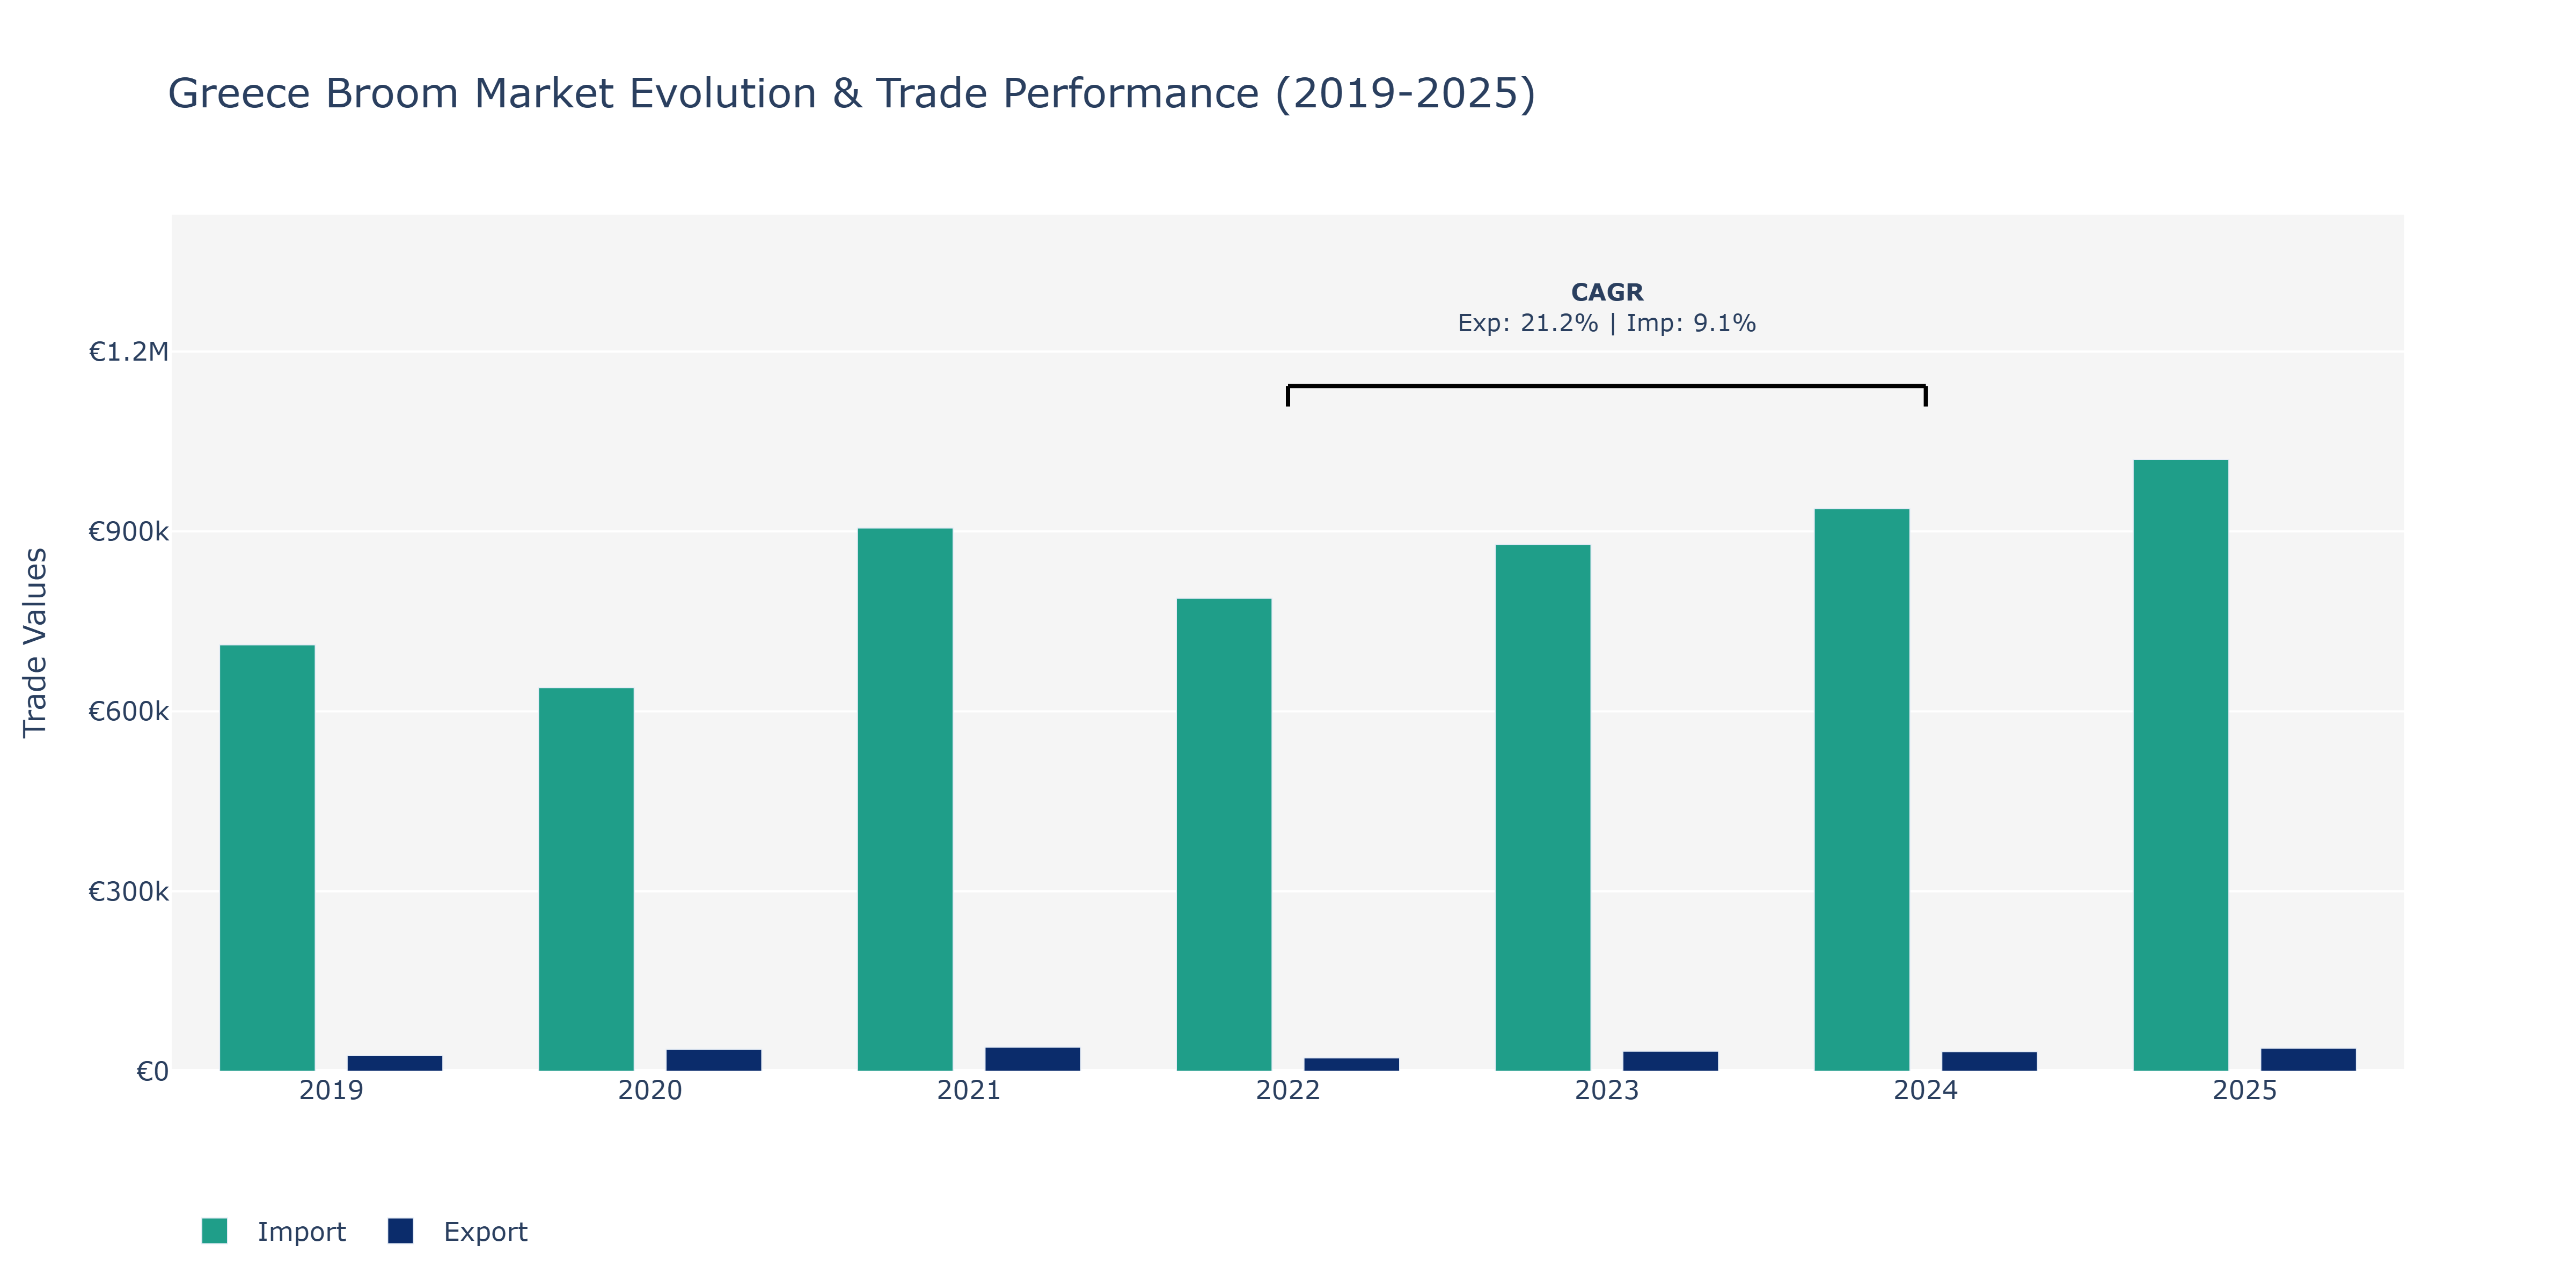
Between 2019 and 2025, the Greece Broom Market witnessed fluctuations in both exports and imports. The data shows a steady rise in exports from €25.9 thousand in 2019 to a peak of approximately €38.58 thousand in 2025. In contrast, imports fluctuated, reaching their highest point of around €1.02 million in 2025 after starting at €710.84 thousand in 2019. The peak in imports could be attributed to increased demand for raw materials or finished goods related to broom production. The decline in exports in 2022 may indicate market challenges or shifts in consumer preferences. However, the subsequent rebound in 2023 suggests resilience and adaptability within the market. The growth in exports could be influenced by innovations in product design or increased international demand for Greek broom products. These dynamics highlight the market's responsiveness to changing conditions and its ability to capitalize on emerging opportunities, showcasing a promising outlook for the Greece Broom Market.
Key Highlights of the Report:
- Greece Broom Market Outlook
- Market Size of Greece Broom Market, 2025
- Forecast of Greece Broom Market, 2032
- Historical Data and Forecast of Greece Broom Revenues & Volume for the Period 2022-2032F
- Greece Broom Market Trend Evolution
- Greece Broom Market Drivers and Challenges
- Greece Broom Price Trends
- Greece Broom Porter`s Five Forces
- Greece Broom Industry Life Cycle
- Historical Data and Forecast of Greece Broom Market Revenues & Volume By Product for the Period 2022-2032F
- Historical Data and Forecast of Greece Broom Market Revenues & Volume By Angle Broom for the Period 2022-2032F
- Historical Data and Forecast of Greece Broom Market Revenues & Volume By Corn-fill Broom for the Period 2022-2032F
- Historical Data and Forecast of Greece Broom Market Revenues & Volume By Push Broom for the Period 2022-2032F
- Historical Data and Forecast of Greece Broom Market Revenues & Volume By Others for the Period 2022-2032F
- Historical Data and Forecast of Greece Broom Market Revenues & Volume By Applications for the Period 2022-2032F
- Historical Data and Forecast of Greece Broom Market Revenues & Volume By Indoor Floor for the Period 2022-2032F
- Historical Data and Forecast of Greece Broom Market Revenues & Volume By Outdoor Ground for the Period 2022-2032F
- Historical Data and Forecast of Greece Broom Market Revenues & Volume By Table for the Period 2022-2032F
- Historical Data and Forecast of Greece Broom Market Revenues & Volume By Others for the Period 2022-2032F
- Greece Broom Import Export Trade Statistics
- Market Opportunity Assessment By Product
- Market Opportunity Assessment By Applications
- Greece Broom Top Companies Market Share
- Greece Broom Competitive Benchmarking By Technical and Operational Parameters
- Greece Broom Company Profiles
- Greece Broom Key Strategic Recommendations
Frequently Asked Questions About the Market Study (FAQs):
6Wresearch actively monitors the Greece Broom Market and publishes its comprehensive annual report, highlighting emerging trends, growth drivers, revenue analysis, and forecast outlook. Our insights help businesses to make data-backed strategic decisions with ongoing market dynamics. Our analysts track relevent industries related to the Greece Broom Market, allowing our clients with actionable intelligence and reliable forecasts tailored to emerging regional needs.
Yes, we provide customisation as per your requirements. To learn more, feel free to contact us on sales@6wresearch.com
1 Executive Summary |
2 Introduction |
2.1 Key Highlights of the Report |
2.2 Report Description |
2.3 Market Scope & Segmentation |
2.4 Research Methodology |
2.5 Assumptions |
3 Greece Broom Market Overview |
3.1 Greece Country Macro Economic Indicators |
3.2 Greece Broom Market Revenues & Volume, 2022 & 2032F |
3.3 Greece Broom Market - Industry Life Cycle |
3.4 Greece Broom Market - Porter's Five Forces |
3.5 Greece Broom Market Revenues & Volume Share, By Product, 2022 & 2032F |
3.6 Greece Broom Market Revenues & Volume Share, By Applications, 2022 & 2032F |
4 Greece Broom Market Dynamics |
4.1 Impact Analysis |
4.2 Market Drivers |
4.2.1 Growing awareness about cleanliness and hygiene among consumers in Greece |
4.2.2 Increasing emphasis on sustainable and eco-friendly products |
4.2.3 Rise in disposable income leading to higher spending on household products |
4.3 Market Restraints |
4.3.1 Intense competition from alternative cleaning products such as vacuum cleaners and mops |
4.3.2 Fluctuating raw material prices affecting production costs |
4.3.3 Economic uncertainties impacting consumer spending habits |
5 Greece Broom Market Trends |
6 Greece Broom Market Segmentations |
6.1 Greece Broom Market, By Product |
6.1.1 Overview and Analysis |
6.1.2 Greece Broom Market Revenues & Volume, By Angle Broom, 2022-2032F |
6.1.3 Greece Broom Market Revenues & Volume, By Corn-fill Broom, 2022-2032F |
6.1.4 Greece Broom Market Revenues & Volume, By Push Broom, 2022-2032F |
6.1.5 Greece Broom Market Revenues & Volume, By Others, 2022-2032F |
6.2 Greece Broom Market, By Applications |
6.2.1 Overview and Analysis |
6.2.2 Greece Broom Market Revenues & Volume, By Indoor Floor, 2022-2032F |
6.2.3 Greece Broom Market Revenues & Volume, By Outdoor Ground, 2022-2032F |
6.2.4 Greece Broom Market Revenues & Volume, By Table, 2022-2032F |
6.2.5 Greece Broom Market Revenues & Volume, By Others, 2022-2032F |
7 Greece Broom Market Import-Export Trade Statistics |
7.1 Greece Broom Market Export to Major Countries |
7.2 Greece Broom Market Imports from Major Countries |
8 Greece Broom Market Key Performance Indicators |
8.1 Percentage increase in demand for eco-friendly brooms in Greece |
8.2 Average time taken to introduce new broom products in the market |
8.3 Number of partnerships with local retailers to expand distribution network |
9 Greece Broom Market - Opportunity Assessment |
9.1 Greece Broom Market Opportunity Assessment, By Product, 2022 & 2032F |
9.2 Greece Broom Market Opportunity Assessment, By Applications, 2022 & 2032F |
10 Greece Broom Market - Competitive Landscape |
10.1 Greece Broom Market Revenue Share, By Companies, 2025 |
10.2 Greece Broom Market Competitive Benchmarking, By Operating and Technical Parameters |
11 Company Profiles |
12 Recommendations | 13 Disclaimer |
Global Go To Market Strategy - 2030
Export potential enables firms to identify high-growth global markets with greater confidence by combining advanced trade intelligence with a structured quantitative methodology. The framework analyzes emerging demand trends and country-level import patterns while integrating macroeconomic and trade datasets such as GDP and population forecasts, bilateral import–export flows, tariff structures, elasticity differentials between developed and developing economies, geographic distance, and import demand projections. Using weighted trade values from 2020–2024 as the base period to project country-to-country export potential for 2030, these inputs are operationalized through calculated drivers such as gravity model parameters, tariff impact factors, and projected GDP per-capita growth. Through an analysis of hidden potentials, demand hotspots, and market conditions that are most favorable to success, this method enables firms to focus on target countries, maximize returns, and global expansion with data, backed by accuracy.
By factoring in the projected importer demand gap that is currently unmet and could be potential opportunity, it identifies the potential for the Exporter (Country) among 190 countries, against the general trade analysis, which identifies the biggest importer or exporter.
To discover high-growth global markets and optimize your business strategy:
Click Here
Pricing
- Single User License$ 1,995
- Department License$ 2,400
- Site License$ 3,120
- Global License$ 3,795

Leadership Perspectives from Industry Events
Search
Thought Leadership and Analyst Meet


Our Clients
6WResearch In News
- Doha a strategic location for EV manufacturing hub: IPA Qatar
- Demand for luxury TVs surging in the GCC, says Samsung
- Empowering Growth: The Thriving Journey of Bangladesh’s Cable Industry
- Demand for luxury TVs surging in the GCC, says Samsung
- Video call with a traditional healer? Once unthinkable, it’s now common in South Africa
- Intelligent Buildings To Smooth GCC’s Path To Net Zero
Latest Reports
- New Zealand Aseptic Manufacturing Market (2026-2032)
- Netherlands Aseptic Manufacturing Market (2026-2032)
- Nauru Aseptic Manufacturing Market (2026-2032)
- Namibia Aseptic Manufacturing Market (2026-2032)
- Mozambique Aseptic Manufacturing Market (2026-2032)
- Montenegro Aseptic Manufacturing Market (2026-2032)
- Mongolia Aseptic Manufacturing Market (2026-2032)
- Monaco Aseptic Manufacturing Market (2026-2032)
- Micronesia Aseptic Manufacturing Market (2026-2032)
- Mauritius Aseptic Manufacturing Market (2026-2032)
Industry Events and Analyst Meet

HIMTEX 2026

India Refining Summit 2026

India EV Show 2026

EV tech India Expo 2026

Auto Tech Asia 2026
Whitepaper
- Middle East & Africa Commercial Security Market Click here to view more.
- Middle East & Africa Fire Safety Systems & Equipment Market Click here to view more.
- GCC Drone Market Click here to view more.
- Middle East Lighting Fixture Market Click here to view more.
- GCC Physical & Perimeter Security Market Click here to view more.