Greece Copper Sulfate Market (2026-2032) | Competition, Outlook, Industry, Trends, Share, Strategy, Opportunities, Pricing Analysis, Investment Trends, Segments, Strategic Insights, Value, Analysis, Restraints, Size, Consumer Insights, Drivers, Supply, Forecast, Challenges, Segmentation, Competitive, Companies, Growth, Demand, Revenue
Market Forecast By Form (Powder, Liquid, Crystals, Others), By Grade (Technical Grade, Industrial Grade, Feed Grade, Others), By Application (Fungicide, Electroplating, Feed Additive, Others), By End-Use (Agriculture, Electronics, Animal Nutrition, Others), By Distribution Channel (Direct Sales, Distributors, Online Sales, Others) And Competitive Landscape
| Product Code: ETC11761701 | Publication Date: Apr 2025 | Updated Date: Apr 2026 | Product Type: Market Research Report | |
| Publisher: 6Wresearch | No. of Pages: 65 | No. of Figures: 34 | No. of Tables: 19 | |
Greece Copper Sulfate Market Size (2020-2030)
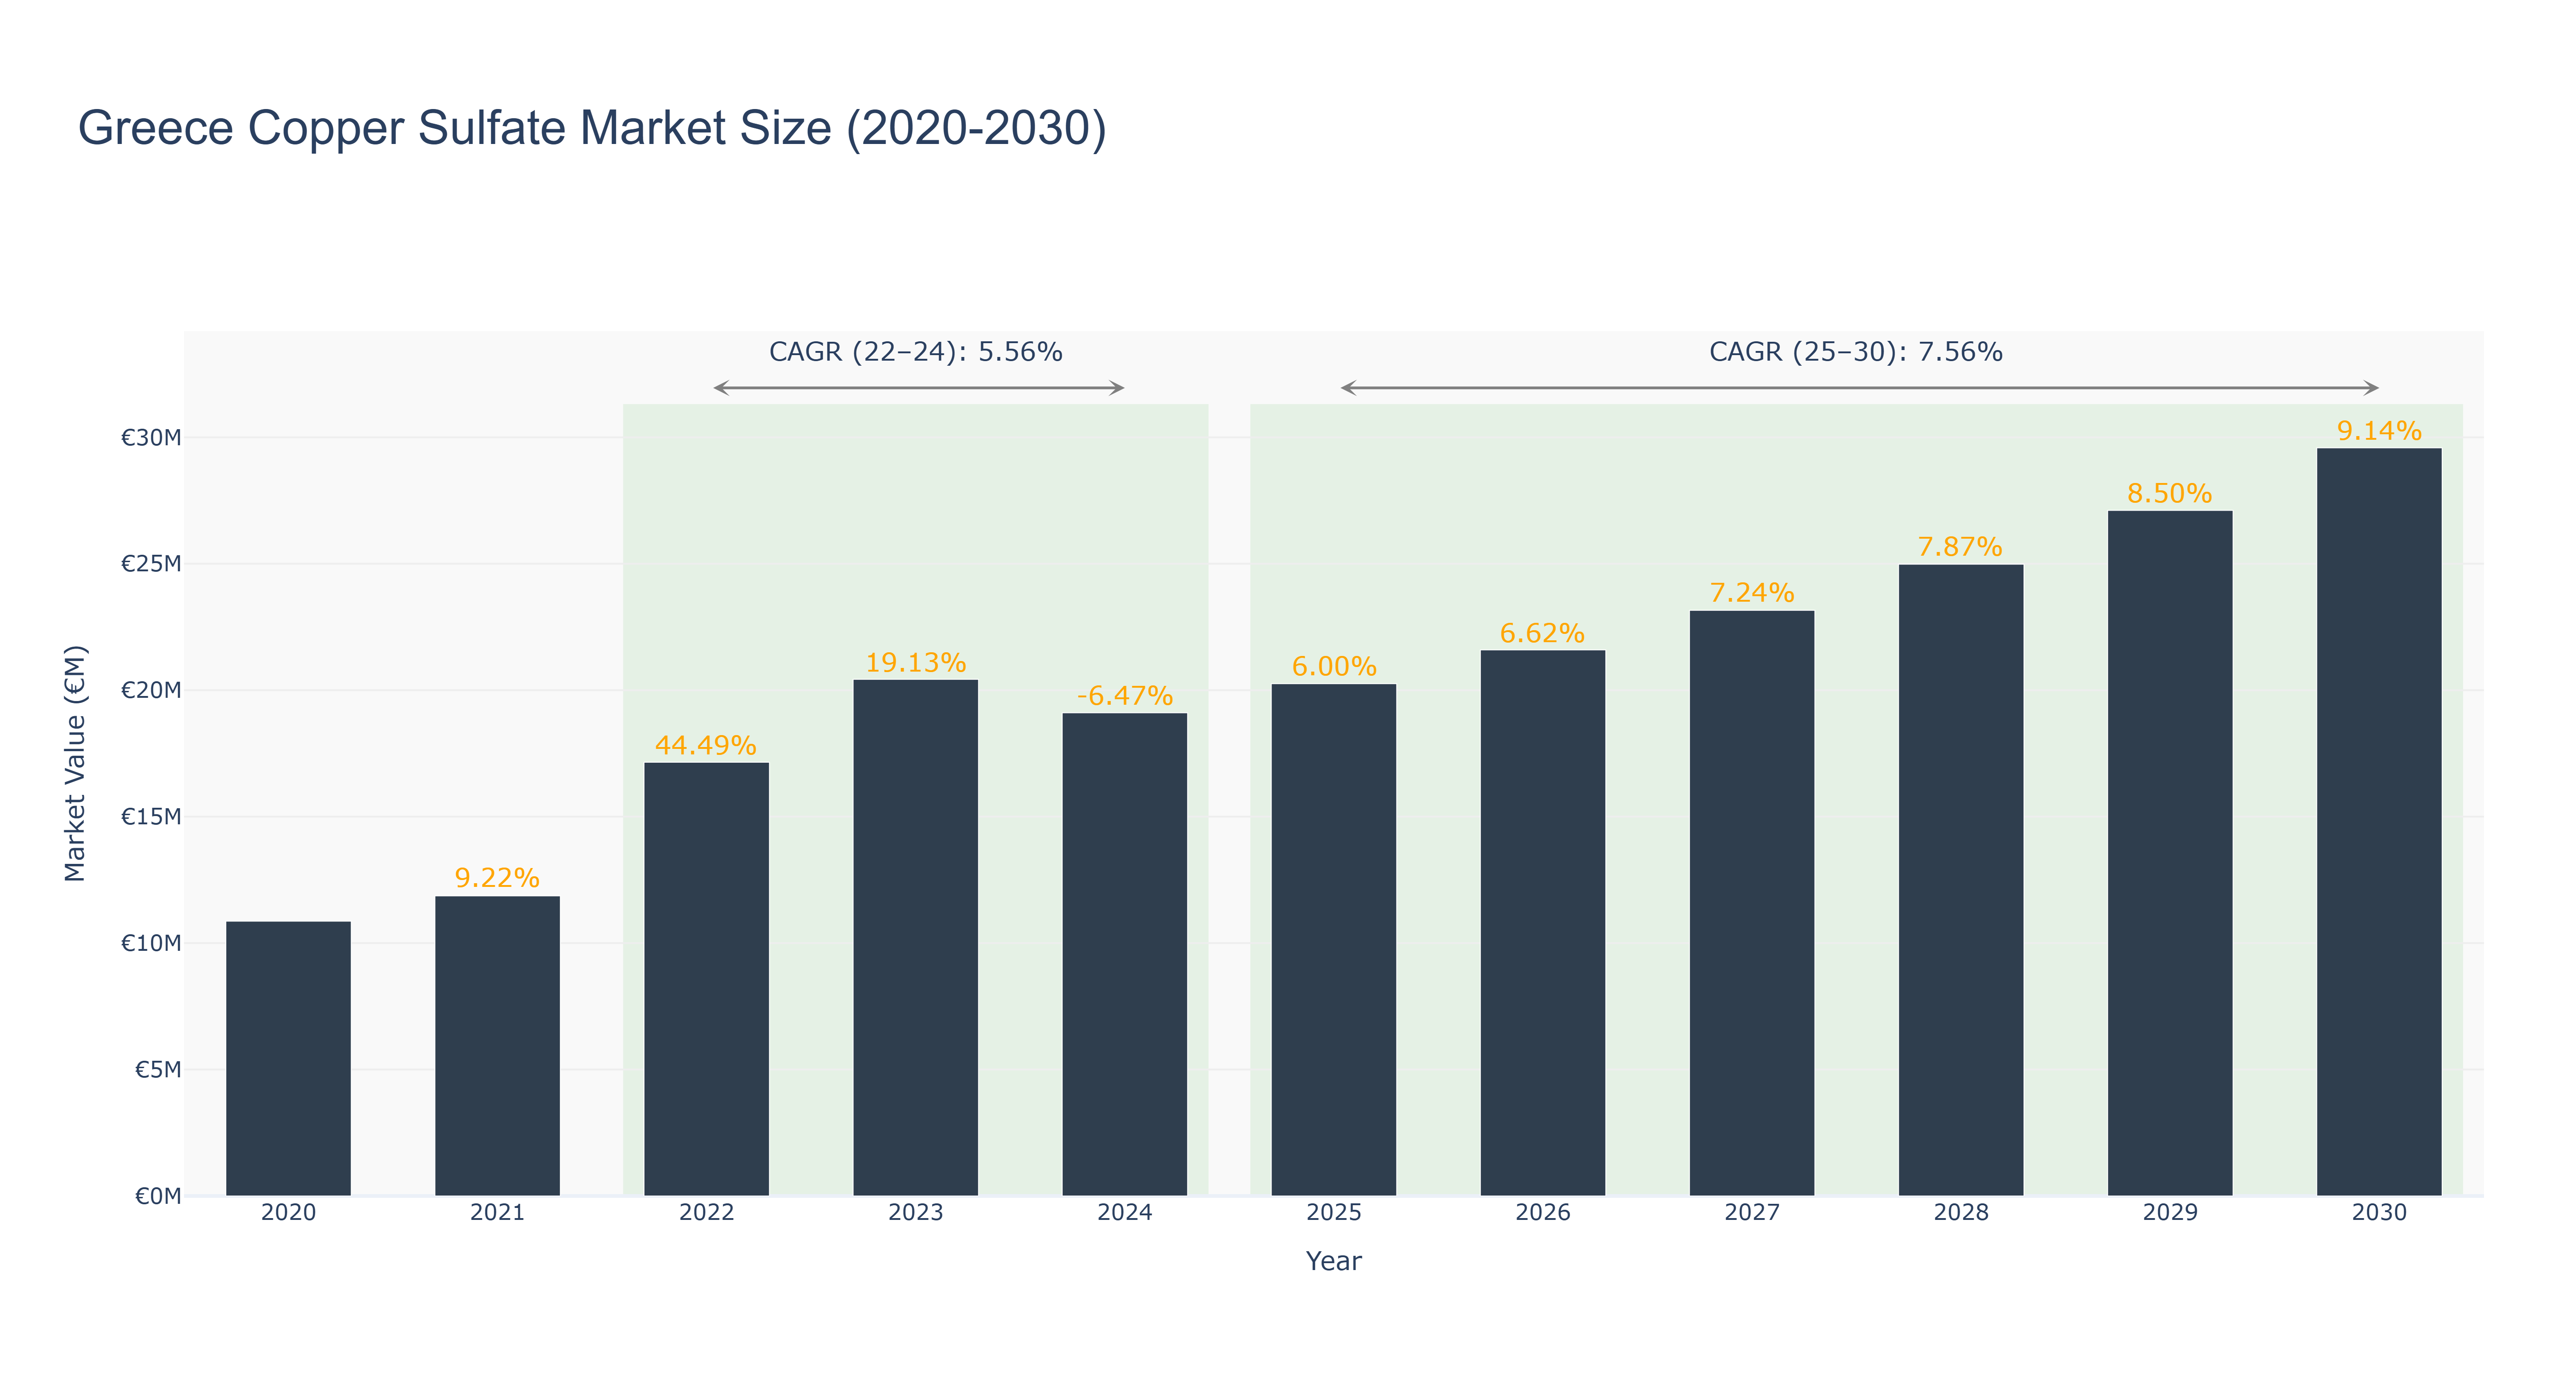
The Greece Copper Sulfate Market experienced significant fluctuations between 2020 and 2024, peaking in 2022 with a market size of €17.15 million, driven by a remarkable growth rate of 44.49%. Following this peak, the market saw a decline to €19.11 million in 2024, reflecting a negative growth rate of -6.47%, largely attributed to decreased demand in agricultural applications and supply chain challenges. Looking ahead, the forecasted period from 2025 to 2030 indicates a positive trend, with projected market sizes growing from €20.26 million in 2025 to €29.59 million by 2030, supported by a compound annual growth rate (CAGR) of 7.56%. Key drivers for this growth include increasing usage in agriculture for fungicides and the rising demand in the construction industry. Overall, steady advancements in production technologies and sustainability initiatives are expected to bolster market resilience and expansion in the coming years.
Greece Copper Sulfate Market: Production & Trade Performance (2019-2025)
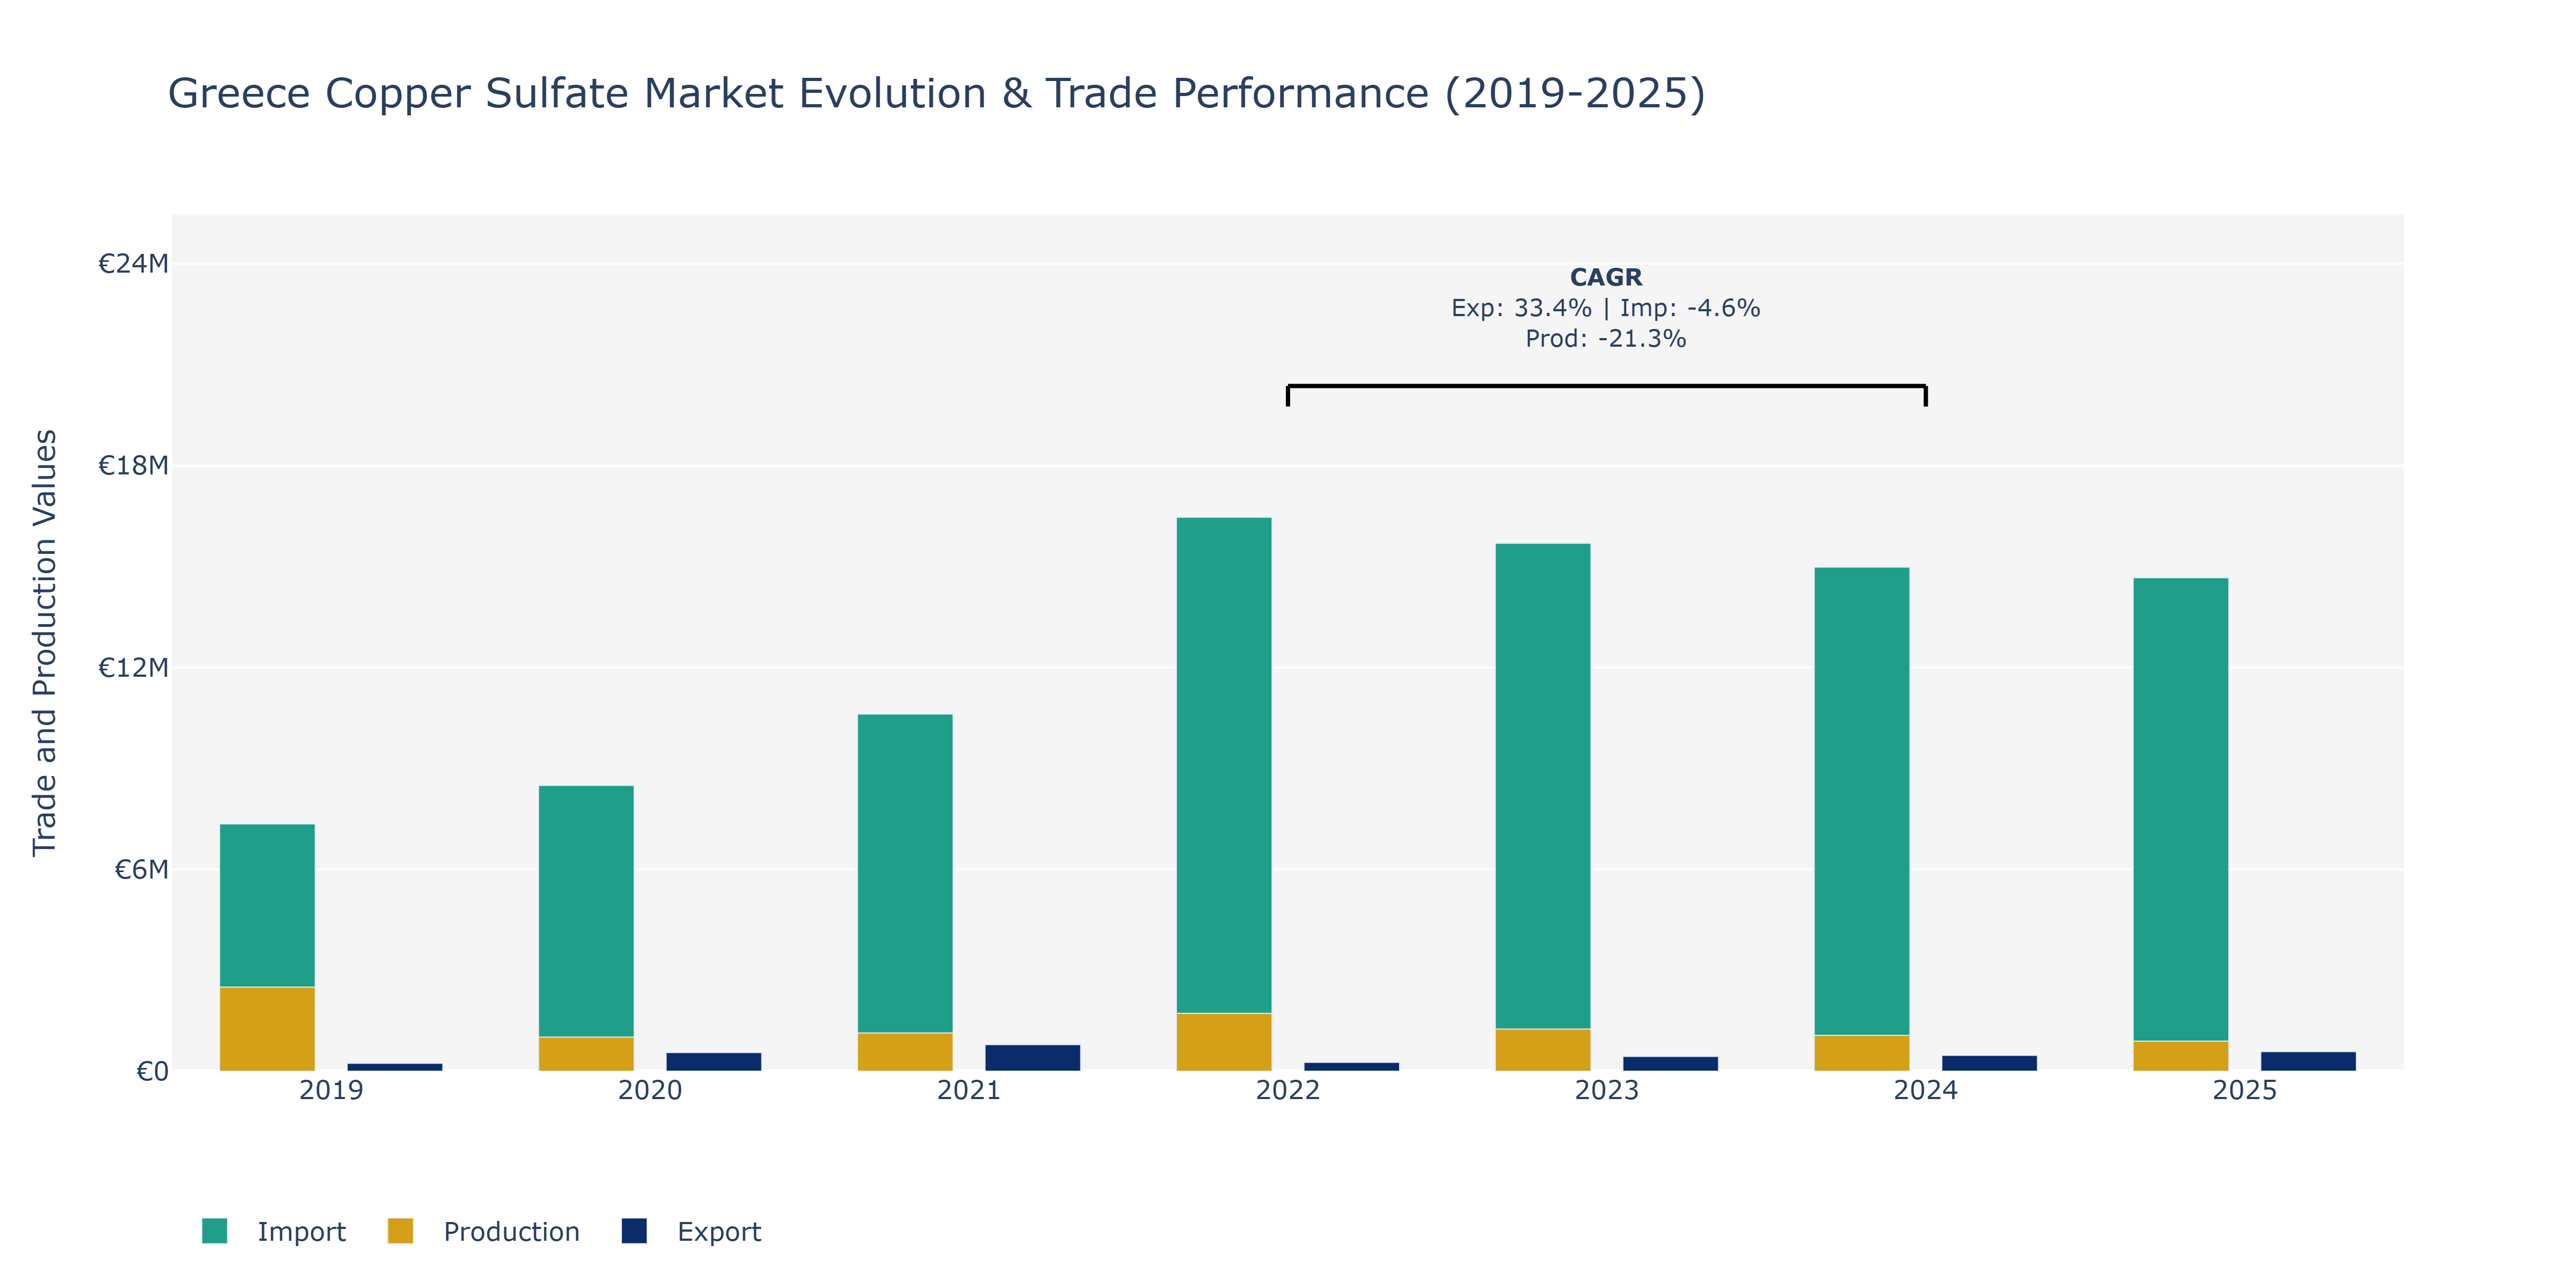
In the Greece Copper Sulfate Market, exports displayed fluctuating trends over the years, with a peak in 2021 at €789.28 thousand before a decrease in 2022 to €264.88 thousand. Imports, on the other hand, showed a consistent decline from €7.35 million in 2019 to €14.67 million in 2025. Production experienced a notable decline from €2.50 million in 2019 to €0.90 million in 2025, reaching its lowest point in 2025. The decline in production could be attributed to factors such as changes in demand dynamics, advancements in alternative products, or shifts in manufacturing locations affecting the local industry. The fluctuations in exports may have been influenced by global market demand, price volatility, or supply chain disruptions. To maintain market competitiveness, stakeholders could focus on enhancing production efficiency, exploring new export markets, and implementing sustainable practices in line with evolving industry standards.
Key Highlights of the Report:
- Greece Copper Sulfate Market Outlook
- Market Size of Greece Copper Sulfate Market, 2025
- Forecast of Greece Copper Sulfate Market, 2032
- Historical Data and Forecast of Greece Copper Sulfate Revenues & Volume for the Period 2022-2032F
- Greece Copper Sulfate Market Trend Evolution
- Greece Copper Sulfate Market Drivers and Challenges
- Greece Copper Sulfate Price Trends
- Greece Copper Sulfate Porter's Five Forces
- Greece Copper Sulfate Industry Life Cycle
- Historical Data and Forecast of Greece Copper Sulfate Market Revenues & Volume By Form for the Period 2022-2032F
- Historical Data and Forecast of Greece Copper Sulfate Market Revenues & Volume By Powder for the Period 2022-2032F
- Historical Data and Forecast of Greece Copper Sulfate Market Revenues & Volume By Liquid for the Period 2022-2032F
- Historical Data and Forecast of Greece Copper Sulfate Market Revenues & Volume By Crystals for the Period 2022-2032F
- Historical Data and Forecast of Greece Copper Sulfate Market Revenues & Volume By Others for the Period 2022-2032F
- Historical Data and Forecast of Greece Copper Sulfate Market Revenues & Volume By Grade for the Period 2022-2032F
- Historical Data and Forecast of Greece Copper Sulfate Market Revenues & Volume By Technical Grade for the Period 2022-2032F
- Historical Data and Forecast of Greece Copper Sulfate Market Revenues & Volume By Industrial Grade for the Period 2022-2032F
- Historical Data and Forecast of Greece Copper Sulfate Market Revenues & Volume By Feed Grade for the Period 2022-2032F
- Historical Data and Forecast of Greece Copper Sulfate Market Revenues & Volume By Others for the Period 2022-2032F
- Historical Data and Forecast of Greece Copper Sulfate Market Revenues & Volume By Application for the Period 2022-2032F
- Historical Data and Forecast of Greece Copper Sulfate Market Revenues & Volume By Fungicide for the Period 2022-2032F
- Historical Data and Forecast of Greece Copper Sulfate Market Revenues & Volume By Electroplating for the Period 2022-2032F
- Historical Data and Forecast of Greece Copper Sulfate Market Revenues & Volume By Feed Additive for the Period 2022-2032F
- Historical Data and Forecast of Greece Copper Sulfate Market Revenues & Volume By Others for the Period 2022-2032F
- Historical Data and Forecast of Greece Copper Sulfate Market Revenues & Volume By End-Use for the Period 2022-2032F
- Historical Data and Forecast of Greece Copper Sulfate Market Revenues & Volume By Agriculture for the Period 2022-2032F
- Historical Data and Forecast of Greece Copper Sulfate Market Revenues & Volume By Electronics for the Period 2022-2032F
- Historical Data and Forecast of Greece Copper Sulfate Market Revenues & Volume By Animal Nutrition for the Period 2022-2032F
- Historical Data and Forecast of Greece Copper Sulfate Market Revenues & Volume By Others for the Period 2022-2032F
- Historical Data and Forecast of Greece Copper Sulfate Market Revenues & Volume By Distribution Channel for the Period 2022-2032F
- Historical Data and Forecast of Greece Copper Sulfate Market Revenues & Volume By Direct Sales for the Period 2022-2032F
- Historical Data and Forecast of Greece Copper Sulfate Market Revenues & Volume By Distributors for the Period 2022-2032F
- Historical Data and Forecast of Greece Copper Sulfate Market Revenues & Volume By Online Sales for the Period 2022-2032F
- Historical Data and Forecast of Greece Copper Sulfate Market Revenues & Volume By Others for the Period 2022 - 2032F
- Greece Copper Sulfate Import Export Trade Statistics
- Market Opportunity Assessment By Form
- Market Opportunity Assessment By Grade
- Market Opportunity Assessment By Application
- Market Opportunity Assessment By End-Use
- Market Opportunity Assessment By Distribution Channel
- Greece Copper Sulfate Top Companies Market Share
- Greece Copper Sulfate Competitive Benchmarking By Technical and Operational Parameters
- Greece Copper Sulfate Company Profiles
- Greece Copper Sulfate Key Strategic Recommendations
Frequently Asked Questions About the Market Study (FAQs):
6Wresearch actively monitors the Greece Copper Sulfate Market and publishes its comprehensive annual report, highlighting emerging trends, growth drivers, revenue analysis, and forecast outlook. Our insights help businesses to make data-backed strategic decisions with ongoing market dynamics. Our analysts track relevent industries related to the Greece Copper Sulfate Market, allowing our clients with actionable intelligence and reliable forecasts tailored to emerging regional needs.
Yes, we provide customisation as per your requirements. To learn more, feel free to contact us on sales@6wresearch.com
1 Executive Summary |
2 Introduction |
2.1 Key Highlights of the Report |
2.2 Report Description |
2.3 Market Scope & Segmentation |
2.4 Research Methodology |
2.5 Assumptions |
3 Greece Copper Sulfate Market Overview |
3.1 Greece Country Macro Economic Indicators |
3.2 Greece Copper Sulfate Market Revenues & Volume, 2022 & 2032F |
3.3 Greece Copper Sulfate Market - Industry Life Cycle |
3.4 Greece Copper Sulfate Market - Porter's Five Forces |
3.5 Greece Copper Sulfate Market Revenues & Volume Share, By Form, 2022 & 2032F |
3.6 Greece Copper Sulfate Market Revenues & Volume Share, By Grade, 2022 & 2032F |
3.7 Greece Copper Sulfate Market Revenues & Volume Share, By Application, 2022 & 2032F |
3.8 Greece Copper Sulfate Market Revenues & Volume Share, By End-Use, 2022 & 2032F |
3.9 Greece Copper Sulfate Market Revenues & Volume Share, By Distribution Channel, 2022 & 2032F |
4 Greece Copper Sulfate Market Dynamics |
4.1 Impact Analysis |
4.2 Market Drivers |
4.2.1 Increasing demand for agricultural products and fertilizers, as copper sulfate is used as a fungicide and fertilizer additive. |
4.2.2 Growing awareness about the benefits of copper sulfate in industries such as mining, textiles, and healthcare. |
4.2.3 Favorable government regulations and initiatives promoting the use of copper sulfate in various sectors. |
4.3 Market Restraints |
4.3.1 Fluctuating prices of raw materials used in copper sulfate production, such as copper and sulfur. |
4.3.2 Environmental concerns related to the disposal and runoff of copper sulfate, leading to regulatory challenges. |
4.3.3 Competition from alternative products or substitutes in the market, impacting the demand for copper sulfate. |
5 Greece Copper Sulfate Market Trends |
6 Greece Copper Sulfate Market, By Types |
6.1 Greece Copper Sulfate Market, By Form |
6.1.1 Overview and Analysis |
6.1.2 Greece Copper Sulfate Market Revenues & Volume, By Form, 2022 - 2032F |
6.1.3 Greece Copper Sulfate Market Revenues & Volume, By Powder, 2022 - 2032F |
6.1.4 Greece Copper Sulfate Market Revenues & Volume, By Liquid, 2022 - 2032F |
6.1.5 Greece Copper Sulfate Market Revenues & Volume, By Crystals, 2022 - 2032F |
6.1.6 Greece Copper Sulfate Market Revenues & Volume, By Others, 2022 - 2032F |
6.2 Greece Copper Sulfate Market, By Grade |
6.2.1 Overview and Analysis |
6.2.2 Greece Copper Sulfate Market Revenues & Volume, By Technical Grade, 2022 - 2032F |
6.2.3 Greece Copper Sulfate Market Revenues & Volume, By Industrial Grade, 2022 - 2032F |
6.2.4 Greece Copper Sulfate Market Revenues & Volume, By Feed Grade, 2022 - 2032F |
6.2.5 Greece Copper Sulfate Market Revenues & Volume, By Others, 2022 - 2032F |
6.3 Greece Copper Sulfate Market, By Application |
6.3.1 Overview and Analysis |
6.3.2 Greece Copper Sulfate Market Revenues & Volume, By Fungicide, 2022 - 2032F |
6.3.3 Greece Copper Sulfate Market Revenues & Volume, By Electroplating, 2022 - 2032F |
6.3.4 Greece Copper Sulfate Market Revenues & Volume, By Feed Additive, 2022 - 2032F |
6.3.5 Greece Copper Sulfate Market Revenues & Volume, By Others, 2022 - 2032F |
6.4 Greece Copper Sulfate Market, By End-Use |
6.4.1 Overview and Analysis |
6.4.2 Greece Copper Sulfate Market Revenues & Volume, By Agriculture, 2022 - 2032F |
6.4.3 Greece Copper Sulfate Market Revenues & Volume, By Electronics, 2022 - 2032F |
6.4.4 Greece Copper Sulfate Market Revenues & Volume, By Animal Nutrition, 2022 - 2032F |
6.4.5 Greece Copper Sulfate Market Revenues & Volume, By Others, 2022 - 2032F |
6.5 Greece Copper Sulfate Market, By Distribution Channel |
6.5.1 Overview and Analysis |
6.5.2 Greece Copper Sulfate Market Revenues & Volume, By Direct Sales, 2022 - 2032F |
6.5.3 Greece Copper Sulfate Market Revenues & Volume, By Distributors, 2022 - 2032F |
6.5.4 Greece Copper Sulfate Market Revenues & Volume, By Online Sales, 2022 - 2032F |
6.5.5 Greece Copper Sulfate Market Revenues & Volume, By Others, 2022 - 2032F |
7 Greece Copper Sulfate Market Import-Export Trade Statistics |
7.1 Greece Copper Sulfate Market Export to Major Countries |
7.2 Greece Copper Sulfate Market Imports from Major Countries |
8 Greece Copper Sulfate Market Key Performance Indicators |
8.1 Environmental impact indicators, such as reduction in waste generation or improvement in disposal practices. |
8.2 Adoption rate of copper sulfate in new application areas or industries. |
8.3 Research and development investments and innovations in copper sulfate technology and formulations. |
9 Greece Copper Sulfate Market - Opportunity Assessment |
9.1 Greece Copper Sulfate Market Opportunity Assessment, By Form, 2022 & 2032F |
9.2 Greece Copper Sulfate Market Opportunity Assessment, By Grade, 2022 & 2032F |
9.3 Greece Copper Sulfate Market Opportunity Assessment, By Application, 2022 & 2032F |
9.4 Greece Copper Sulfate Market Opportunity Assessment, By End-Use, 2022 & 2032F |
9.5 Greece Copper Sulfate Market Opportunity Assessment, By Distribution Channel, 2022 & 2032F |
10 Greece Copper Sulfate Market - Competitive Landscape |
10.1 Greece Copper Sulfate Market Revenue Share, By Companies, 2025 |
10.2 Greece Copper Sulfate Market Competitive Benchmarking, By Operating and Technical Parameters |
11 Company Profiles |
12 Recommendations |
13 Disclaimer |
Global Go To Market Strategy - 2030
Export potential enables firms to identify high-growth global markets with greater confidence by combining advanced trade intelligence with a structured quantitative methodology. The framework analyzes emerging demand trends and country-level import patterns while integrating macroeconomic and trade datasets such as GDP and population forecasts, bilateral import–export flows, tariff structures, elasticity differentials between developed and developing economies, geographic distance, and import demand projections. Using weighted trade values from 2020–2024 as the base period to project country-to-country export potential for 2030, these inputs are operationalized through calculated drivers such as gravity model parameters, tariff impact factors, and projected GDP per-capita growth. Through an analysis of hidden potentials, demand hotspots, and market conditions that are most favorable to success, this method enables firms to focus on target countries, maximize returns, and global expansion with data, backed by accuracy.
By factoring in the projected importer demand gap that is currently unmet and could be potential opportunity, it identifies the potential for the Exporter (Country) among 190 countries, against the general trade analysis, which identifies the biggest importer or exporter.
To discover high-growth global markets and optimize your business strategy:
Click Here
Pricing
- Single User License$ 1,995
- Department License$ 2,400
- Site License$ 3,120
- Global License$ 3,795

Leadership Perspectives from Industry Events
Search
Thought Leadership and Analyst Meet


Our Clients
6WResearch In News
- Doha a strategic location for EV manufacturing hub: IPA Qatar
- Demand for luxury TVs surging in the GCC, says Samsung
- Empowering Growth: The Thriving Journey of Bangladesh’s Cable Industry
- Demand for luxury TVs surging in the GCC, says Samsung
- Video call with a traditional healer? Once unthinkable, it’s now common in South Africa
- Intelligent Buildings To Smooth GCC’s Path To Net Zero
Latest Reports
- Taiwan Airport Wireless Infrastructure Market (2026-2032)
- Vietnam Airport Wireless Infrastructure Market (2026-2032)
- Thailand Airport Wireless Infrastructure Market (2026-2032)
- South Korea Airport Wireless Infrastructure Market (2026-2032)
- Romania Airport Wireless Infrastructure Market (2026-2032)
- Qatar Airport Wireless Infrastructure Market (2026-2032)
- Philippines Airport Wireless Infrastructure Market (2026-2032)
- Japan Airport Wireless Infrastructure Market (2026-2032)
- Taiwan Airport Winter Services Market (2026-2032)
- Vietnam Airport Winter Services Market (2026-2032)
Industry Events and Analyst Meet

HIMTEX 2026

India Refining Summit 2026

India EV Show 2026

EV tech India Expo 2026

Auto Tech Asia 2026
Whitepaper
- Middle East & Africa Commercial Security Market Click here to view more.
- Middle East & Africa Fire Safety Systems & Equipment Market Click here to view more.
- GCC Drone Market Click here to view more.
- Middle East Lighting Fixture Market Click here to view more.
- GCC Physical & Perimeter Security Market Click here to view more.