Greece Galvanized Iron Wire Market (2026-2032) | Share, Companies, Trends, Revenue, Industry, Outlook, Forecast, Growth, Size, Value, Analysis & Segmentation
Market Forecast By Product (Hot Galvanized Iron Wire, Cold Galvanized Iron Wire), By Application (Building, Handicrafts, Weaving Screen, Wipe Wall Net, Highway Guardrail, Packaging, Daily Civilian Use, Others) And Competitive Landscape
| Product Code: ETC5390528 | Publication Date: Nov 2023 | Updated Date: Apr 2026 | Product Type: Market Research Report | |
| Publisher: 6Wresearch | Author: Ravi Bhandari | No. of Pages: 60 | No. of Figures: 30 | No. of Tables: 5 |
Greece Galvanized Iron Wire Market Size (2020-2030)
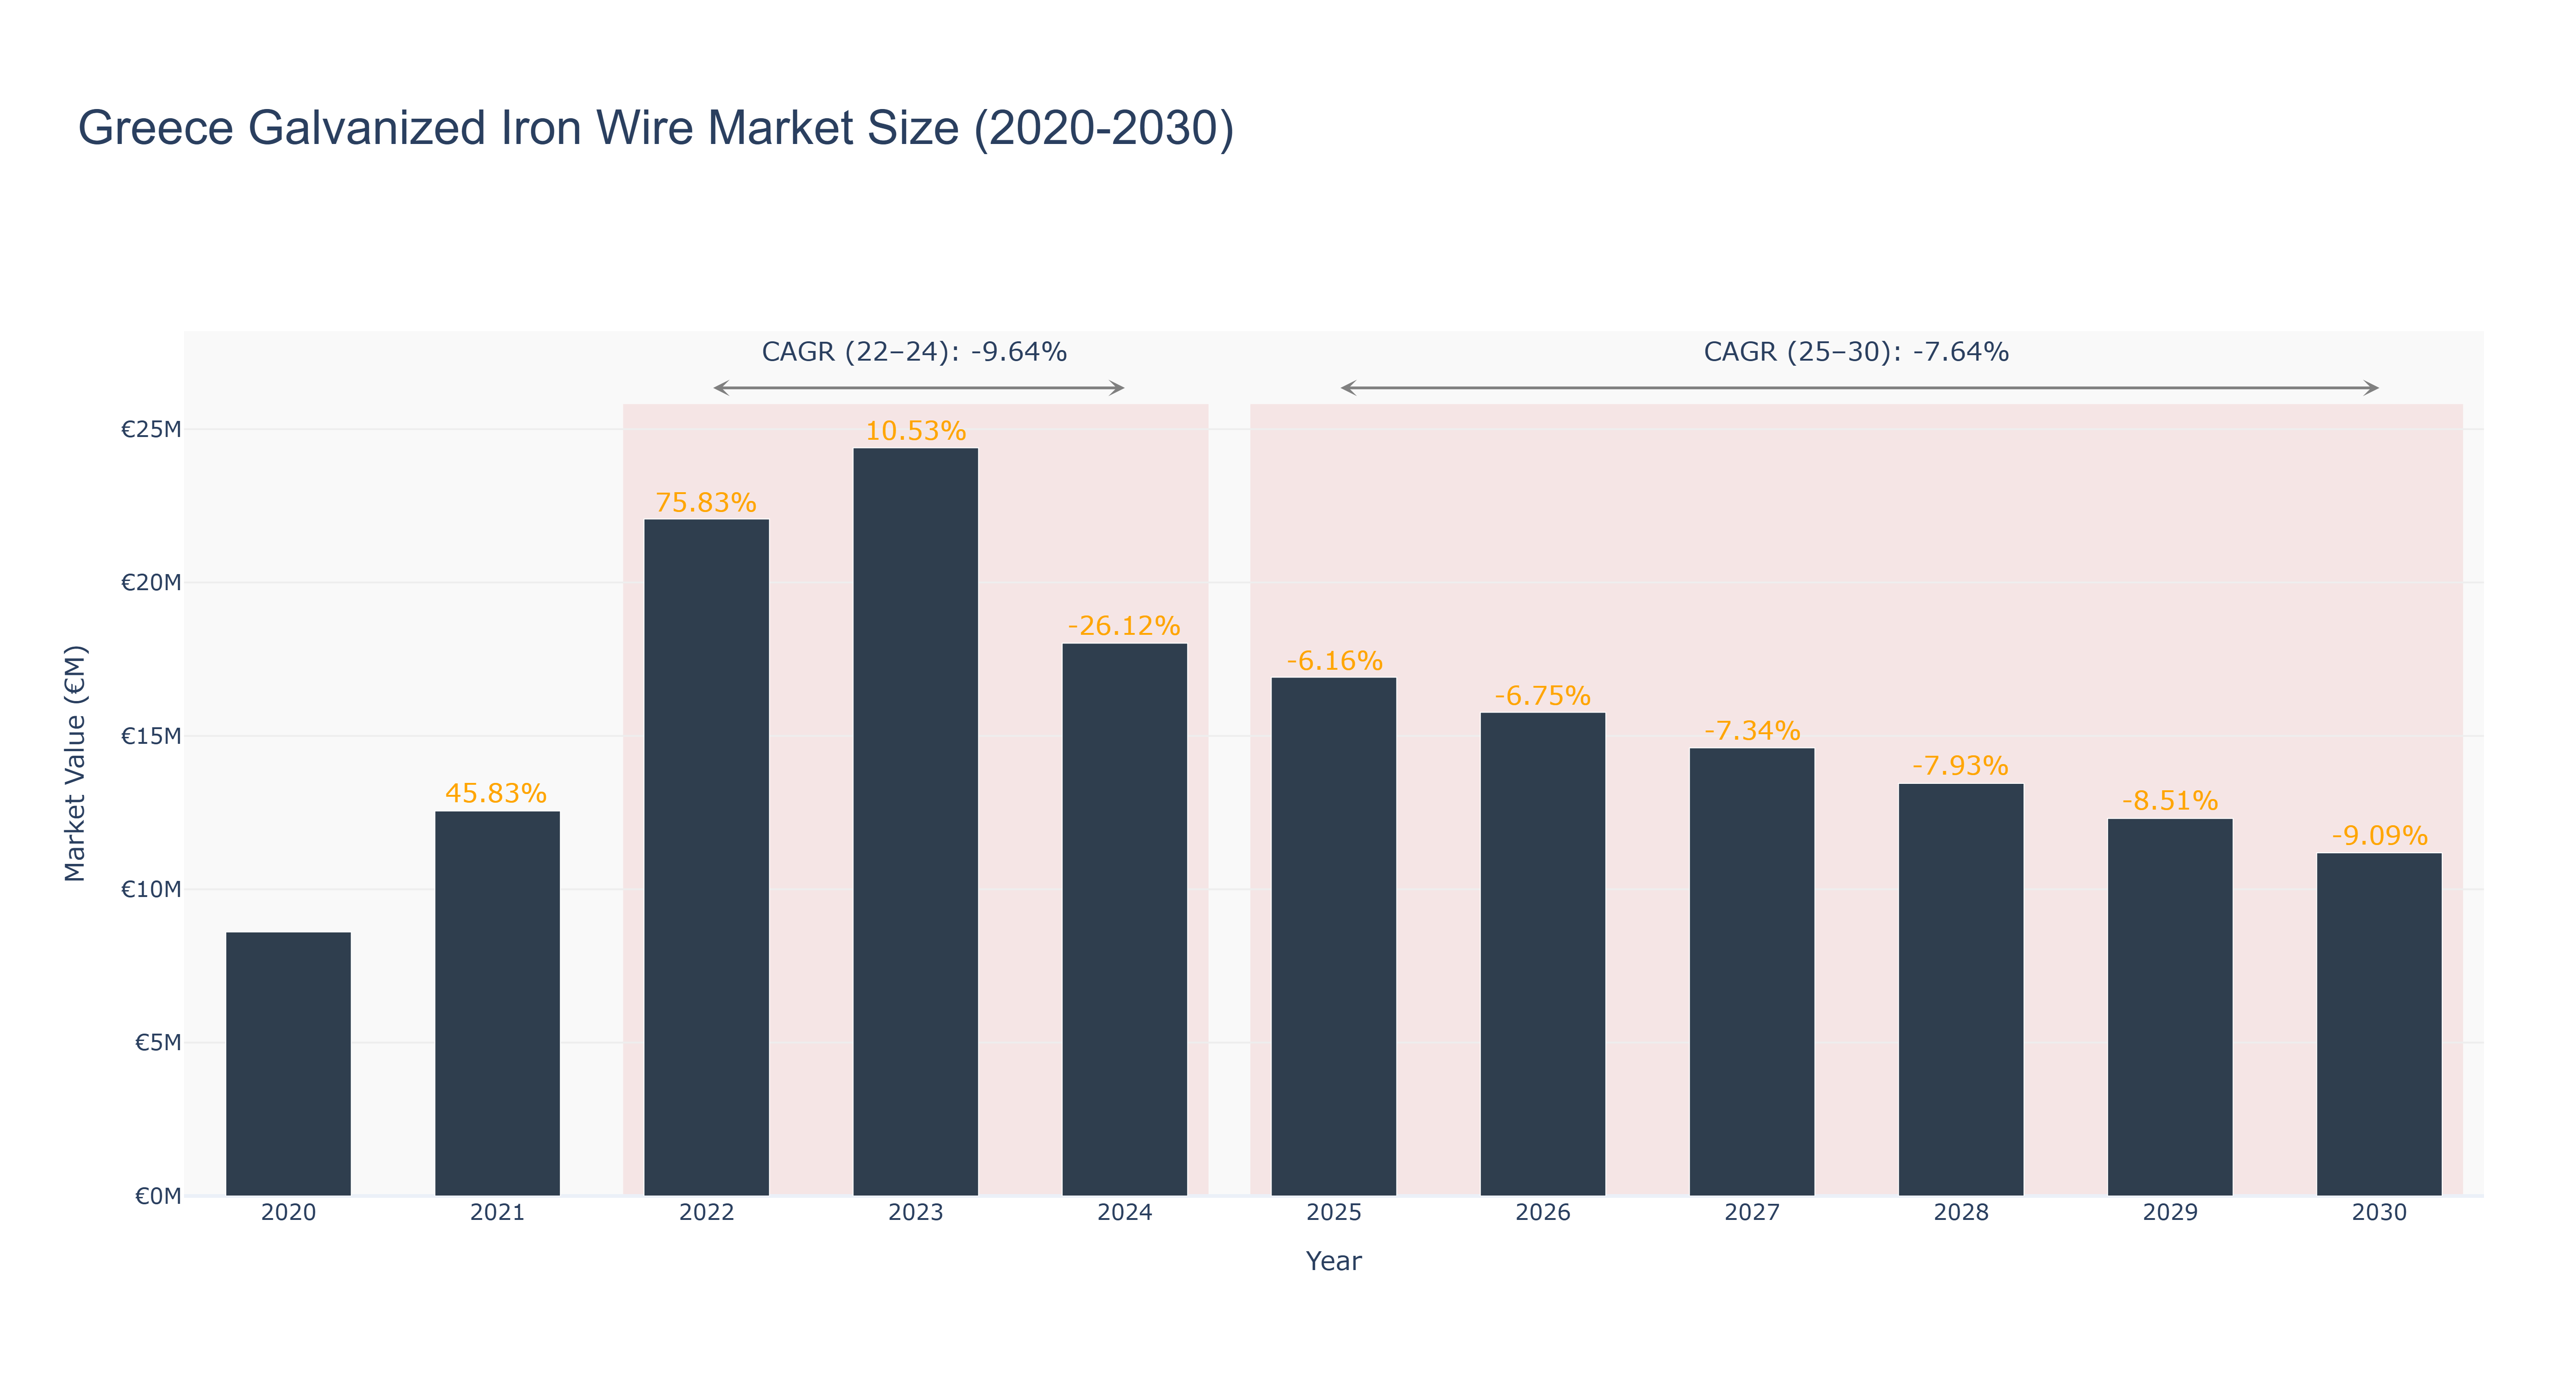
The Greece Galvanized Iron Wire Market experienced a peak market size of €24.39 million in 2023. The actual market size saw fluctuations from €8.61 million in 2020 to €18.02 million in 2024. Forecasted market sizes from 2025 to 2030 show a downward trend, with the market expected to reach €11.19 million in 2030. The CAGR values for the periods 2022-24 and 2025-30 stand at -9.64% and -7.64%, respectively. The market faced a decline post-2023 due to economic uncertainties impacting construction activities, while the negative growth rates indicate a challenging competitive landscape. Looking ahead, Greece is set to invest in sustainable infrastructure projects to boost the construction sector, potentially revitalizing the Galvanized Iron Wire Market. Industry drivers include infrastructure development, construction projects, and government initiatives promoting sustainable building practices. Future developments in Greece may focus on integrating advanced technologies in construction processes to enhance efficiency and sustainability in the Galvanized Iron Wire Market.
Greece Galvanized Iron Wire Market: Production & Trade Performance (2019-2025)
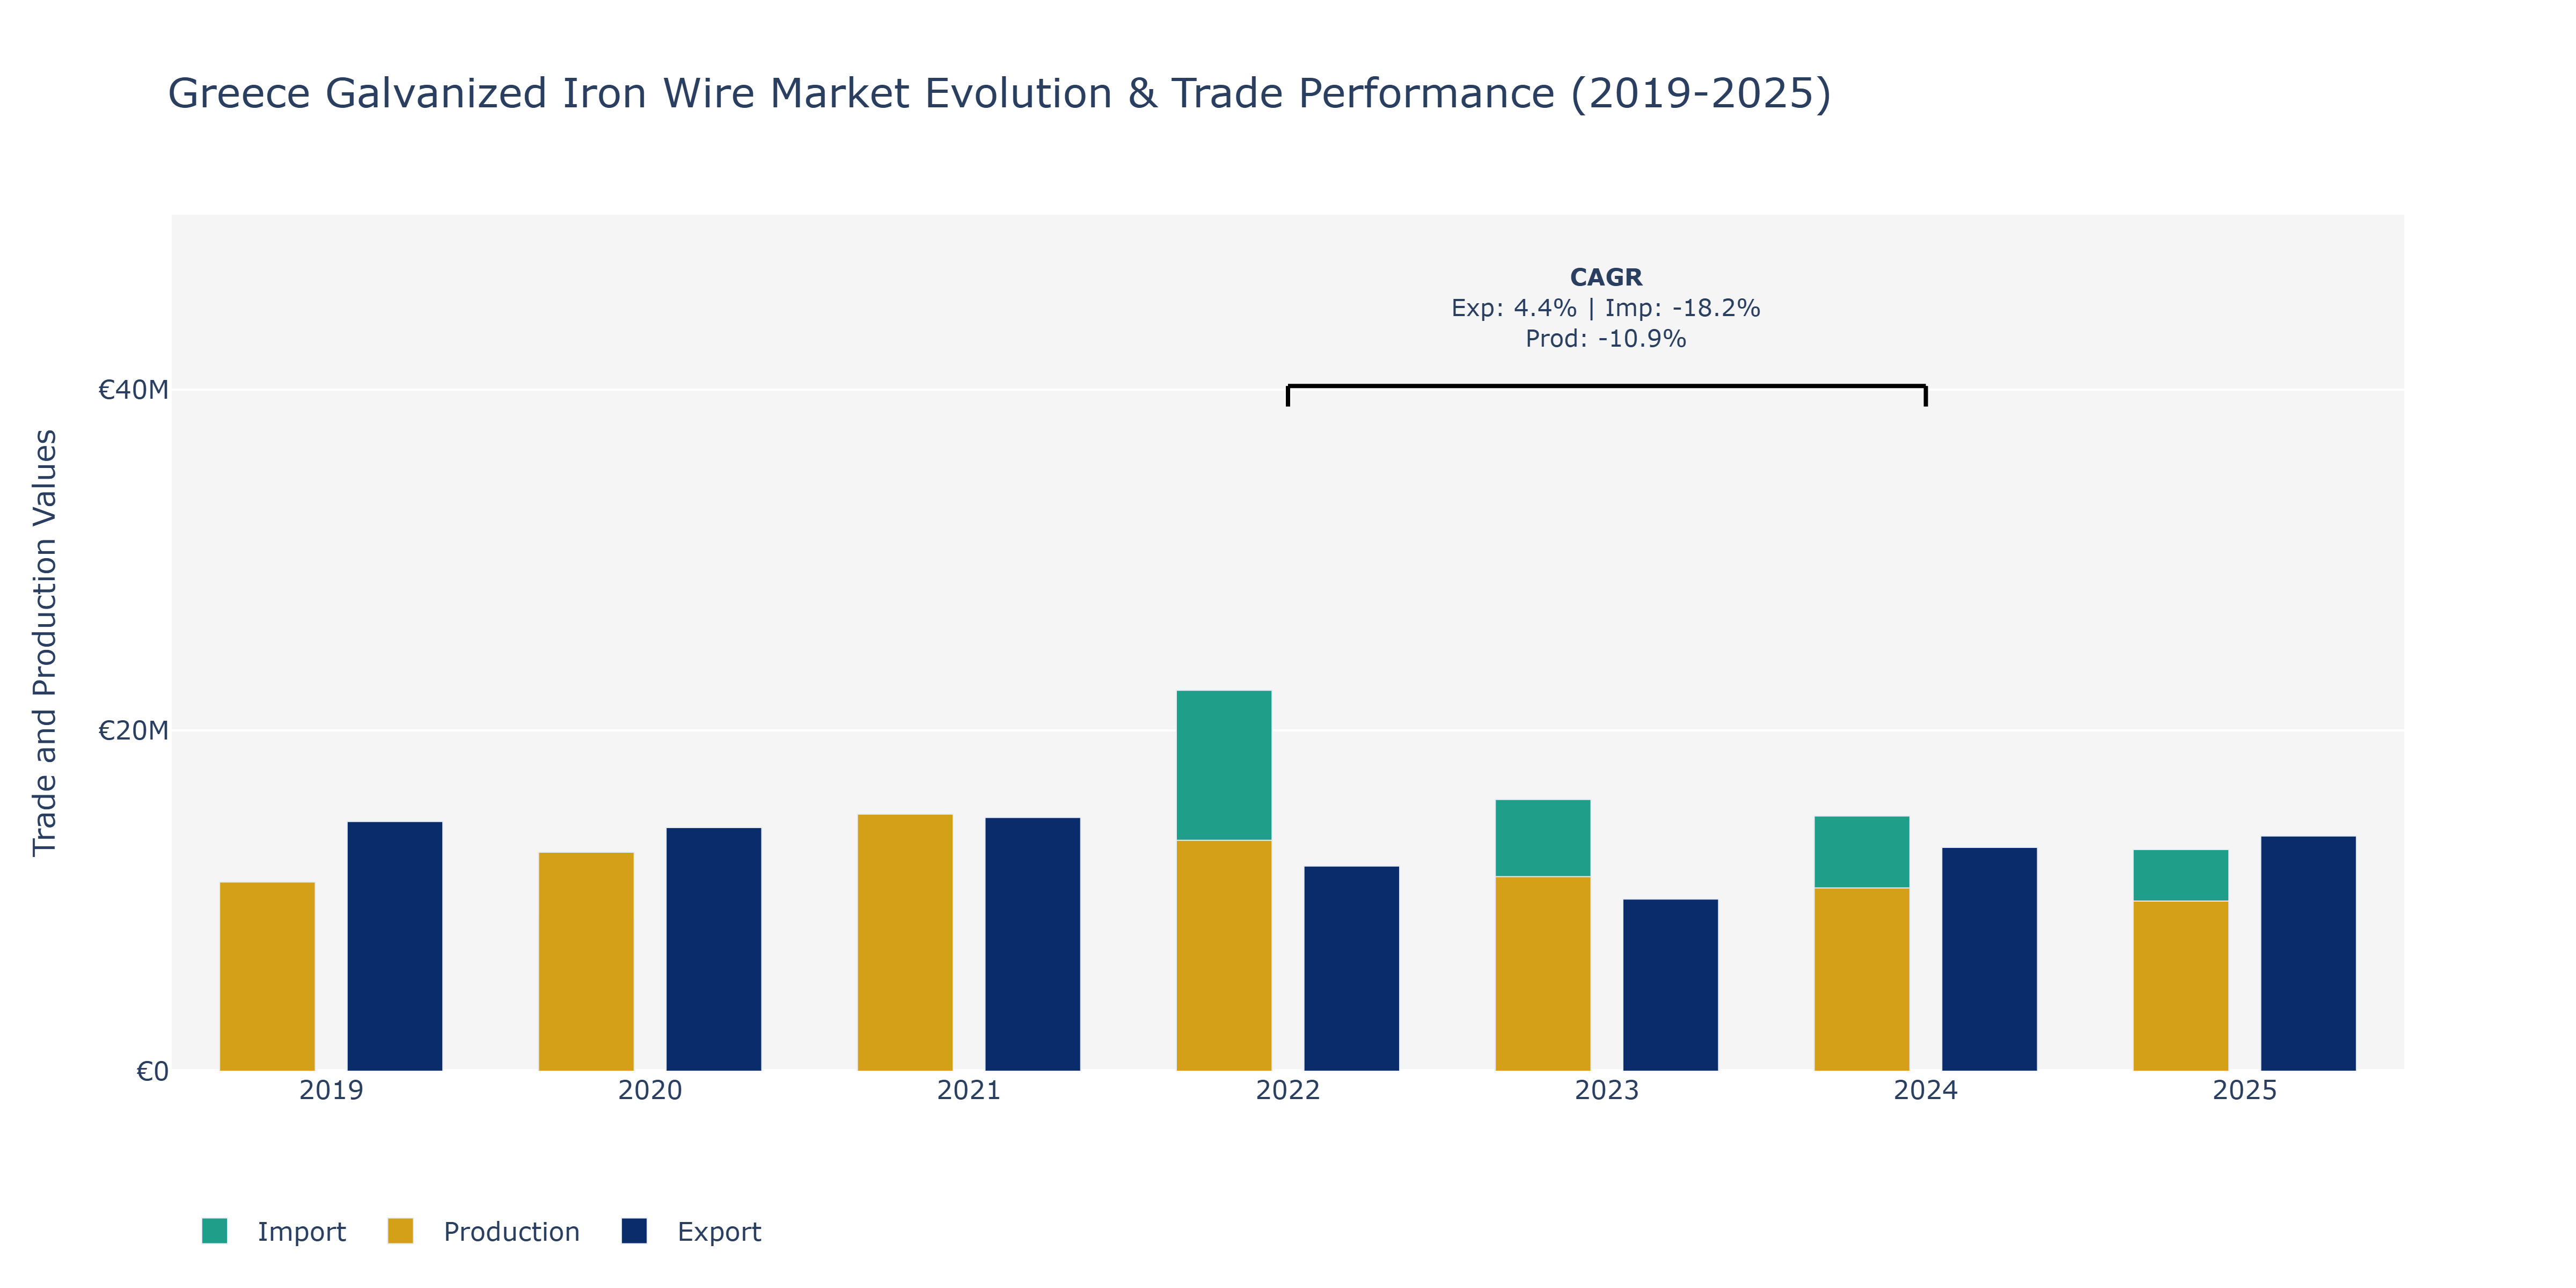
From 2019 to 2025, the Greece Galvanized Iron Wire Market experienced fluctuations in exports, imports, and production. In 2021, the market saw a peak in production at €15.08 billion, aligning with the positive trend in exports and imports. However, in 2022, there was a notable decline in exports to €12.04 billion, possibly due to changes in global demand or competitive pricing. Imports also peaked in 2021 at €13.01 billion, indicating strong market demand, but significantly dropped in 2022 to €22.35 billion. The decrease in production to €9.98 billion in 2025 could be attributed to supply chain disruptions or shifts in consumer preferences towards alternative materials. To mitigate the impact of declining exports and production, market players may need to focus on product innovation and diversification to capitalize on emerging opportunities in the industry.
Key Highlights of the Report:
- Greece Galvanized Iron Wire Market Outlook
- Market Size of Greece Galvanized Iron Wire Market, 2025
- Forecast of Greece Galvanized Iron Wire Market, 2032
- Historical Data and Forecast of Greece Galvanized Iron Wire Revenues & Volume for the Period 2022-2032F
- Greece Galvanized Iron Wire Market Trend Evolution
- Greece Galvanized Iron Wire Market Drivers and Challenges
- Greece Galvanized Iron Wire Price Trends
- Greece Galvanized Iron Wire Porter`s Five Forces
- Greece Galvanized Iron Wire Industry Life Cycle
- Historical Data and Forecast of Greece Galvanized Iron Wire Market Revenues & Volume By Product for the Period 2022-2032F
- Historical Data and Forecast of Greece Galvanized Iron Wire Market Revenues & Volume By Hot Galvanized Iron Wire for the Period 2022-2032F
- Historical Data and Forecast of Greece Galvanized Iron Wire Market Revenues & Volume By Cold Galvanized Iron Wire for the Period 2022-2032F
- Historical Data and Forecast of Greece Galvanized Iron Wire Market Revenues & Volume By Application for the Period 2022-2032F
- Historical Data and Forecast of Greece Galvanized Iron Wire Market Revenues & Volume By Building for the Period 2022-2032F
- Historical Data and Forecast of Greece Galvanized Iron Wire Market Revenues & Volume By Handicrafts for the Period 2022-2032F
- Historical Data and Forecast of Greece Galvanized Iron Wire Market Revenues & Volume By Weaving Screen for the Period 2022-2032F
- Historical Data and Forecast of Greece Galvanized Iron Wire Market Revenues & Volume By Wipe Wall Net for the Period 2022-2032F
- Historical Data and Forecast of Greece Galvanized Iron Wire Market Revenues & Volume By Highway Guardrail for the Period 2022-2032F
- Historical Data and Forecast of Greece Galvanized Iron Wire Market Revenues & Volume By Packaging for the Period 2022-2032F
- Historical Data and Forecast of Greece Galvanized Iron Wire Market Revenues & Volume By Daily Civilian Use for the Period 2022-2032F
- Historical Data and Forecast of Greece Galvanized Iron Wire Market Revenues & Volume By Others for the Period 2022-2032F
- Greece Galvanized Iron Wire Import Export Trade Statistics
- Market Opportunity Assessment By Product
- Market Opportunity Assessment By Application
- Greece Galvanized Iron Wire Top Companies Market Share
- Greece Galvanized Iron Wire Competitive Benchmarking By Technical and Operational Parameters
- Greece Galvanized Iron Wire Company Profiles
- Greece Galvanized Iron Wire Key Strategic Recommendations
Frequently Asked Questions About the Market Study (FAQs):
6Wresearch actively monitors the Greece Galvanized Iron Wire Market and publishes its comprehensive annual report, highlighting emerging trends, growth drivers, revenue analysis, and forecast outlook. Our insights help businesses to make data-backed strategic decisions with ongoing market dynamics. Our analysts track relevent industries related to the Greece Galvanized Iron Wire Market, allowing our clients with actionable intelligence and reliable forecasts tailored to emerging regional needs.
Yes, we provide customisation as per your requirements. To learn more, feel free to contact us on sales@6wresearch.com
1 Executive Summary |
2 Introduction |
2.1 Key Highlights of the Report |
2.2 Report Description |
2.3 Market Scope & Segmentation |
2.4 Research Methodology |
2.5 Assumptions |
3 Greece Galvanized Iron Wire Market Overview |
3.1 Greece Country Macro Economic Indicators |
3.2 Greece Galvanized Iron Wire Market Revenues & Volume, 2022 & 2032F |
3.3 Greece Galvanized Iron Wire Market - Industry Life Cycle |
3.4 Greece Galvanized Iron Wire Market - Porter's Five Forces |
3.5 Greece Galvanized Iron Wire Market Revenues & Volume Share, By Product, 2022 & 2032F |
3.6 Greece Galvanized Iron Wire Market Revenues & Volume Share, By Application, 2022 & 2032F |
4 Greece Galvanized Iron Wire Market Dynamics |
4.1 Impact Analysis |
4.2 Market Drivers |
4.2.1 Increasing construction activities in Greece |
4.2.2 Growing demand for durable and corrosion-resistant materials |
4.2.3 Rise in infrastructure development projects |
4.3 Market Restraints |
4.3.1 Fluctuating raw material prices |
4.3.2 Intense competition from alternative materials |
4.3.3 Economic instability affecting investment in construction projects |
5 Greece Galvanized Iron Wire Market Trends |
6 Greece Galvanized Iron Wire Market Segmentations |
6.1 Greece Galvanized Iron Wire Market, By Product |
6.1.1 Overview and Analysis |
6.1.2 Greece Galvanized Iron Wire Market Revenues & Volume, By Hot Galvanized Iron Wire, 2022-2032F |
6.1.3 Greece Galvanized Iron Wire Market Revenues & Volume, By Cold Galvanized Iron Wire, 2022-2032F |
6.2 Greece Galvanized Iron Wire Market, By Application |
6.2.1 Overview and Analysis |
6.2.2 Greece Galvanized Iron Wire Market Revenues & Volume, By Building, 2022-2032F |
6.2.3 Greece Galvanized Iron Wire Market Revenues & Volume, By Handicrafts, 2022-2032F |
6.2.4 Greece Galvanized Iron Wire Market Revenues & Volume, By Weaving Screen, 2022-2032F |
6.2.5 Greece Galvanized Iron Wire Market Revenues & Volume, By Wipe Wall Net, 2022-2032F |
6.2.6 Greece Galvanized Iron Wire Market Revenues & Volume, By Highway Guardrail, 2022-2032F |
6.2.7 Greece Galvanized Iron Wire Market Revenues & Volume, By Packaging, 2022-2032F |
6.2.8 Greece Galvanized Iron Wire Market Revenues & Volume, By Others, 2022-2032F |
6.2.9 Greece Galvanized Iron Wire Market Revenues & Volume, By Others, 2022-2032F |
7 Greece Galvanized Iron Wire Market Import-Export Trade Statistics |
7.1 Greece Galvanized Iron Wire Market Export to Major Countries |
7.2 Greece Galvanized Iron Wire Market Imports from Major Countries |
8 Greece Galvanized Iron Wire Market Key Performance Indicators |
8.1 Average selling price of galvanized iron wire |
8.2 Number of new construction permits issued |
8.3 Percentage of infrastructure budget allocated to galvanized iron wire procurement |
9 Greece Galvanized Iron Wire Market - Opportunity Assessment |
9.1 Greece Galvanized Iron Wire Market Opportunity Assessment, By Product, 2022 & 2032F |
9.2 Greece Galvanized Iron Wire Market Opportunity Assessment, By Application, 2022 & 2032F |
10 Greece Galvanized Iron Wire Market - Competitive Landscape |
10.1 Greece Galvanized Iron Wire Market Revenue Share, By Companies, 2025 |
10.2 Greece Galvanized Iron Wire Market Competitive Benchmarking, By Operating and Technical Parameters |
11 Company Profiles |
12 Recommendations | 13 Disclaimer |
Global Go To Market Strategy - 2030
Export potential enables firms to identify high-growth global markets with greater confidence by combining advanced trade intelligence with a structured quantitative methodology. The framework analyzes emerging demand trends and country-level import patterns while integrating macroeconomic and trade datasets such as GDP and population forecasts, bilateral import–export flows, tariff structures, elasticity differentials between developed and developing economies, geographic distance, and import demand projections. Using weighted trade values from 2020–2024 as the base period to project country-to-country export potential for 2030, these inputs are operationalized through calculated drivers such as gravity model parameters, tariff impact factors, and projected GDP per-capita growth. Through an analysis of hidden potentials, demand hotspots, and market conditions that are most favorable to success, this method enables firms to focus on target countries, maximize returns, and global expansion with data, backed by accuracy.
By factoring in the projected importer demand gap that is currently unmet and could be potential opportunity, it identifies the potential for the Exporter (Country) among 190 countries, against the general trade analysis, which identifies the biggest importer or exporter.
To discover high-growth global markets and optimize your business strategy:
Click Here
Pricing
- Single User License$ 1,995
- Department License$ 2,400
- Site License$ 3,120
- Global License$ 3,795

Leadership Perspectives from Industry Events
Search
Thought Leadership and Analyst Meet


Our Clients
6WResearch In News
- Doha a strategic location for EV manufacturing hub: IPA Qatar
- Demand for luxury TVs surging in the GCC, says Samsung
- Empowering Growth: The Thriving Journey of Bangladesh’s Cable Industry
- Demand for luxury TVs surging in the GCC, says Samsung
- Video call with a traditional healer? Once unthinkable, it’s now common in South Africa
- Intelligent Buildings To Smooth GCC’s Path To Net Zero
Latest Reports
- Taiwan Airport Wireless Infrastructure Market (2026-2032)
- Vietnam Airport Wireless Infrastructure Market (2026-2032)
- Thailand Airport Wireless Infrastructure Market (2026-2032)
- South Korea Airport Wireless Infrastructure Market (2026-2032)
- Romania Airport Wireless Infrastructure Market (2026-2032)
- Qatar Airport Wireless Infrastructure Market (2026-2032)
- Philippines Airport Wireless Infrastructure Market (2026-2032)
- Japan Airport Wireless Infrastructure Market (2026-2032)
- Taiwan Airport Winter Services Market (2026-2032)
- Vietnam Airport Winter Services Market (2026-2032)
Industry Events and Analyst Meet

HIMTEX 2026

India Refining Summit 2026

India EV Show 2026

EV tech India Expo 2026

Auto Tech Asia 2026
Whitepaper
- Middle East & Africa Commercial Security Market Click here to view more.
- Middle East & Africa Fire Safety Systems & Equipment Market Click here to view more.
- GCC Drone Market Click here to view more.
- Middle East Lighting Fixture Market Click here to view more.
- GCC Physical & Perimeter Security Market Click here to view more.