Greece Nano Gold Market (2026-2032) | Forecast, Pricing Analysis, Drivers, Segments, Supply, Share, Value, Outlook, Restraints, Strategic Insights, Analysis, Challenges, Segmentation, Companies, Competitive, Industry, Opportunities, Consumer Insights, Growth, Size, Strategy, Trends, Investment Trends, Revenue, Competition, Demand
Market Forecast By Form (Nanoparticles, Colloidal Gold, Nano Gold Wires, Nano Gold Films, Hybrid Nano Gold), By Application (Drug Delivery, Diagnostics, Electronics, Catalysis, Cosmetics), By Particle Size (Below 10 nm, 10-50 nm, 50-100 nm, Above 100 nm, Custom Size), By Function (Targeted Therapy, Imaging Contrast, Conductivity, Catalytic Activity, Anti-Aging), By Technology (Biofunctionalization, Surface Plasmon Resonance, Nano-Interconnects, Thin-Film Deposition, Biocompatible Coatings) And Competitive Landscape
| Product Code: ETC12964965 | Publication Date: Apr 2025 | Updated Date: Apr 2026 | Product Type: Market Research Report | |
| Publisher: 6Wresearch | No. of Pages: 65 | No. of Figures: 34 | No. of Tables: 19 | |
Greece Nano Gold Market Size (2020-2030)
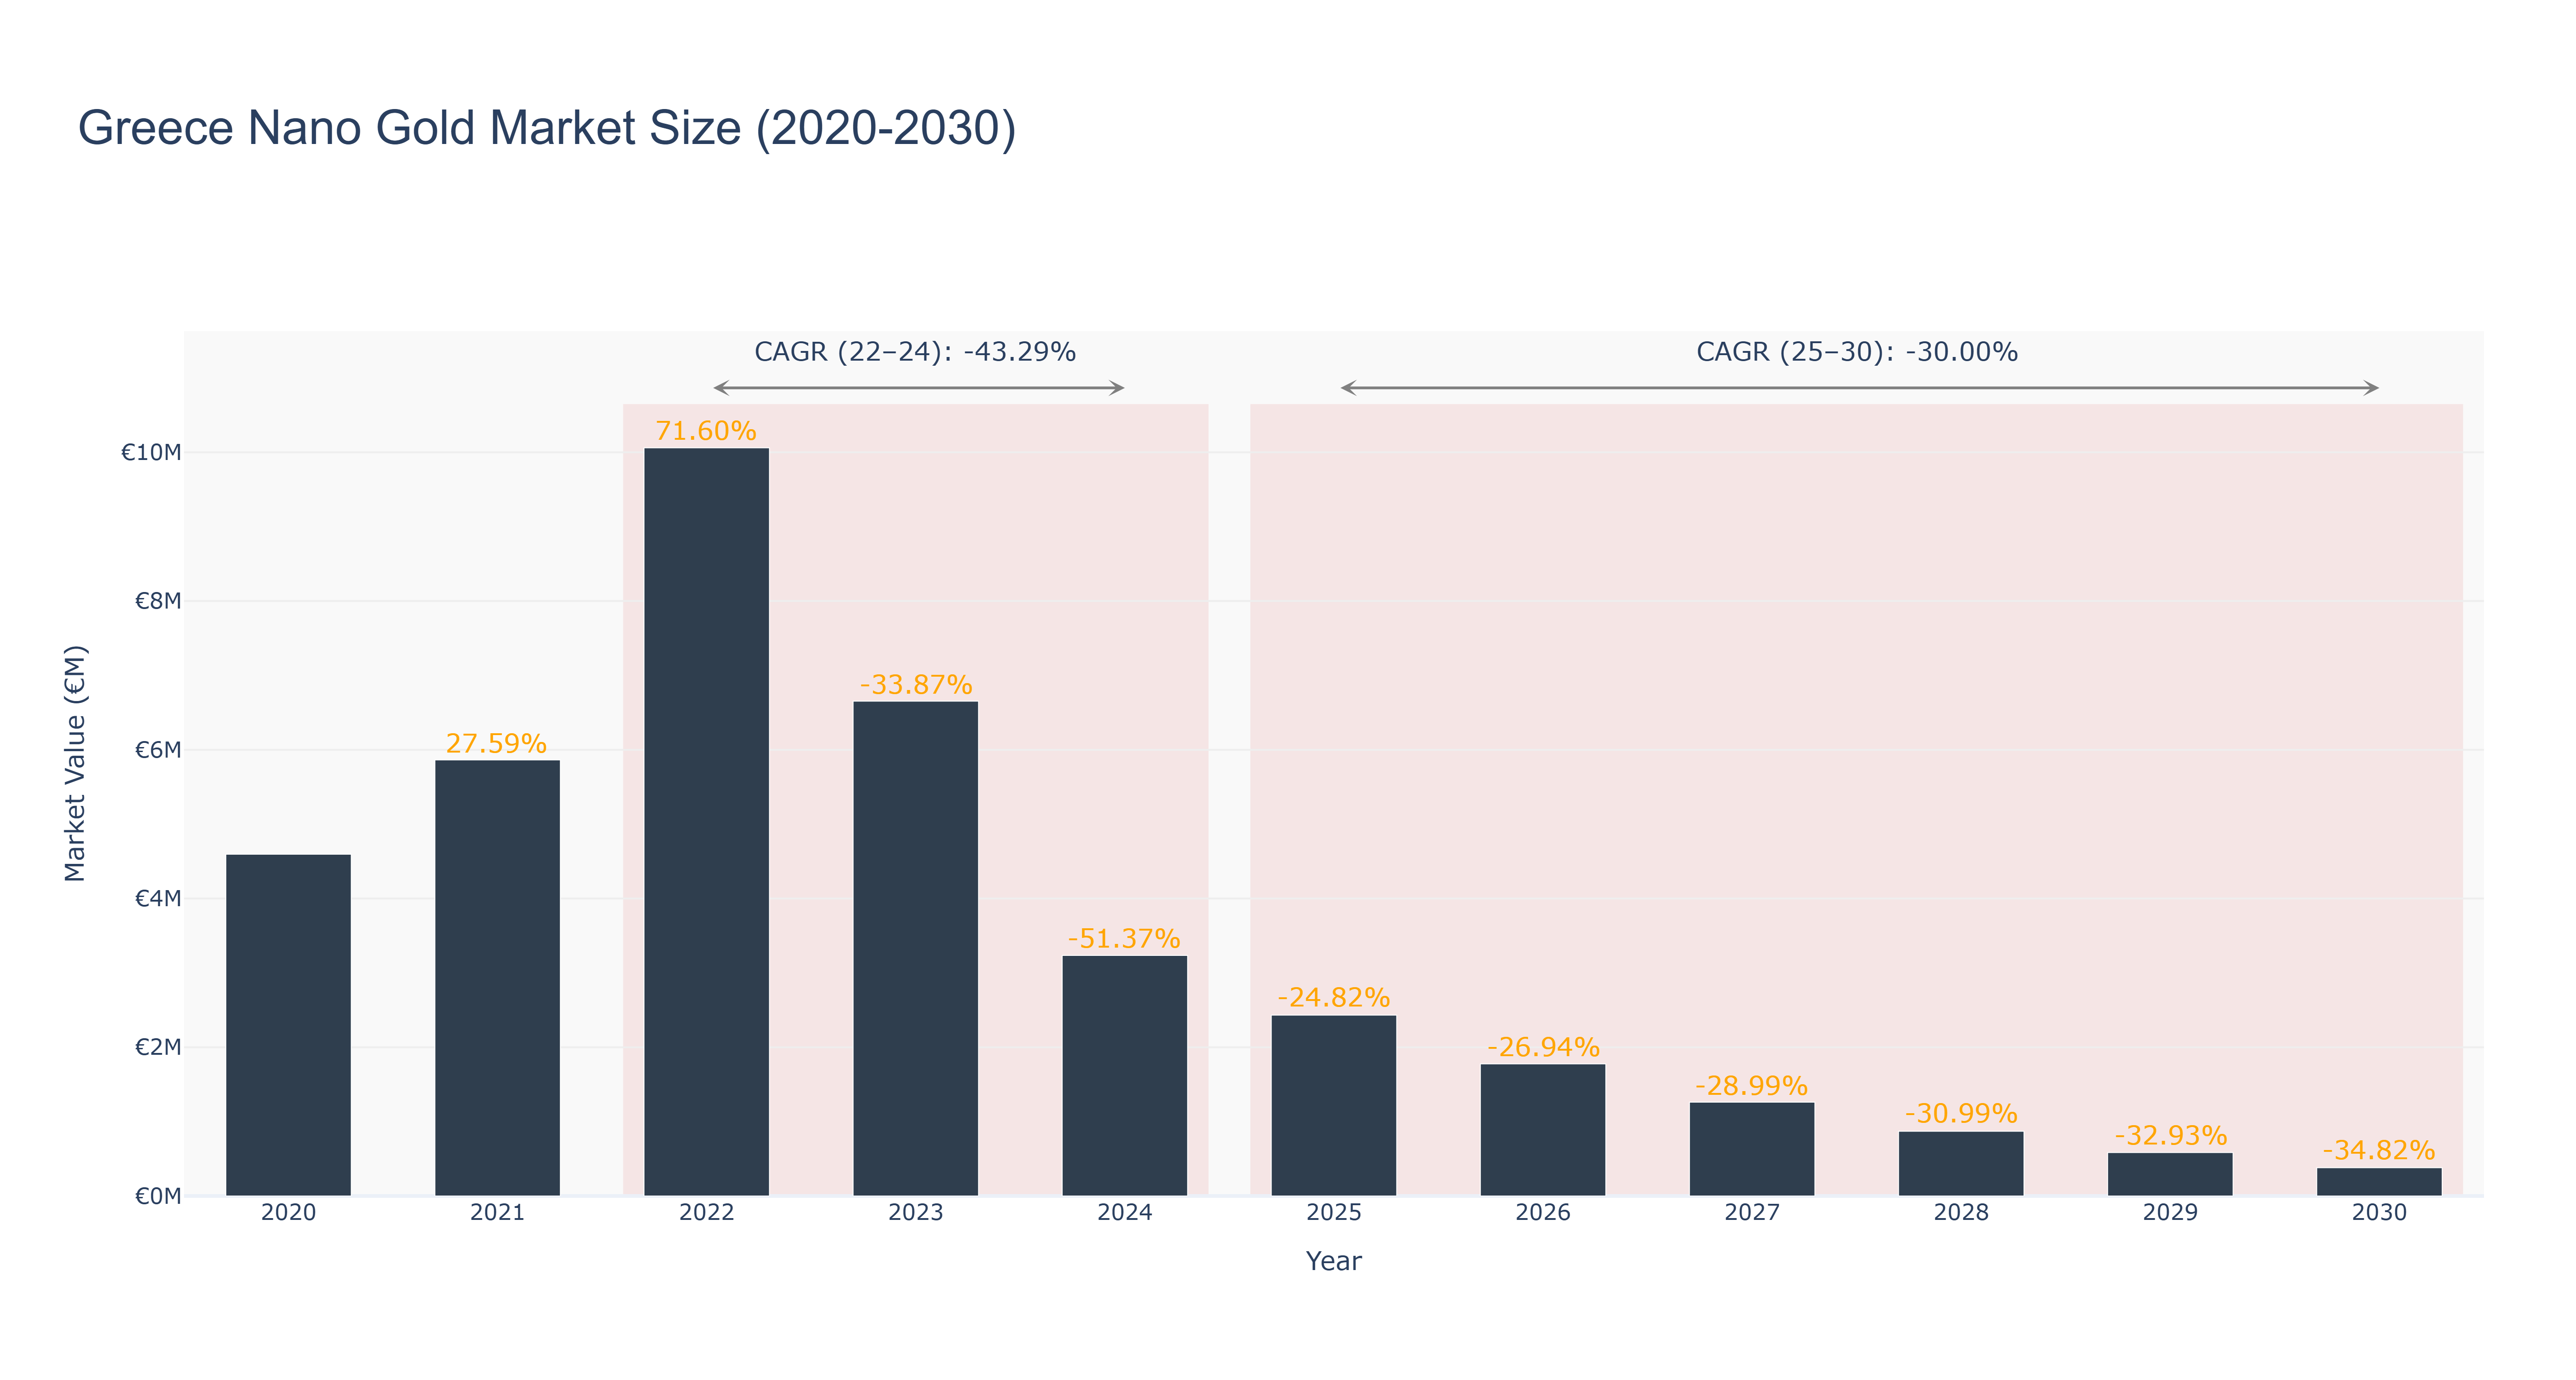
The Greece Nano Gold Market experienced a fluctuating trend over the past decade. The market peaked at €10.06 million in 2022, followed by a sharp decline to €1.26 million in 2027. The market is forecasted to further decrease to €0.38 million by 2030, with a CAGR of -30.0% from 2025 to 2030. The significant downturn in market size can be attributed to various factors such as changing consumer preferences, economic instability, and technological advancements impacting the demand for nano gold products. Despite the current challenges, upcoming initiatives in sustainable sourcing practices and innovative product development are expected to drive market recovery and growth in the near future. Continued focus on research and development, coupled with strategic marketing efforts, will be crucial in revitalizing the Greece Nano Gold Market.
Greece Nano Gold Market: Production & Trade Performance (2019-2025)
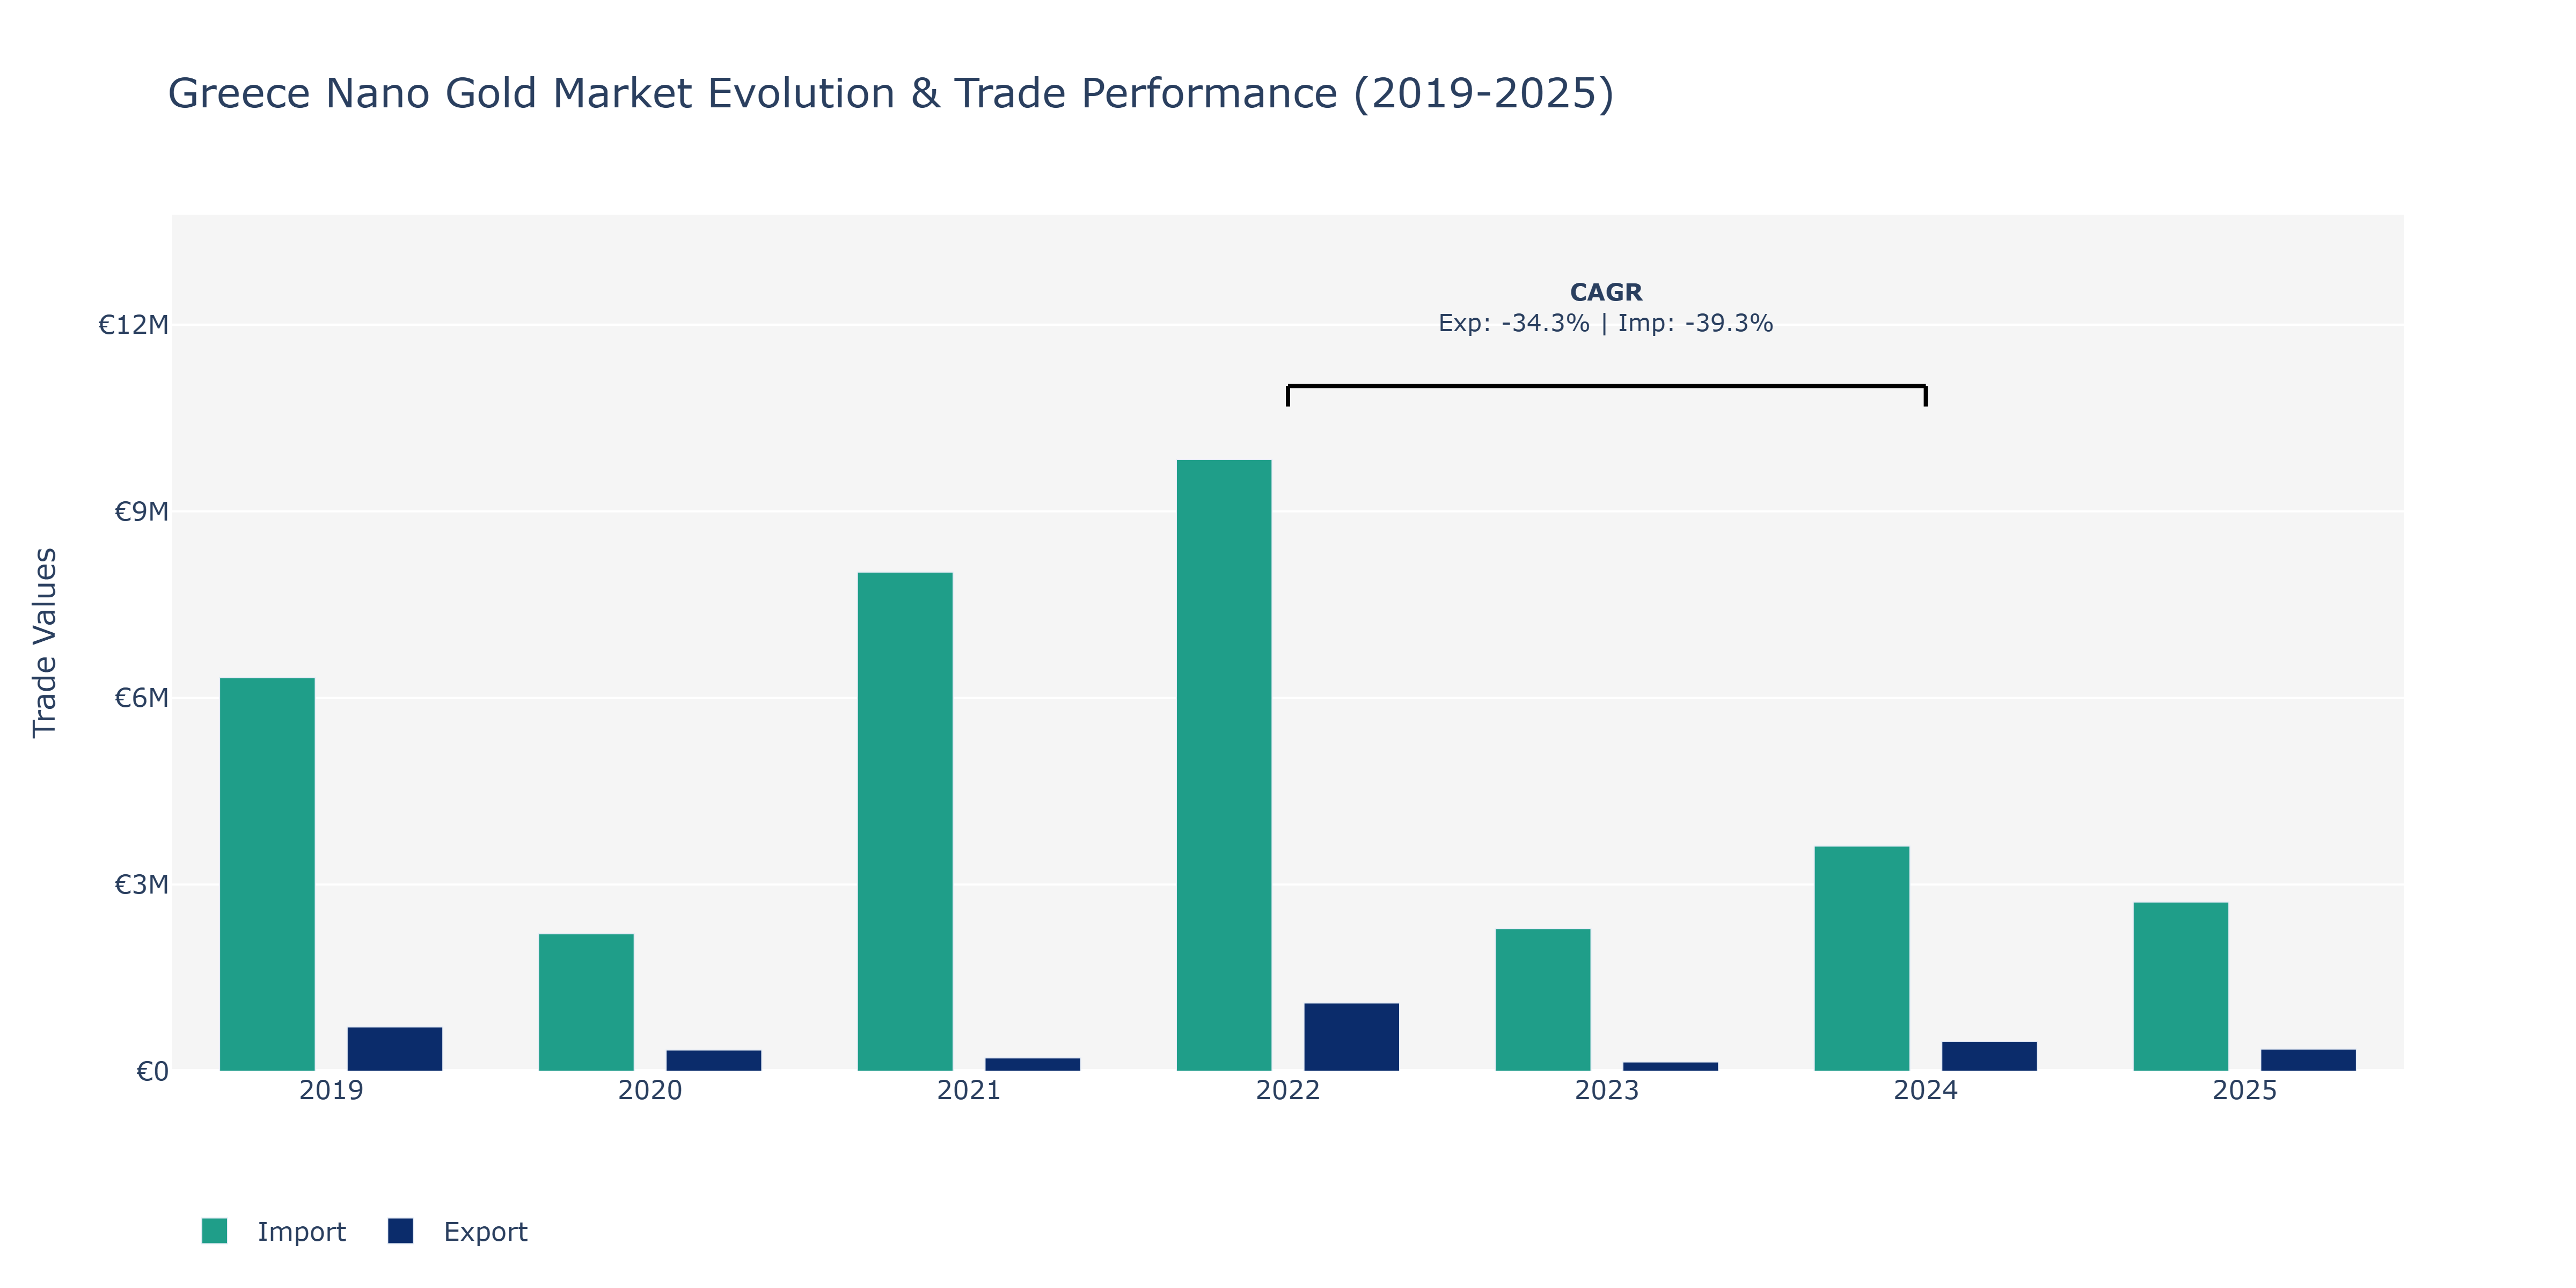
The Greece Nano Gold Market witnessed fluctuating trends in both Exports and Imports from 2019 to 2025. In 2019, Imports stood at €6.33 million, surpassing Exports at €712.43 thousand. However, by 2020, Exports decreased to €340.45 thousand, while Imports reduced to €2.21 million. A notable shift occurred in 2021 when Exports further declined to €212.97 thousand, contrasting with a significant rise in Imports to €8.02 million. The peak point for Exports was observed in 2022 at €1.1 million, whereas Imports peaked at €9.84 million in the same year. In 2023, Exports sharply dropped to €148.64 thousand, while Imports decreased to €2.29 million. Subsequently, both Exports and Imports experienced a moderate recovery in 2024, reaching €474.57 thousand and €3.62 million, respectively. By 2025, Exports slightly decreased to around €356.76 thousand, whereas Imports remained relatively stable at about €2.72 million. The market's dynamics can be attributed to several factors, including global economic conditions, demand fluctuations, and regulatory changes impacting the Nano Gold industry in Greece. The fluctuating trends reflect the market's sensitivity to external factors and the importance of strategic planning to navigate uncertainties in international trade and supply chain disruptions.
Key Highlights of the Report:
- Greece Nano Gold Market Outlook
- Market Size of Greece Nano Gold Market, 2025
- Forecast of Greece Nano Gold Market, 2032
- Historical Data and Forecast of Greece Nano Gold Revenues & Volume for the Period 2022-2032F
- Greece Nano Gold Market Trend Evolution
- Greece Nano Gold Market Drivers and Challenges
- Greece Nano Gold Price Trends
- Greece Nano Gold Porter's Five Forces
- Greece Nano Gold Industry Life Cycle
- Historical Data and Forecast of Greece Nano Gold Market Revenues & Volume By Form for the Period 2022-2032F
- Historical Data and Forecast of Greece Nano Gold Market Revenues & Volume By Nanoparticles for the Period 2022-2032F
- Historical Data and Forecast of Greece Nano Gold Market Revenues & Volume By Colloidal Gold for the Period 2022-2032F
- Historical Data and Forecast of Greece Nano Gold Market Revenues & Volume By Nano Gold Wires for the Period 2022-2032F
- Historical Data and Forecast of Greece Nano Gold Market Revenues & Volume By Nano Gold Films for the Period 2022-2032F
- Historical Data and Forecast of Greece Nano Gold Market Revenues & Volume By Hybrid Nano Gold for the Period 2022 - 2032F
- Historical Data and Forecast of Greece Nano Gold Market Revenues & Volume By Application for the Period 2022-2032F
- Historical Data and Forecast of Greece Nano Gold Market Revenues & Volume By Drug Delivery for the Period 2022-2032F
- Historical Data and Forecast of Greece Nano Gold Market Revenues & Volume By Diagnostics for the Period 2022-2032F
- Historical Data and Forecast of Greece Nano Gold Market Revenues & Volume By Electronics for the Period 2022-2032F
- Historical Data and Forecast of Greece Nano Gold Market Revenues & Volume By Catalysis for the Period 2022-2032F
- Historical Data and Forecast of Greece Nano Gold Market Revenues & Volume By Cosmetics for the Period 2022 - 2032F
- Historical Data and Forecast of Greece Nano Gold Market Revenues & Volume By Particle Size for the Period 2022-2032F
- Historical Data and Forecast of Greece Nano Gold Market Revenues & Volume By Below 10 nm for the Period 2022-2032F
- Historical Data and Forecast of Greece Nano Gold Market Revenues & Volume By 10-50 nm for the Period 2022-2032F
- Historical Data and Forecast of Greece Nano Gold Market Revenues & Volume By 50-100 nm for the Period 2022-2032F
- Historical Data and Forecast of Greece Nano Gold Market Revenues & Volume By Above 100 nm for the Period 2022-2032F
- Historical Data and Forecast of Greece Nano Gold Market Revenues & Volume By Custom Size for the Period 2022 - 2032F
- Historical Data and Forecast of Greece Nano Gold Market Revenues & Volume By Function for the Period 2022-2032F
- Historical Data and Forecast of Greece Nano Gold Market Revenues & Volume By Targeted Therapy for the Period 2022-2032F
- Historical Data and Forecast of Greece Nano Gold Market Revenues & Volume By Imaging Contrast for the Period 2022-2032F
- Historical Data and Forecast of Greece Nano Gold Market Revenues & Volume By Conductivity for the Period 2022-2032F
- Historical Data and Forecast of Greece Nano Gold Market Revenues & Volume By Catalytic Activity for the Period 2022-2032F
- Historical Data and Forecast of Greece Nano Gold Market Revenues & Volume By Anti-Aging for the Period 2022 - 2032F
- Historical Data and Forecast of Greece Nano Gold Market Revenues & Volume By Technology for the Period 2022-2032F
- Historical Data and Forecast of Greece Nano Gold Market Revenues & Volume By Biofunctionalization for the Period 2022-2032F
- Historical Data and Forecast of Greece Nano Gold Market Revenues & Volume By Surface Plasmon Resonance for the Period 2022-2032F
- Historical Data and Forecast of Greece Nano Gold Market Revenues & Volume By Nano-Interconnects for the Period 2022-2032F
- Historical Data and Forecast of Greece Nano Gold Market Revenues & Volume By Thin-Film Deposition for the Period 2022 - 2032F
- Historical Data and Forecast of Greece Nano Gold Market Revenues & Volume By Biocompatible Coatings for the Period 2022 - 2032F
- Greece Nano Gold Import Export Trade Statistics
- Market Opportunity Assessment By Form
- Market Opportunity Assessment By Application
- Market Opportunity Assessment By Particle Size
- Market Opportunity Assessment By Function
- Market Opportunity Assessment By Technology
- Greece Nano Gold Top Companies Market Share
- Greece Nano Gold Competitive Benchmarking By Technical and Operational Parameters
- Greece Nano Gold Company Profiles
- Greece Nano Gold Key Strategic Recommendations
Frequently Asked Questions About the Market Study (FAQs):
6Wresearch actively monitors the Greece Nano Gold Market and publishes its comprehensive annual report, highlighting emerging trends, growth drivers, revenue analysis, and forecast outlook. Our insights help businesses to make data-backed strategic decisions with ongoing market dynamics. Our analysts track relevent industries related to the Greece Nano Gold Market, allowing our clients with actionable intelligence and reliable forecasts tailored to emerging regional needs.
Yes, we provide customisation as per your requirements. To learn more, feel free to contact us on sales@6wresearch.com
1 Executive Summary |
2 Introduction |
2.1 Key Highlights of the Report |
2.2 Report Description |
2.3 Market Scope & Segmentation |
2.4 Research Methodology |
2.5 Assumptions |
3 Greece Nano Gold Market Overview |
3.1 Greece Country Macro Economic Indicators |
3.2 Greece Nano Gold Market Revenues & Volume, 2022 & 2032F |
3.3 Greece Nano Gold Market - Industry Life Cycle |
3.4 Greece Nano Gold Market - Porter's Five Forces |
3.5 Greece Nano Gold Market Revenues & Volume Share, By Form, 2022 & 2032F |
3.6 Greece Nano Gold Market Revenues & Volume Share, By Application, 2022 & 2032F |
3.7 Greece Nano Gold Market Revenues & Volume Share, By Particle Size, 2022 & 2032F |
3.8 Greece Nano Gold Market Revenues & Volume Share, By Function, 2022 & 2032F |
3.9 Greece Nano Gold Market Revenues & Volume Share, By Technology, 2022 & 2032F |
4 Greece Nano Gold Market Dynamics |
4.1 Impact Analysis |
4.2 Market Drivers |
4.2.1 Increasing consumer awareness about the benefits of nano gold in skincare products |
4.2.2 Growing demand for natural and organic ingredients in beauty and personal care products |
4.2.3 Rising disposable income and changing lifestyle preferences in Greece |
4.3 Market Restraints |
4.3.1 High production costs associated with nano gold extraction and formulation |
4.3.2 Stringent regulations and certifications required for the use of nano gold in cosmetics |
4.3.3 Limited availability of skilled workforce for research and development in nano gold applications |
5 Greece Nano Gold Market Trends |
6 Greece Nano Gold Market, By Types |
6.1 Greece Nano Gold Market, By Form |
6.1.1 Overview and Analysis |
6.1.2 Greece Nano Gold Market Revenues & Volume, By Form, 2022 - 2032F |
6.1.3 Greece Nano Gold Market Revenues & Volume, By Nanoparticles, 2022 - 2032F |
6.1.4 Greece Nano Gold Market Revenues & Volume, By Colloidal Gold, 2022 - 2032F |
6.1.5 Greece Nano Gold Market Revenues & Volume, By Nano Gold Wires, 2022 - 2032F |
6.1.6 Greece Nano Gold Market Revenues & Volume, By Nano Gold Films, 2022 - 2032F |
6.1.7 Greece Nano Gold Market Revenues & Volume, By Hybrid Nano Gold, 2022 - 2032F |
6.2 Greece Nano Gold Market, By Application |
6.2.1 Overview and Analysis |
6.2.2 Greece Nano Gold Market Revenues & Volume, By Drug Delivery, 2022 - 2032F |
6.2.3 Greece Nano Gold Market Revenues & Volume, By Diagnostics, 2022 - 2032F |
6.2.4 Greece Nano Gold Market Revenues & Volume, By Electronics, 2022 - 2032F |
6.2.5 Greece Nano Gold Market Revenues & Volume, By Catalysis, 2022 - 2032F |
6.2.6 Greece Nano Gold Market Revenues & Volume, By Cosmetics, 2022 - 2032F |
6.3 Greece Nano Gold Market, By Particle Size |
6.3.1 Overview and Analysis |
6.3.2 Greece Nano Gold Market Revenues & Volume, By Below 10 nm, 2022 - 2032F |
6.3.3 Greece Nano Gold Market Revenues & Volume, By 10-50 nm, 2022 - 2032F |
6.3.4 Greece Nano Gold Market Revenues & Volume, By 50-100 nm, 2022 - 2032F |
6.3.5 Greece Nano Gold Market Revenues & Volume, By Above 100 nm, 2022 - 2032F |
6.3.6 Greece Nano Gold Market Revenues & Volume, By Custom Size, 2022 - 2032F |
6.4 Greece Nano Gold Market, By Function |
6.4.1 Overview and Analysis |
6.4.2 Greece Nano Gold Market Revenues & Volume, By Targeted Therapy, 2022 - 2032F |
6.4.3 Greece Nano Gold Market Revenues & Volume, By Imaging Contrast, 2022 - 2032F |
6.4.4 Greece Nano Gold Market Revenues & Volume, By Conductivity, 2022 - 2032F |
6.4.5 Greece Nano Gold Market Revenues & Volume, By Catalytic Activity, 2022 - 2032F |
6.4.6 Greece Nano Gold Market Revenues & Volume, By Anti-Aging, 2022 - 2032F |
6.5 Greece Nano Gold Market, By Technology |
6.5.1 Overview and Analysis |
6.5.2 Greece Nano Gold Market Revenues & Volume, By Biofunctionalization, 2022 - 2032F |
6.5.3 Greece Nano Gold Market Revenues & Volume, By Surface Plasmon Resonance, 2022 - 2032F |
6.5.4 Greece Nano Gold Market Revenues & Volume, By Nano-Interconnects, 2022 - 2032F |
6.5.5 Greece Nano Gold Market Revenues & Volume, By Thin-Film Deposition, 2022 - 2032F |
6.5.6 Greece Nano Gold Market Revenues & Volume, By Biocompatible Coatings, 2022 - 2032F |
7 Greece Nano Gold Market Import-Export Trade Statistics |
7.1 Greece Nano Gold Market Export to Major Countries |
7.2 Greece Nano Gold Market Imports from Major Countries |
8 Greece Nano Gold Market Key Performance Indicators |
8.1 Research and development investment in nano gold technology |
8.2 Number of new product launches containing nano gold |
8.3 Growth in partnerships and collaborations between cosmetic companies and nano gold suppliers |
8.4 Consumer satisfaction and perception surveys regarding nano gold products |
8.5 Adoption rate of nano gold in various beauty and personal care product categories |
9 Greece Nano Gold Market - Opportunity Assessment |
9.1 Greece Nano Gold Market Opportunity Assessment, By Form, 2022 & 2032F |
9.2 Greece Nano Gold Market Opportunity Assessment, By Application, 2022 & 2032F |
9.3 Greece Nano Gold Market Opportunity Assessment, By Particle Size, 2022 & 2032F |
9.4 Greece Nano Gold Market Opportunity Assessment, By Function, 2022 & 2032F |
9.5 Greece Nano Gold Market Opportunity Assessment, By Technology, 2022 & 2032F |
10 Greece Nano Gold Market - Competitive Landscape |
10.1 Greece Nano Gold Market Revenue Share, By Companies, 2025 |
10.2 Greece Nano Gold Market Competitive Benchmarking, By Operating and Technical Parameters |
11 Company Profiles |
12 Recommendations |
13 Disclaimer |
Export potential assessment - trade Analytics for 2030
Export potential enables firms to identify high-growth global markets with greater confidence by combining advanced trade intelligence with a structured quantitative methodology. The framework analyzes emerging demand trends and country-level import patterns while integrating macroeconomic and trade datasets such as GDP and population forecasts, bilateral import–export flows, tariff structures, elasticity differentials between developed and developing economies, geographic distance, and import demand projections. Using weighted trade values from 2020–2024 as the base period to project country-to-country export potential for 2030, these inputs are operationalized through calculated drivers such as gravity model parameters, tariff impact factors, and projected GDP per-capita growth. Through an analysis of hidden potentials, demand hotspots, and market conditions that are most favorable to success, this method enables firms to focus on target countries, maximize returns, and global expansion with data, backed by accuracy.
By factoring in the projected importer demand gap that is currently unmet and could be potential opportunity, it identifies the potential for the Exporter (Country) among 190 countries, against the general trade analysis, which identifies the biggest importer or exporter.
To discover high-growth global markets and optimize your business strategy:
Click Here
Pricing
- Single User License$ 1,995
- Department License$ 2,400
- Site License$ 3,120
- Global License$ 3,795

Search
Thought Leadership and Analyst Meet


Our Clients
Latest Reports
- Canada Cloud CFD Market (2026-2032) | Size & Revenue, Industry, Growth, Competitive Landscape, Forecast, Segmentation, Value, Outlook, Trends, Share, Analysis, Companies
- Taiwan Food Delivery Platform Market (2026-2032) | Companies, Outlook, Analysis, Trends, Value, Revenue, Segmentation, Share, Forecast, Competitive Landscape, Growth, Size & Forecast
- United Kingdom (UK) Long-term Care Insurance Market (2026-2032) | Growth, Share, Consumer Insights, Drivers, Opportunities, Competition, Pricing Analysis, Segments, Restraints, Companies, Competitive, Value, Outlook, Size, Demand, Analysis, Challenges, Strategic Insights, Investment Trends, Revenue, Trends, Supply, Forecast
- United Kingdom (UK) Long Term Care Market (2026-2032) | Companies, Outlook, Analysis, Trends, Value, Revenue, Segmentation, Share, Forecast, Competitive Landscape, Growth, Size & Forecast
- Iraq Insulation and Waterproofing Market (2026-2032) | Outlook, Drivers, Growth, Size, Share, Industry, Revenue, Trends, Demand, Competitive, Strategic Insights, Opportunities, Segments, Companies, Challenges, Strategy, Consumer Insights, Analysis, Investment Trends, Value, Segmentation, Forecast, Restraints
- India Switchgear Market Outlook (2026-2032) | Size, Share, Trends, Growth, Revenue, Forecast, Analysis, Value, Outlook
- Pakistan Contraceptive Implants Market (2025-2031) | Demand, Growth, Size, Share, Industry, Pricing Analysis, Competitive, Strategic Insights, Strategy, Consumer Insights, Analysis, Investment Trends, Opportunities, Revenue, Segments, Value, Segmentation, Supply, Forecast, Restraints, Outlook, Competition, Drivers, Trends, Companies, Challenges
- Sri Lanka Packaging Market (2026-2032) | Outlook, Competition, Drivers, Trends, Demand, Pricing Analysis, Competitive, Strategic Insights, Companies, Challenges, Strategy, Consumer Insights, Analysis, Investment Trends, Opportunities, Growth, Size, Share, Industry, Revenue, Segments, Value, Segmentation, Supply, Forecast, Restraints
- India Kids Watches Market (2026-2032) | Strategy, Consumer Insights, Analysis, Investment Trends, Opportunities, Growth, Size, Share, Industry, Revenue, Segments, Value, Segmentation, Supply, Forecast, Restraints, Outlook, Competition, Drivers, Trends, Demand, Pricing Analysis, Competitive, Strategic Insights, Companies, Challenges
- Saudi Arabia Core Assurance Service Market (2025-2031) | Strategy, Consumer Insights, Analysis, Investment Trends, Opportunities, Growth, Size, Share, Industry, Revenue, Segments, Value, Segmentation, Supply, Forecast, Restraints, Outlook, Competition, Drivers, Trends, Demand, Pricing Analysis, Competitive, Strategic Insights, Companies, Challenges
Industry Events and Analyst Meet

India EV Show 2026

EV tech India Expo 2026

Auto Tech Asia 2026

Battery Tech India 2026

Smart Production Solutions Guangzhou 2026
Whitepaper
- Middle East & Africa Commercial Security Market Click here to view more.
- Middle East & Africa Fire Safety Systems & Equipment Market Click here to view more.
- GCC Drone Market Click here to view more.
- Middle East Lighting Fixture Market Click here to view more.
- GCC Physical & Perimeter Security Market Click here to view more.
6WResearch In News
- Doha a strategic location for EV manufacturing hub: IPA Qatar
- Demand for luxury TVs surging in the GCC, says Samsung
- Empowering Growth: The Thriving Journey of Bangladesh’s Cable Industry
- Demand for luxury TVs surging in the GCC, says Samsung
- Video call with a traditional healer? Once unthinkable, it’s now common in South Africa
- Intelligent Buildings To Smooth GCC’s Path To Net Zero