Greece Potassium sulphate Market (2026-2032) | Size, Value, Companies, Outlook, Share, Industry, Trends, Segmentation, Analysis, Forecast, Revenue & Growth
Market Forecast By Form (Solid, Liquid), By Process (Mannheim Process, Sulphate Salts Reaction, Brine Processing, Others), By End-users (Agriculture, Industrial, Pharmaceuticals, Cosmetics, Food & Beverages, Others) And Competitive Landscape
| Product Code: ETC4703982 | Publication Date: Nov 2023 | Updated Date: Mar 2026 | Product Type: Market Research Report | |
| Publisher: 6Wresearch | Author: Shubham Deep | No. of Pages: 60 | No. of Figures: 30 | No. of Tables: 5 |
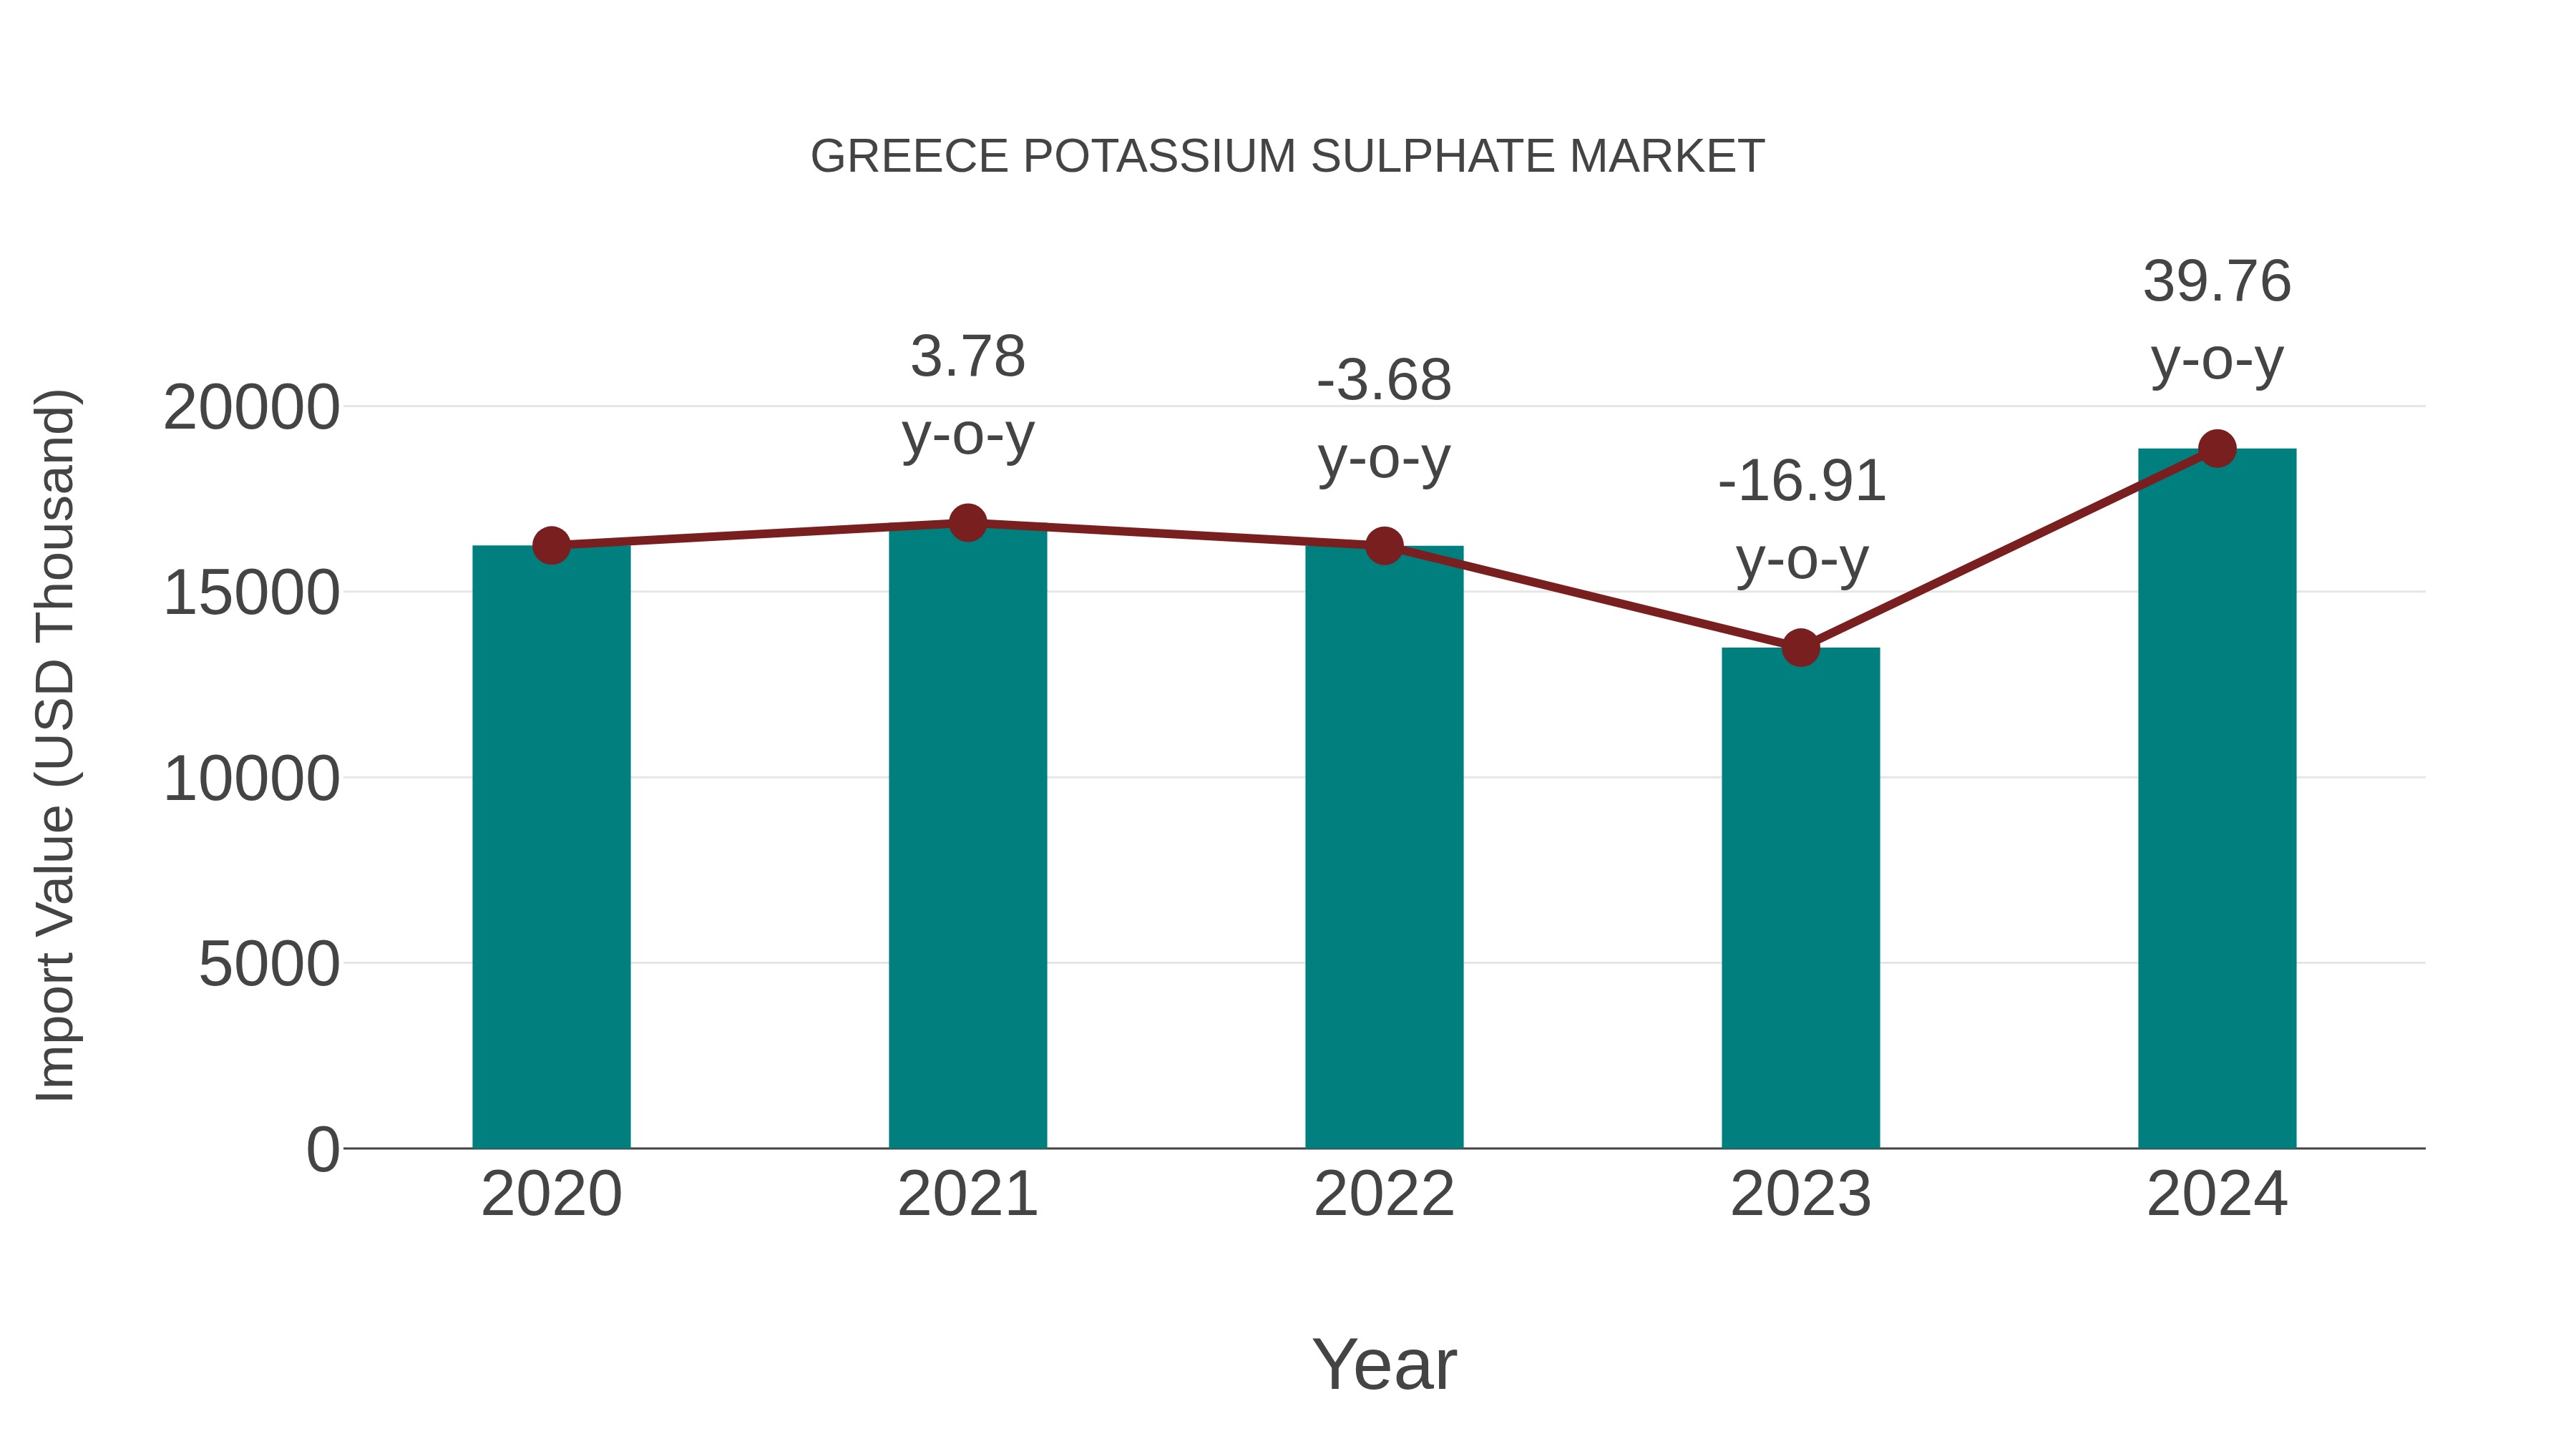
Greece Potassium Sulphate Market: Import Trend Analysis
In the Greece potassium sulphate market, the import trend showed significant growth from 2023 to 2024, with a notable increase of 39.76%. The compound annual growth rate (CAGR) for imports between 2020 and 2024 stood at 3.8%. This surge in import momentum could be attributed to evolving demand dynamics or shifts in trade policies impacting market stability.
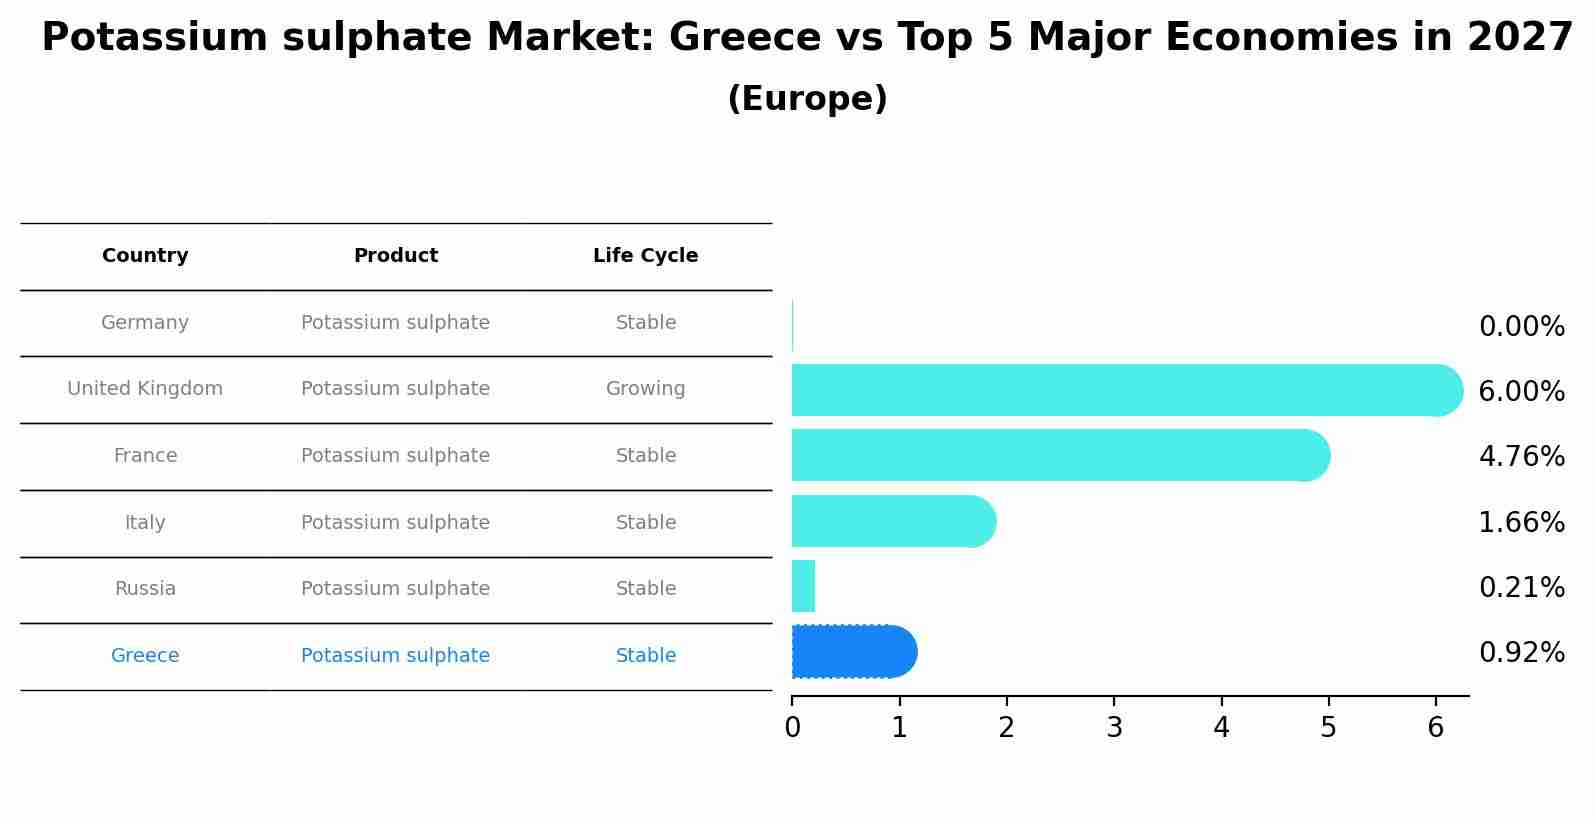
Potassium sulphate Market: Greece vs Top 5 Major Economies in 2027 (Europe)
In the Europe region, the Potassium sulphate market in Greece is projected to expand at a stable growth rate of 0.92% by 2027. The largest economy is Germany, followed by United Kingdom, France, Italy and Russia.
Greece Potassium sulphate Market Overview
The potassium sulphate market in Greece is growing as this fertilizer component is increasingly used in agricultural applications to enhance crop yield. Potassium sulphate is valued for its ability to improve the quality of fruits and vegetables while minimizing soil salinity, making it crucial for sustainable farming practices.
Drivers of the market
The Greece potassium sulfate market is expanding as demand increases for high-quality fertilizers that improve crop yields, particularly in high-value crops like fruits and vegetables. Potassium sulfates role in enhancing soil quality and plant health is driving its growing use in the agriculture sector.
Challenges of the market
The Greece Potassium Sulphate Market faces challenges from global supply chain disruptions and fluctuating raw material prices. As the agricultural sector shifts toward more sustainable practices, there is increasing pressure on producers to develop eco-friendly alternatives to traditional potash fertilizers.
Government Policy of the market
Greek government policies encourage the use of potassium sulfate in agriculture as a high-efficiency fertilizer. Regulations align with EU sustainability goals, promoting environmentally responsible agricultural practices and reducing the environmental impact of fertilizers.
Key Highlights of the Report:
- Greece Potassium sulphate Market Outlook
- Market Size of Greece Potassium sulphate Market, 2025
- Forecast of Greece Potassium sulphate Market, 2032
- Historical Data and Forecast of Greece Potassium sulphate Revenues & Volume for the Period 2022-2032F
- Greece Potassium sulphate Market Trend Evolution
- Greece Potassium sulphate Market Drivers and Challenges
- Greece Potassium sulphate Price Trends
- Greece Potassium sulphate Porter`s Five Forces
- Greece Potassium sulphate Industry Life Cycle
- Historical Data and Forecast of Greece Potassium sulphate Market Revenues & Volume By Form for the Period 2022-2032F
- Historical Data and Forecast of Greece Potassium sulphate Market Revenues & Volume By Solidfor the Period 2022-2032F
- Historical Data and Forecast of Greece Potassium sulphate Market Revenues & Volume By Liquidfor the Period 2022-2032F
- Historical Data and Forecast of Greece Potassium sulphate Market Revenues & Volume By Process for the Period 2022-2032F
- Historical Data and Forecast of Greece Potassium sulphate Market Revenues & Volume By Mannheim Process for the Period 2022-2032F
- Historical Data and Forecast of Greece Potassium sulphate Market Revenues & Volume By Sulphate Salts Reaction for the Period 2022-2032F
- Historical Data and Forecast of Greece Potassium sulphate Market Revenues & Volume By Brine Processing for the Period 2022-2032F
- Historical Data and Forecast of Greece Potassium sulphate Market Revenues & Volume By Others for the Period 2022-2032F
- Historical Data and Forecast of Greece Potassium sulphate Market Revenues & Volume By End-users for the Period 2022-2032F
- Historical Data and Forecast of Greece Potassium sulphate Market Revenues & Volume By Agriculture for the Period 2022-2032F
- Historical Data and Forecast of Greece Potassium sulphate Market Revenues & Volume By Industrial for the Period 2022-2032F
- Historical Data and Forecast of Greece Potassium sulphate Market Revenues & Volume By Pharmaceuticals for the Period 2022-2032F
- Historical Data and Forecast of Greece Potassium sulphate Market Revenues & Volume By Cosmetics for the Period 2022-2032F
- Historical Data and Forecast of Greece Potassium sulphate Market Revenues & Volume By Food & Beverages for the Period 2022-2032F
- Historical Data and Forecast of Greece Potassium sulphate Market Revenues & Volume By Others for the Period 2022-2032F
- Greece Potassium sulphate Import Export Trade Statistics
- Market Opportunity Assessment By Form
- Market Opportunity Assessment By Process
- Market Opportunity Assessment By End-users
- Greece Potassium sulphate Top Companies Market Share
- Greece Potassium sulphate Competitive Benchmarking By Technical and Operational Parameters
- Greece Potassium sulphate Company Profiles
- Greece Potassium sulphate Key Strategic Recommendations
Greece Potassium sulphate Market (2026-2032): FAQs
6Wresearch actively monitors the Greece Potassium sulphate Market and publishes its comprehensive annual report, highlighting emerging trends, growth drivers, revenue analysis, and forecast outlook. Our insights help businesses to make data-backed strategic decisions with ongoing market dynamics. Our analysts track relevent industries related to the Greece Potassium sulphate Market, allowing our clients with actionable intelligence and reliable forecasts tailored to emerging regional needs.
Yes, we provide customisation as per your requirements. To learn more, feel free to contact us on sales@6wresearch.com
1 Executive Summary |
2 Introduction |
2.1 Key Highlights of the Report |
2.2 Report Description |
2.3 Market Scope & Segmentation |
2.4 Research Methodology |
2.5 Assumptions |
3 Greece Potassium sulphate Market Overview |
3.1 Greece Country Macro Economic Indicators |
3.2 Greece Potassium sulphate Market Revenues & Volume, 2022 & 2032F |
3.3 Greece Potassium sulphate Market - Industry Life Cycle |
3.4 Greece Potassium sulphate Market - Porter's Five Forces |
3.5 Greece Potassium sulphate Market Revenues & Volume Share, By Form, 2022 & 2032F |
3.6 Greece Potassium sulphate Market Revenues & Volume Share, By Process, 2022 & 2032F |
3.7 Greece Potassium sulphate Market Revenues & Volume Share, By End-users, 2022 & 2032F |
4 Greece Potassium sulphate Market Dynamics |
4.1 Impact Analysis |
4.2 Market Drivers |
4.2.1 Growing demand for organic food products, as potassium sulfate is commonly used in organic farming practices. |
4.2.2 Increasing adoption of potassium sulfate in the agriculture sector for improving crop quality and yield. |
4.2.3 Rise in awareness about the benefits of using potassium sulfate over other fertilizers for certain crops. |
4.3 Market Restraints |
4.3.1 Fluctuating prices of raw materials used in the production of potassium sulfate. |
4.3.2 Stringent regulations and policies governing the use of fertilizers in agriculture. |
4.3.3 Competition from alternative potassium sources, such as potassium chloride, impacting market growth. |
5 Greece Potassium sulphate Market Trends |
6 Greece Potassium sulphate Market Segmentations |
6.1 Greece Potassium sulphate Market, By Form |
6.1.1 Overview and Analysis |
6.1.2 Greece Potassium sulphate Market Revenues & Volume, By Solid? , 2022-2032F |
6.1.3 Greece Potassium sulphate Market Revenues & Volume, By Liquid? , 2022-2032F |
6.2 Greece Potassium sulphate Market, By Process |
6.2.1 Overview and Analysis |
6.2.2 Greece Potassium sulphate Market Revenues & Volume, By Mannheim Process, 2022-2032F |
6.2.3 Greece Potassium sulphate Market Revenues & Volume, By Sulphate Salts Reaction, 2022-2032F |
6.2.4 Greece Potassium sulphate Market Revenues & Volume, By Brine Processing, 2022-2032F |
6.2.5 Greece Potassium sulphate Market Revenues & Volume, By Others, 2022-2032F |
6.3 Greece Potassium sulphate Market, By End-users |
6.3.1 Overview and Analysis |
6.3.2 Greece Potassium sulphate Market Revenues & Volume, By Agriculture, 2022-2032F |
6.3.3 Greece Potassium sulphate Market Revenues & Volume, By Industrial, 2022-2032F |
6.3.4 Greece Potassium sulphate Market Revenues & Volume, By Pharmaceuticals, 2022-2032F |
6.3.5 Greece Potassium sulphate Market Revenues & Volume, By Cosmetics, 2022-2032F |
6.3.6 Greece Potassium sulphate Market Revenues & Volume, By Food & Beverages, 2022-2032F |
6.3.7 Greece Potassium sulphate Market Revenues & Volume, By Others, 2022-2032F |
7 Greece Potassium sulphate Market Import-Export Trade Statistics |
7.1 Greece Potassium sulphate Market Export to Major Countries |
7.2 Greece Potassium sulphate Market Imports from Major Countries |
8 Greece Potassium sulphate Market Key Performance Indicators |
8.1 Average selling price of potassium sulfate in the Greek market. |
8.2 Adoption rate of potassium sulfate in different crops and regions in Greece. |
8.3 Percentage of agriculture professionals recommending or using potassium sulfate in their farming practices. |
9 Greece Potassium sulphate Market - Opportunity Assessment |
9.1 Greece Potassium sulphate Market Opportunity Assessment, By Form, 2022 & 2032F |
9.2 Greece Potassium sulphate Market Opportunity Assessment, By Process, 2022 & 2032F |
9.3 Greece Potassium sulphate Market Opportunity Assessment, By End-users, 2022 & 2032F |
10 Greece Potassium sulphate Market - Competitive Landscape |
10.1 Greece Potassium sulphate Market Revenue Share, By Companies, 2025 |
10.2 Greece Potassium sulphate Market Competitive Benchmarking, By Operating and Technical Parameters |
11 Company Profiles |
12 Recommendations | 13 Disclaimer |
Global Go To Market Strategy - 2030
Export potential enables firms to identify high-growth global markets with greater confidence by combining advanced trade intelligence with a structured quantitative methodology. The framework analyzes emerging demand trends and country-level import patterns while integrating macroeconomic and trade datasets such as GDP and population forecasts, bilateral import–export flows, tariff structures, elasticity differentials between developed and developing economies, geographic distance, and import demand projections. Using weighted trade values from 2020–2024 as the base period to project country-to-country export potential for 2030, these inputs are operationalized through calculated drivers such as gravity model parameters, tariff impact factors, and projected GDP per-capita growth. Through an analysis of hidden potentials, demand hotspots, and market conditions that are most favorable to success, this method enables firms to focus on target countries, maximize returns, and global expansion with data, backed by accuracy.
By factoring in the projected importer demand gap that is currently unmet and could be potential opportunity, it identifies the potential for the Exporter (Country) among 190 countries, against the general trade analysis, which identifies the biggest importer or exporter.
To discover high-growth global markets and optimize your business strategy:
Click Here
Pricing
- Single User License$ 1,995
- Department License$ 2,400
- Site License$ 3,120
- Global License$ 3,795

Leadership Perspectives from Industry Events
Search
Thought Leadership and Analyst Meet


Our Clients
6WResearch In News
- Doha a strategic location for EV manufacturing hub: IPA Qatar
- Demand for luxury TVs surging in the GCC, says Samsung
- Empowering Growth: The Thriving Journey of Bangladesh’s Cable Industry
- Demand for luxury TVs surging in the GCC, says Samsung
- Video call with a traditional healer? Once unthinkable, it’s now common in South Africa
- Intelligent Buildings To Smooth GCC’s Path To Net Zero
Latest Reports
- Taiwan Airport Wireless Infrastructure Market (2026-2032)
- Vietnam Airport Wireless Infrastructure Market (2026-2032)
- Thailand Airport Wireless Infrastructure Market (2026-2032)
- South Korea Airport Wireless Infrastructure Market (2026-2032)
- Romania Airport Wireless Infrastructure Market (2026-2032)
- Qatar Airport Wireless Infrastructure Market (2026-2032)
- Philippines Airport Wireless Infrastructure Market (2026-2032)
- Japan Airport Wireless Infrastructure Market (2026-2032)
- Taiwan Airport Winter Services Market (2026-2032)
- Vietnam Airport Winter Services Market (2026-2032)
Industry Events and Analyst Meet

HIMTEX 2026

India Refining Summit 2026

India EV Show 2026

EV tech India Expo 2026

Auto Tech Asia 2026
Whitepaper
- Middle East & Africa Commercial Security Market Click here to view more.
- Middle East & Africa Fire Safety Systems & Equipment Market Click here to view more.
- GCC Drone Market Click here to view more.
- Middle East Lighting Fixture Market Click here to view more.
- GCC Physical & Perimeter Security Market Click here to view more.