Greece Propionic acid Market (2026-2032) | Trends, Forecast, Industry, Revenue, Share, Growth, Analysis, Size, Companies, Value, Segmentation & Outlook
Market Forecast By Application (Herbicides, Rubber Products, Plasticizers, Food Preservatives, Others), By End use Industry (Pharmaceuticals, Personal Care, Food & Beverage, Agriculture, Others) And Competitive Landscape
| Product Code: ETC4746276 | Publication Date: Nov 2023 | Updated Date: Apr 2026 | Product Type: Market Research Report | |
| Publisher: 6Wresearch | Author: Sachin Kumar Rai | No. of Pages: 60 | No. of Figures: 30 | No. of Tables: 5 |
Greece Propionic Acid Market Size (2020-2030)
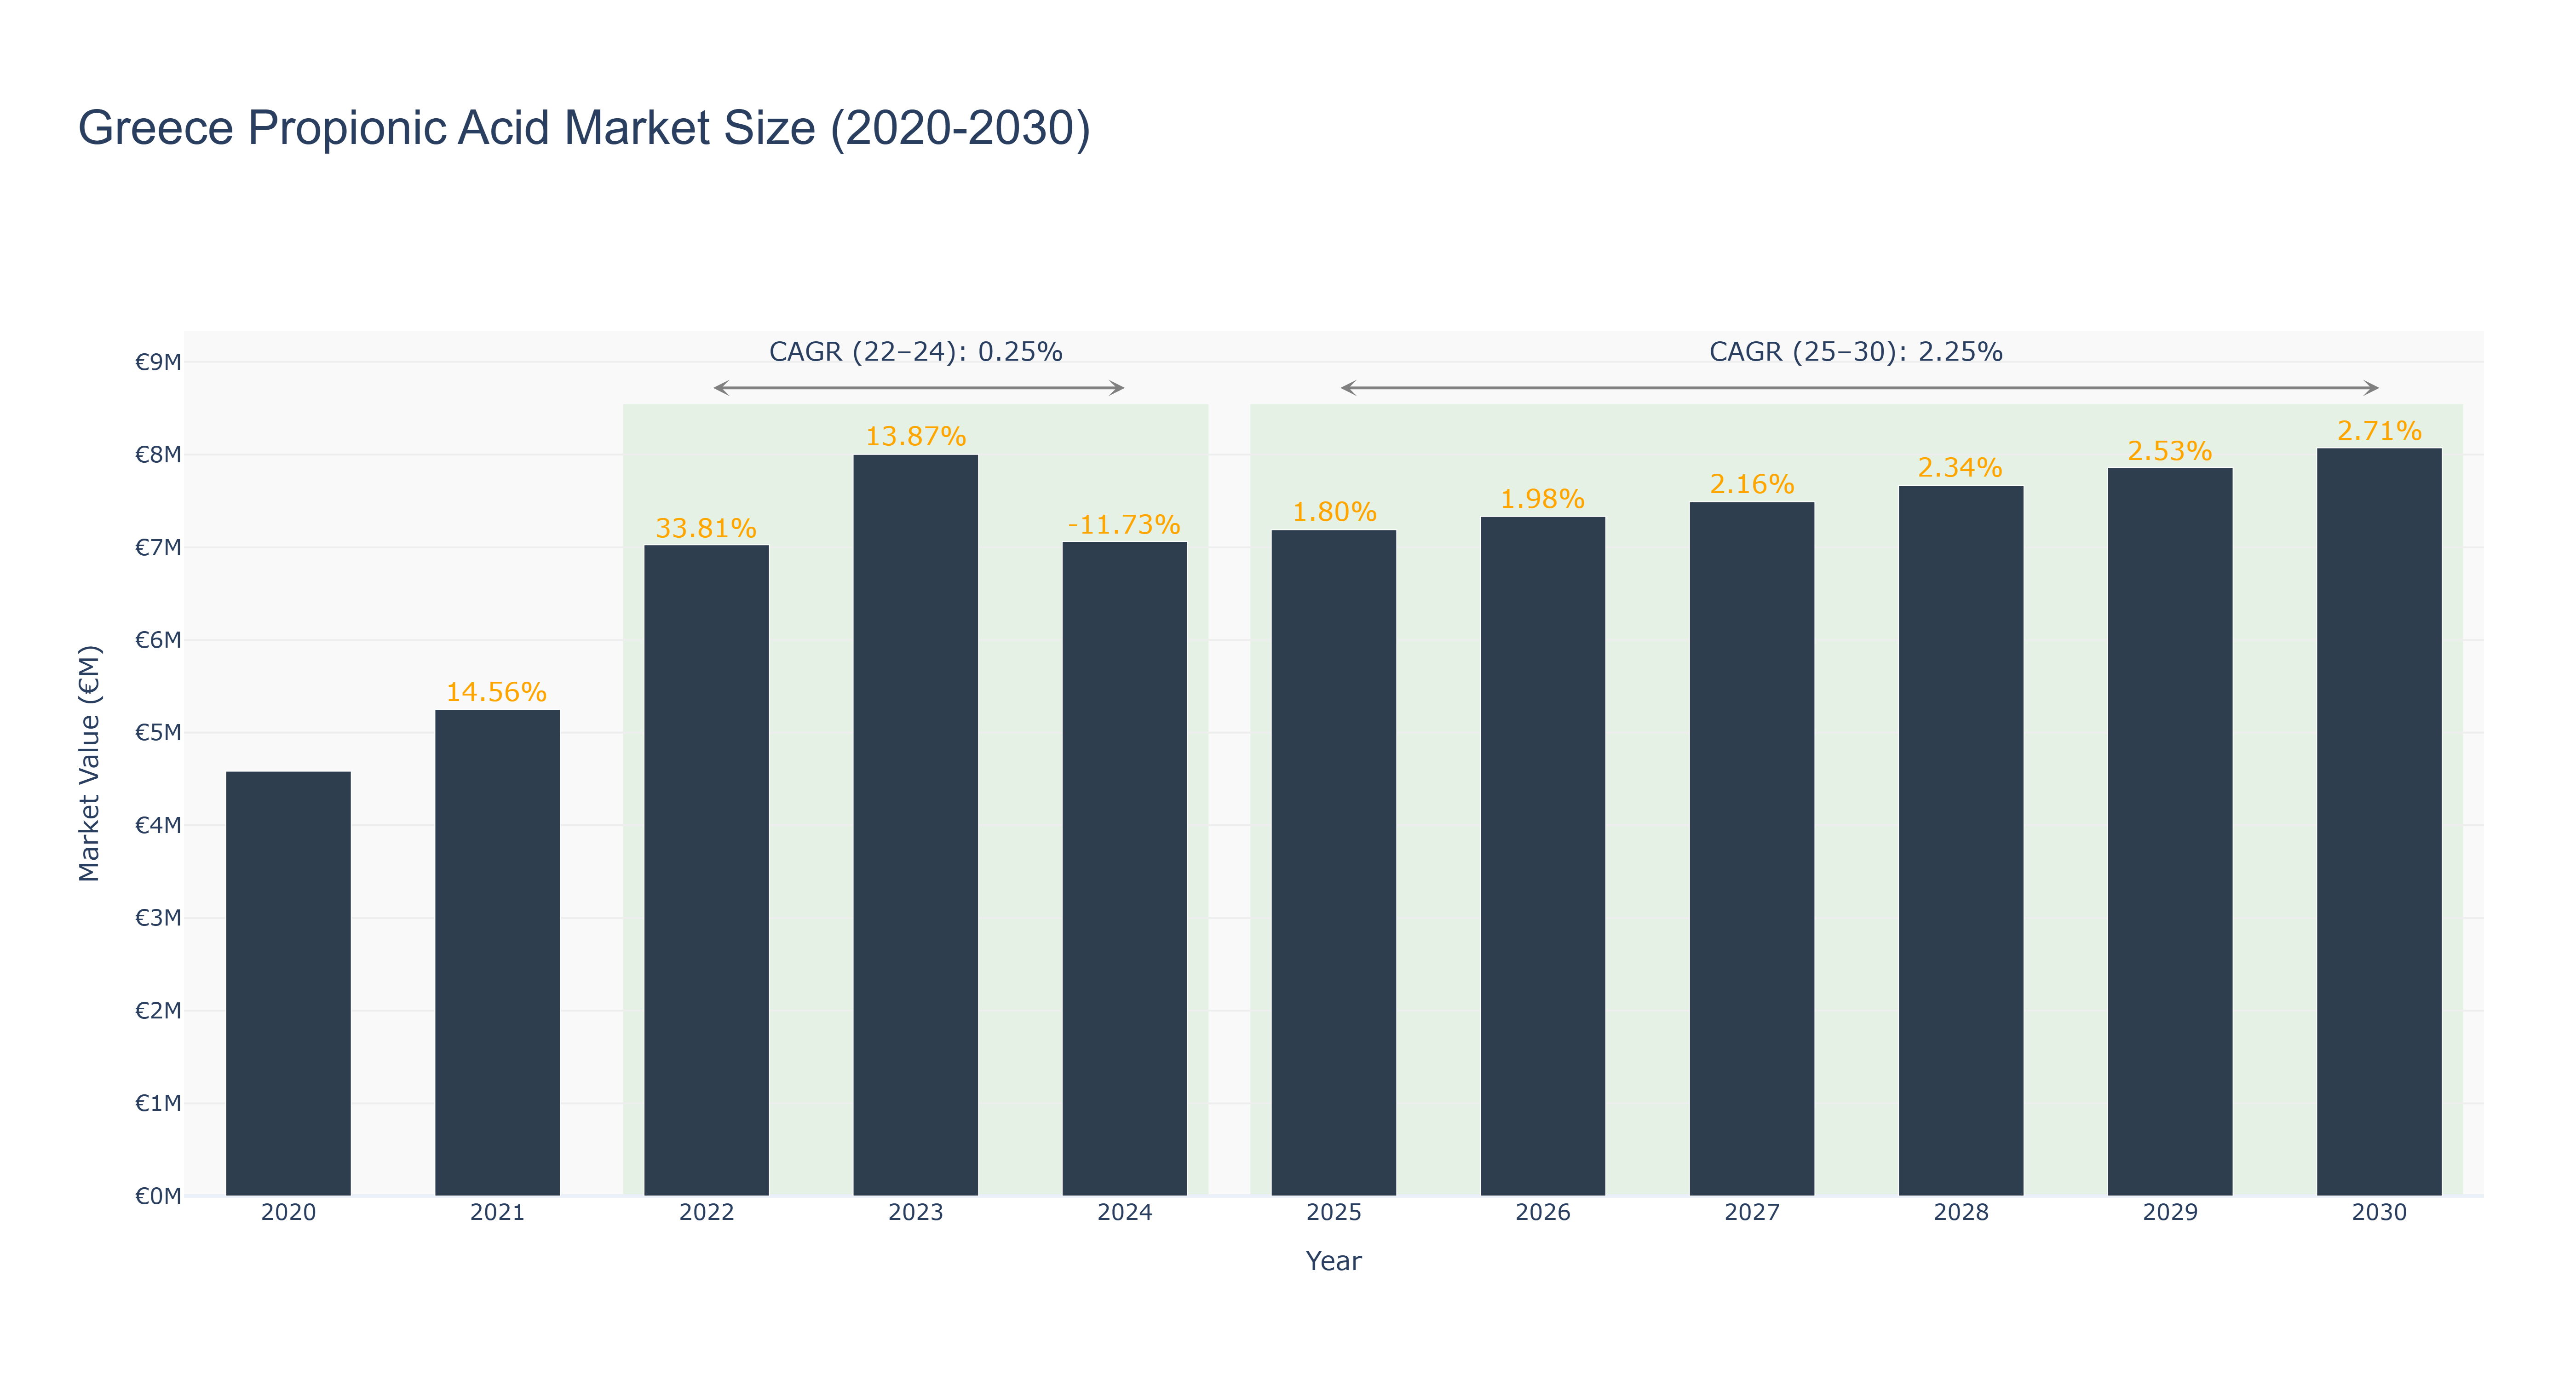
The Greece Propionic Acid Market experienced a fluctuating trend in recent years. The peak market size was €8.00 million in 2023, following a steady growth trajectory from €4.58 million in 2020. However, a decline was observed in 2024 to €7.06 million due to a negative growth rate of -11.73%. Moving forward, the market is forecasted to grow steadily, reaching €8.07 million in 2030 with a CAGR of 2.71% from 2025 to 2030. The market's CAGR from 2022 to 2024 was 0.25%, reflecting a slower growth phase. The recent developments in sustainable agriculture practices in Greece are expected to drive the demand for propionic acid, supporting market growth in the coming years. Additionally, upcoming collaborations between local producers and international partners aim to enhance production efficiency and market competitiveness.
Greece Propionic Acid Market: Production & Trade Performance (2019-2025)
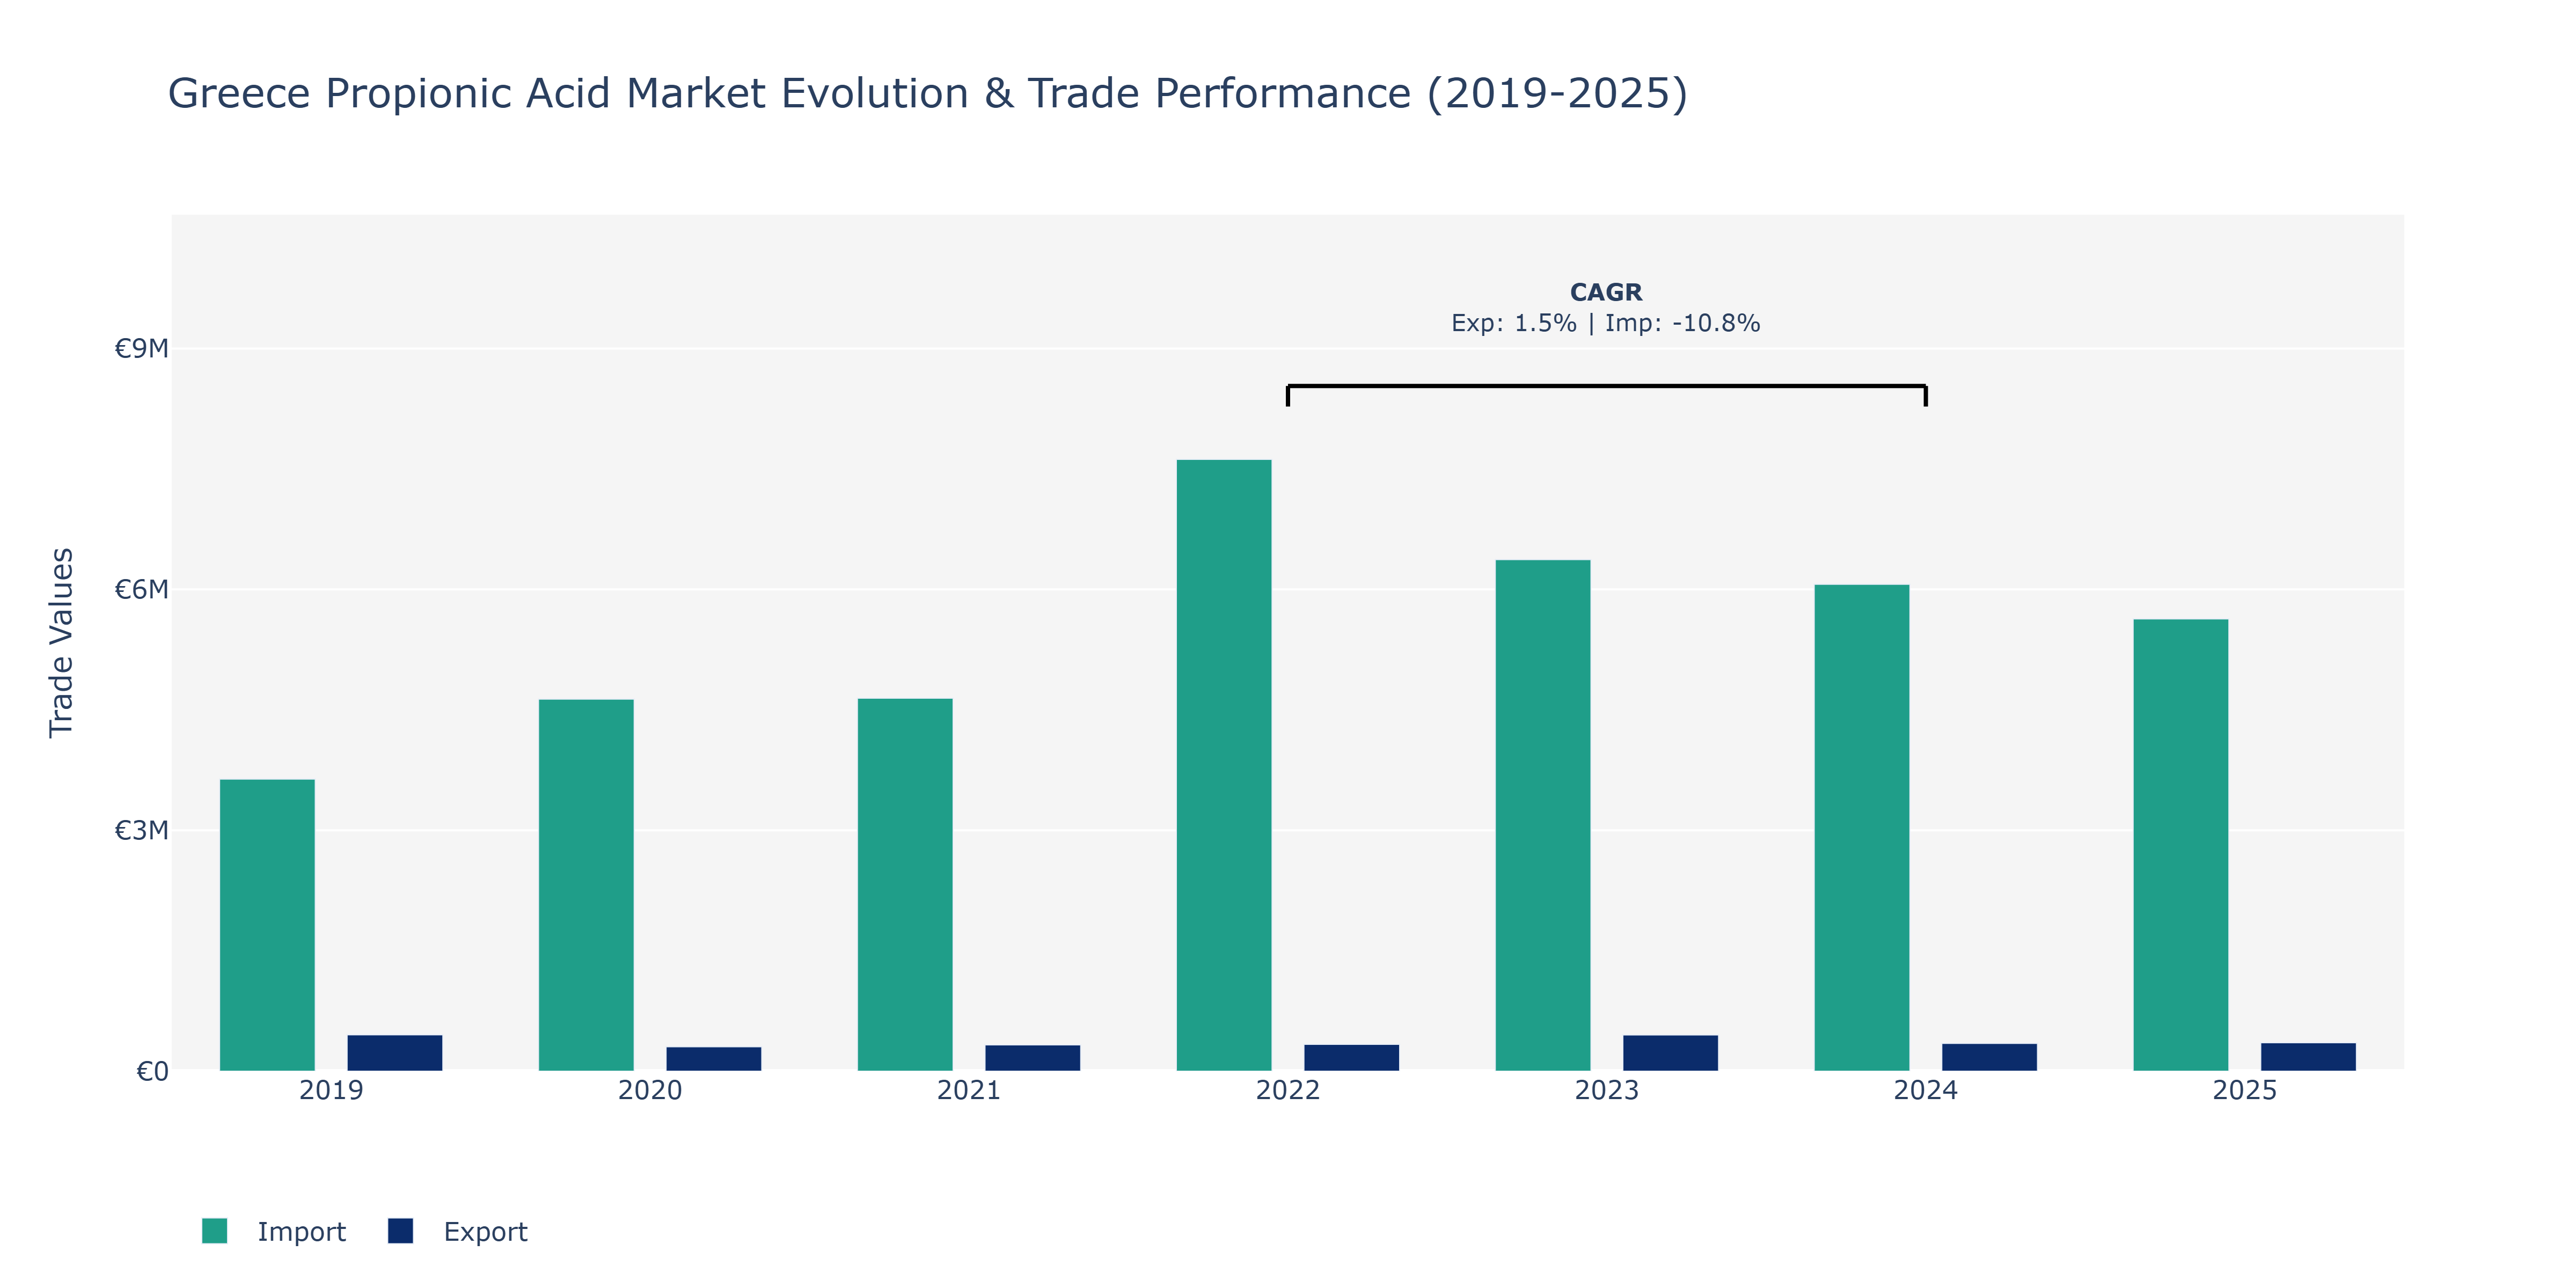
The Greece Propionic Acid Market saw a fluctuating pattern in Exports and Imports from 2019 to 2025. Exports experienced a decline from €453.22 thousand in 2019 to €303.53 thousand in 2020, followed by a noticeable increase to €450.57 thousand in 2023 before dropping again to €354.74 thousand in 2025. On the other hand, Imports showcased an upward trajectory, rising steadily from €3.64 million in 2019 to peak at €7.62 million in 2022, then slightly decreasing to €5.63 million in 2025. The spike in 2022 can be attributed to increased demand for propionic acid, possibly due to expanding industries relying on this chemical compound. The fluctuations in both Exports and Imports could be influenced by shifts in global market demand, production capacities, or regulatory changes impacting trade dynamics within the chemical industry. Such trends highlight the market's sensitivity to external factors, necessitating continuous monitoring and strategic planning to navigate market volatilities effectively.
Greece Propionic acid Market Overview
The propionic acid market in Greece is expanding due to its use as a preservative in food, feed, and agricultural products, as well as in chemical manufacturing. The increasing demand for food preservation, along with its applications in animal feed and the production of herbicides, is driving growth in the propionic acid market.
Drivers of the market
The Greece propionic acid market is driven by its use in the production of preservatives for food and animal feed, as well as in the chemical industry. As consumers increasingly seek safer and longer-lasting food products, the demand for natural preservatives like propionic acid is rising. Additionally, its use in industrial applications such as plastics and pharmaceuticals contributes to its market growth in Greece.
Challenges of the market
The Greece Propionic Acid Market faces challenges from fluctuations in raw material prices, particularly from sources like acetic acid and ethanol, which can impact production costs. Additionally, the market is pressured by growing demand for sustainable and bio-based alternatives to traditional chemicals, requiring investment in research and development. Competition from global producers and increasing environmental regulations around chemical production also present obstacles for local manufacturers.
Government Policy of the market
The Greek government supports the propionic acid market by promoting its use in food preservation, agriculture, and industrial applications. Policies ensure compliance with EU safety and environmental regulations, encouraging the sustainable production and use of propionic acid in various sectors.
Key Highlights of the Report:
- Greece Propionic acid Market Outlook
- Market Size of Greece Propionic acid Market, 2025
- Forecast of Greece Propionic acid Market, 2032
- Historical Data and Forecast of Greece Propionic acid Revenues & Volume for the Period 2022-2032F
- Greece Propionic acid Market Trend Evolution
- Greece Propionic acid Market Drivers and Challenges
- Greece Propionic acid Price Trends
- Greece Propionic acid Porter`s Five Forces
- Greece Propionic acid Industry Life Cycle
- Historical Data and Forecast of Greece Propionic acid Market Revenues & Volume By Application for the Period 2022-2032F
- Historical Data and Forecast of Greece Propionic acid Market Revenues & Volume By Herbicides for the Period 2022-2032F
- Historical Data and Forecast of Greece Propionic acid Market Revenues & Volume By Rubber Products for the Period 2022-2032F
- Historical Data and Forecast of Greece Propionic acid Market Revenues & Volume By Plasticizers for the Period 2022-2032F
- Historical Data and Forecast of Greece Propionic acid Market Revenues & Volume By Food Preservatives for the Period 2022-2032F
- Historical Data and Forecast of Greece Propionic acid Market Revenues & Volume By Others for the Period 2022-2032F
- Historical Data and Forecast of Greece Propionic acid Market Revenues & Volume By End use Industry for the Period 2022-2032F
- Historical Data and Forecast of Greece Propionic acid Market Revenues & Volume By Pharmaceuticals for the Period 2022-2032F
- Historical Data and Forecast of Greece Propionic acid Market Revenues & Volume By Personal Care for the Period 2022-2032F
- Historical Data and Forecast of Greece Propionic acid Market Revenues & Volume By Food & Beverage for the Period 2022-2032F
- Historical Data and Forecast of Greece Propionic acid Market Revenues & Volume By Agriculture for the Period 2022-2032F
- Historical Data and Forecast of Greece Propionic acid Market Revenues & Volume By Others for the Period 2022-2032F
- Greece Propionic acid Import Export Trade Statistics
- Market Opportunity Assessment By Application
- Market Opportunity Assessment By End use Industry
- Greece Propionic acid Top Companies Market Share
- Greece Propionic acid Competitive Benchmarking By Technical and Operational Parameters
- Greece Propionic acid Company Profiles
- Greece Propionic acid Key Strategic Recommendations
Greece Propionic acid Market (2026-2032): FAQs
6Wresearch actively monitors the Greece Propionic acid Market and publishes its comprehensive annual report, highlighting emerging trends, growth drivers, revenue analysis, and forecast outlook. Our insights help businesses to make data-backed strategic decisions with ongoing market dynamics. Our analysts track relevent industries related to the Greece Propionic acid Market, allowing our clients with actionable intelligence and reliable forecasts tailored to emerging regional needs.
Yes, we provide customisation as per your requirements. To learn more, feel free to contact us on sales@6wresearch.com
1 Executive Summary |
2 Introduction |
2.1 Key Highlights of the Report |
2.2 Report Description |
2.3 Market Scope & Segmentation |
2.4 Research Methodology |
2.5 Assumptions |
3 Greece Propionic acid Market Overview |
3.1 Greece Country Macro Economic Indicators |
3.2 Greece Propionic acid Market Revenues & Volume, 2022 & 2032F |
3.3 Greece Propionic acid Market - Industry Life Cycle |
3.4 Greece Propionic acid Market - Porter's Five Forces |
3.5 Greece Propionic acid Market Revenues & Volume Share, By Application, 2022 & 2032F |
3.6 Greece Propionic acid Market Revenues & Volume Share, By End use Industry, 2022 & 2032F |
4 Greece Propionic acid Market Dynamics |
4.1 Impact Analysis |
4.2 Market Drivers |
4.2.1 Growing demand for food preservatives in the food and beverage industry |
4.2.2 Increasing use of propionic acid as a mold inhibitor in bakery products |
4.2.3 Rising awareness about the benefits of propionic acid in animal feed additives |
4.3 Market Restraints |
4.3.1 Fluctuating prices of raw materials impacting production costs |
4.3.2 Stringent government regulations regarding the use of propionic acid in food products |
4.3.3 Competition from alternative preservatives in the market |
5 Greece Propionic acid Market Trends |
6 Greece Propionic acid Market Segmentations |
6.1 Greece Propionic acid Market, By Application |
6.1.1 Overview and Analysis |
6.1.2 Greece Propionic acid Market Revenues & Volume, By Herbicides, 2022-2032F |
6.1.3 Greece Propionic acid Market Revenues & Volume, By Rubber Products, 2022-2032F |
6.1.4 Greece Propionic acid Market Revenues & Volume, By Plasticizers, 2022-2032F |
6.1.5 Greece Propionic acid Market Revenues & Volume, By Food Preservatives, 2022-2032F |
6.1.6 Greece Propionic acid Market Revenues & Volume, By Others, 2022-2032F |
6.2 Greece Propionic acid Market, By End use Industry |
6.2.1 Overview and Analysis |
6.2.2 Greece Propionic acid Market Revenues & Volume, By Pharmaceuticals, 2022-2032F |
6.2.3 Greece Propionic acid Market Revenues & Volume, By Personal Care, 2022-2032F |
6.2.4 Greece Propionic acid Market Revenues & Volume, By Food & Beverage, 2022-2032F |
6.2.5 Greece Propionic acid Market Revenues & Volume, By Agriculture, 2022-2032F |
6.2.6 Greece Propionic acid Market Revenues & Volume, By Others, 2022-2032F |
7 Greece Propionic acid Market Import-Export Trade Statistics |
7.1 Greece Propionic acid Market Export to Major Countries |
7.2 Greece Propionic acid Market Imports from Major Countries |
8 Greece Propionic acid Market Key Performance Indicators |
8.1 Average selling price of propionic acid in the Greek market |
8.2 Adoption rate of propionic acid in different food and feed applications |
8.3 Number of research and development initiatives focused on enhancing the properties of propionic acid |
9 Greece Propionic acid Market - Opportunity Assessment |
9.1 Greece Propionic acid Market Opportunity Assessment, By Application, 2022 & 2032F |
9.2 Greece Propionic acid Market Opportunity Assessment, By End use Industry, 2022 & 2032F |
10 Greece Propionic acid Market - Competitive Landscape |
10.1 Greece Propionic acid Market Revenue Share, By Companies, 2025 |
10.2 Greece Propionic acid Market Competitive Benchmarking, By Operating and Technical Parameters |
11 Company Profiles |
12 Recommendations | 13 Disclaimer |
Export potential assessment - trade Analytics for 2030
Export potential enables firms to identify high-growth global markets with greater confidence by combining advanced trade intelligence with a structured quantitative methodology. The framework analyzes emerging demand trends and country-level import patterns while integrating macroeconomic and trade datasets such as GDP and population forecasts, bilateral import–export flows, tariff structures, elasticity differentials between developed and developing economies, geographic distance, and import demand projections. Using weighted trade values from 2020–2024 as the base period to project country-to-country export potential for 2030, these inputs are operationalized through calculated drivers such as gravity model parameters, tariff impact factors, and projected GDP per-capita growth. Through an analysis of hidden potentials, demand hotspots, and market conditions that are most favorable to success, this method enables firms to focus on target countries, maximize returns, and global expansion with data, backed by accuracy.
By factoring in the projected importer demand gap that is currently unmet and could be potential opportunity, it identifies the potential for the Exporter (Country) among 190 countries, against the general trade analysis, which identifies the biggest importer or exporter.
To discover high-growth global markets and optimize your business strategy:
Click Here
Pricing
- Single User License$ 1,995
- Department License$ 2,400
- Site License$ 3,120
- Global License$ 3,795

Search
Thought Leadership and Analyst Meet


Our Clients
Latest Reports
- Philippines Polyhydroxybutyrate-co-Hydroxyvalerate Market (2026-2032) | Trends, Insights, Challenges, Restraints, Competition, Size, Value, Forecast, Pricing, Share, Outlook, Revenue, Investment Opportunities, Strategy, Drivers, Demand, Growth, segmentation, Analysis, Companies
- Peru Polyhydroxybutyrate-co-Hydroxyvalerate Market (2026-2032) | Growth, Demand, Challenges, Share, Trends, Analysis, Pricing, Investment Opportunities, Drivers, Value, Forecast, Competition, Size, Companies, Insights, Outlook, Restraints, segmentation, Revenue, Strategy
- Pakistan Polyhydroxybutyrate-co-Hydroxyvalerate Market (2026-2032) | Restraints, segmentation, Pricing, Forecast, Share, Strategy, Competition, Trends, Insights, Drivers, Challenges, Growth, Revenue, Outlook, Value, Investment Opportunities, Companies, Size, Analysis, Demand
- Oman Polyhydroxybutyrate-co-Hydroxyvalerate Market (2026-2032) | Drivers, segmentation, Insights, Competition, Pricing, Outlook, Size, Revenue, Challenges, Forecast, Analysis, Growth, Value, Share, Trends, Investment Opportunities, Strategy, Restraints, Companies, Demand
- Nigeria Polyhydroxybutyrate-co-Hydroxyvalerate Market (2026-2032) | Value, Investment Opportunities, Analysis, Revenue, Restraints, Pricing, Outlook, Competition, Demand, Growth, Forecast, Companies, Trends, Challenges, segmentation, Drivers, Insights, Share, Size, Strategy
- Nepal Polyhydroxybutyrate-co-Hydroxyvalerate Market (2026-2032) | Insights, Analysis, Drivers, Share, Revenue, Demand, segmentation, Investment Opportunities, Competition, Forecast, Growth, Pricing, Companies, Strategy, Trends, Restraints, Challenges, Outlook, Size, Value
- Myanmar Polyhydroxybutyrate-co-Hydroxyvalerate Market (2026-2032) | Outlook, Revenue, Strategy, Restraints, Drivers, segmentation, Share, Forecast, Competition, Insights, Growth, Pricing, Size, Demand, Value, Companies, Trends, Challenges, Investment Opportunities, Analysis
- Morocco Polyhydroxybutyrate-co-Hydroxyvalerate Market (2026-2032) | Outlook, Investment Opportunities, Restraints, Strategy, Forecast, Challenges, Drivers, Growth, Companies, segmentation, Trends, Size, Competition, Revenue, Demand, Insights, Share, Analysis, Value, Pricing
- Mexico Polyhydroxybutyrate-co-Hydroxyvalerate Market (2026-2032) | Size, Drivers, Outlook, Share, Strategy, Growth, Pricing, Challenges, Companies, Demand, Value, Investment Opportunities, Restraints, Trends, Forecast, segmentation, Analysis, Insights, Competition, Revenue
- Malaysia Polyhydroxybutyrate-co-Hydroxyvalerate Market (2026-2032) | Share, segmentation, Size, Companies, Analysis, Insights, Forecast, Value, Revenue, Drivers, Restraints, Challenges, Investment Opportunities, Trends, Competition, Strategy, Demand, Growth, Outlook, Pricing
Industry Events and Analyst Meet

HIMTEX 2026

India Refining Summit 2026

India EV Show 2026

EV tech India Expo 2026

Auto Tech Asia 2026
Whitepaper
- Middle East & Africa Commercial Security Market Click here to view more.
- Middle East & Africa Fire Safety Systems & Equipment Market Click here to view more.
- GCC Drone Market Click here to view more.
- Middle East Lighting Fixture Market Click here to view more.
- GCC Physical & Perimeter Security Market Click here to view more.
6WResearch In News
- Doha a strategic location for EV manufacturing hub: IPA Qatar
- Demand for luxury TVs surging in the GCC, says Samsung
- Empowering Growth: The Thriving Journey of Bangladesh’s Cable Industry
- Demand for luxury TVs surging in the GCC, says Samsung
- Video call with a traditional healer? Once unthinkable, it’s now common in South Africa
- Intelligent Buildings To Smooth GCC’s Path To Net Zero