Greece Saccharin Market (2026-2032) | Outlook, Growth, Share, Revenue, Companies, Trends, Analysis, Size, Segmentation, Industry, Value & Forecast
Market Forecast By Form (Granular, Powder), By Product Type (Sodium Saccharin, Calcium Saccharin, Insoluble Saccharin), By Application (Food and Beverages, Agrochemicals and Chemicals, Dietary Supplements, Table-Top Sweeteners, Personal Care and Cosmetics Products, Pharmaceuticals, Electroplating Solutions, Others) And Competitive Landscape
| Product Code: ETC4750000 | Publication Date: Nov 2023 | Updated Date: Apr 2026 | Product Type: Market Research Report | |
| Publisher: 6Wresearch | Author: Shubham Padhi | No. of Pages: 60 | No. of Figures: 30 | No. of Tables: 5 |
Greece Saccharin Market Size (2020-2030)
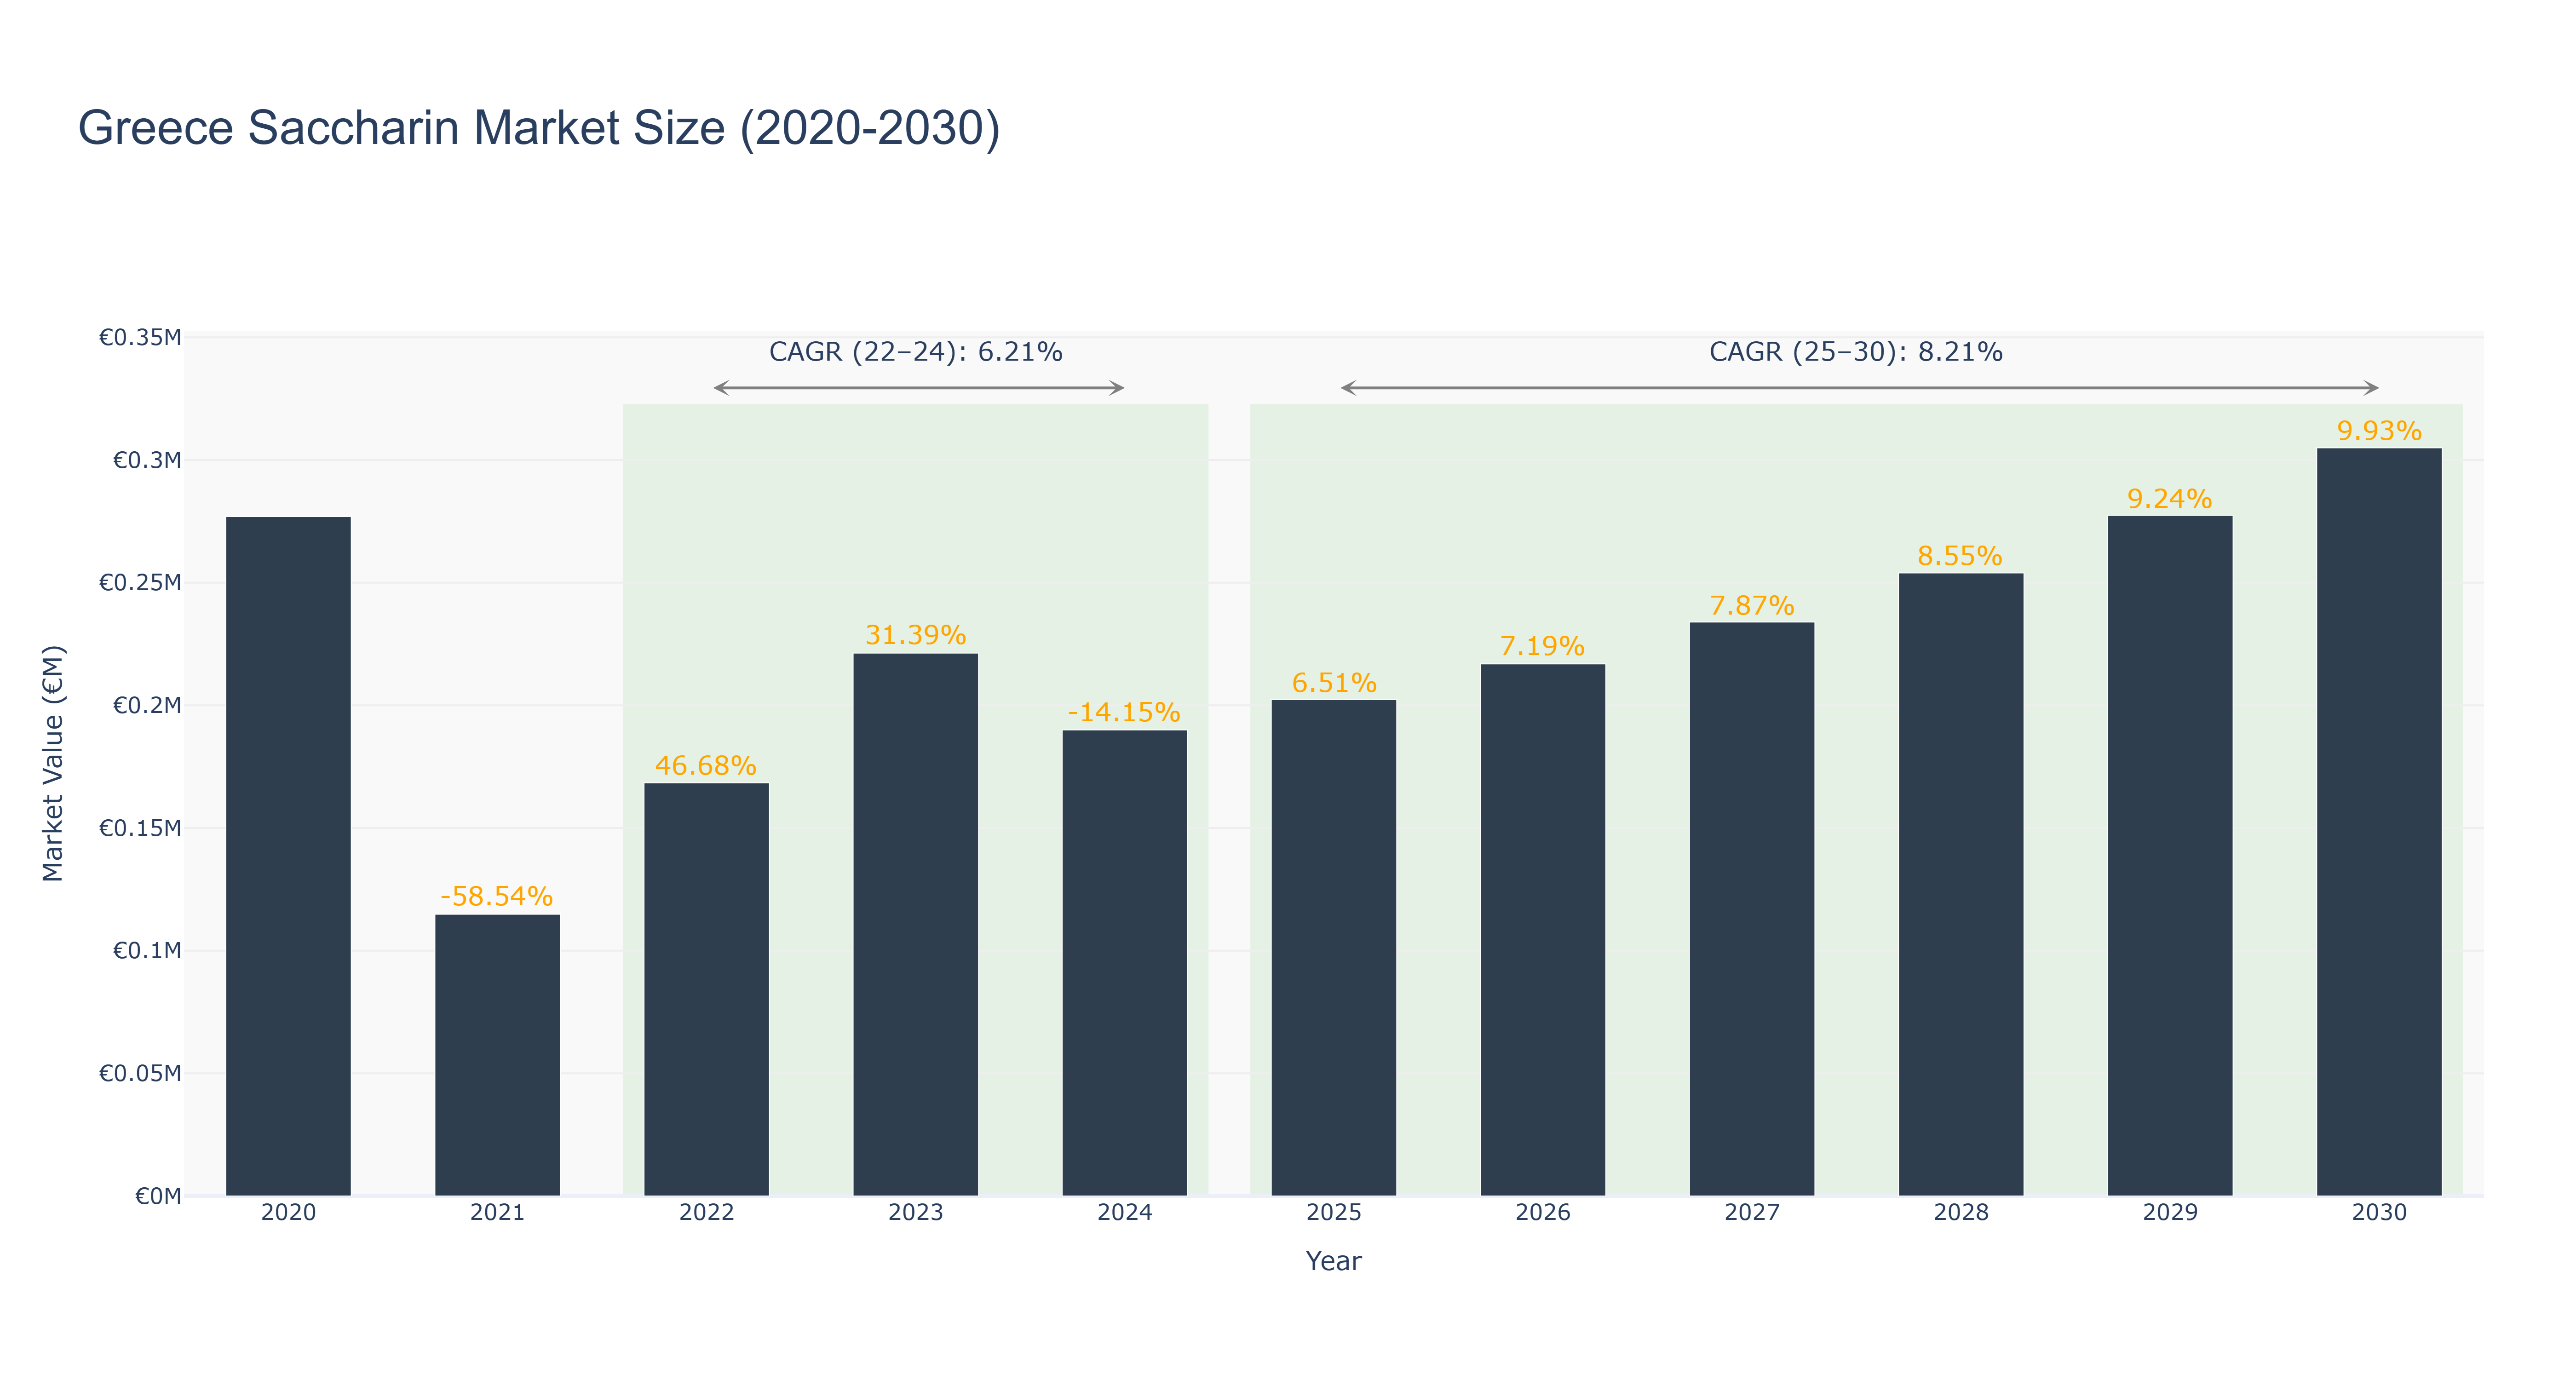
The Greece Saccharin Market experienced volatility from 2020 to 2024, with a peak market size of €276.92 thousand in 2020, followed by a sharp decline to €114.82 thousand in 2021 (-58.54%). However, the market rebounded with a growth of 46.68% in 2022, reaching €168.42 thousand, and continued to grow to €221.29 thousand in 2023 (31.39%), before a downturn to €189.98 thousand in 2024 (-14.15%). The actual CAGR for this period is 6.21%. Looking ahead, the forecasted period from 2025 to 2030 anticipates a more stable growth trajectory, with market sizes projected to reach €304.98 thousand by 2030, reflecting a CAGR of 8.21%. Factors driving this growth include increasing demand for low-calorie sweeteners and health-conscious consumer trends. As the market stabilizes, ongoing developments in food and beverage formulations are expected to further enhance the adoption of saccharin in Greece.
Greece Saccharin Market: Production & Trade Performance (2019-2025)
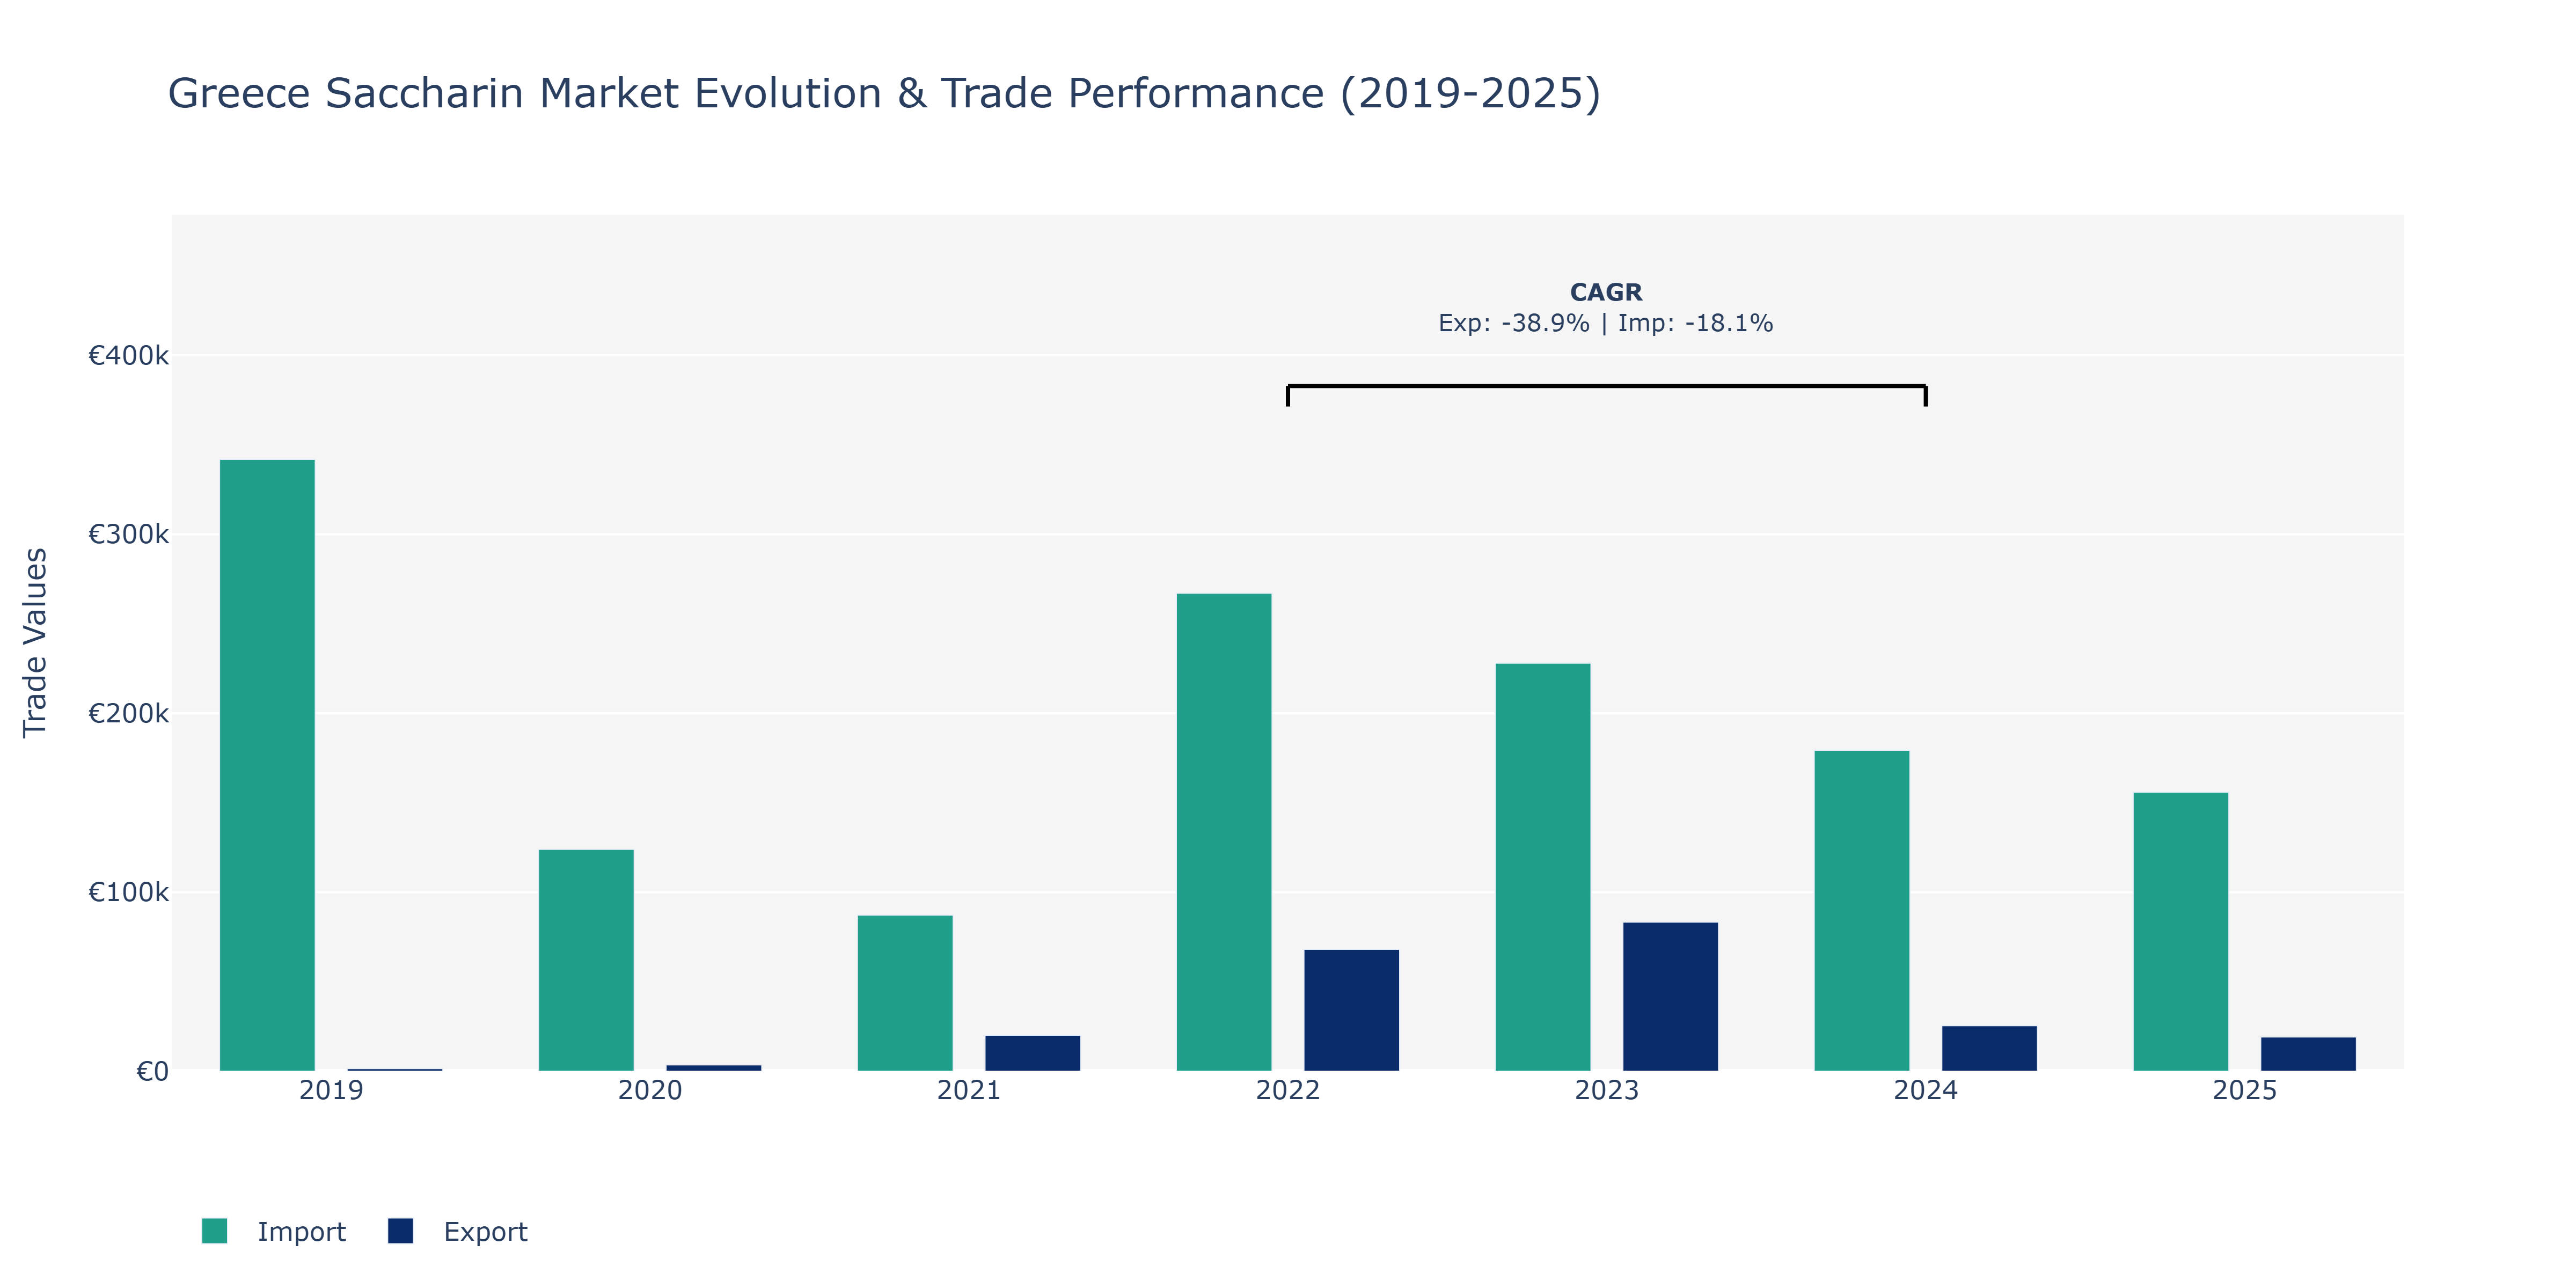
Between 2019 and 2025, Greece's Saccharin Market saw notable trends in both Exports and Imports. Exports surged from €1.44 thousand in 2019 to €83.25 thousand in 2023, peaked at €83.25 thousand in 2023, and then dropped to €25.41 thousand in 2024 before rebounding slightly to €19.11 thousand in 2025. Meanwhile, Imports followed a similar trajectory, increasing from €341.8 thousand in 2019 to €266.96 thousand in 2022, hitting a peak at that point, and then experiencing a decline to €179.27 thousand in 2024 and further decreasing to €155.85 thousand in 2025. These fluctuations can be attributed to various factors such as changes in global demand for saccharin products, shifts in production capacities, and fluctuations in raw material prices. The declining trend in exports and imports in the last years may indicate market stabilization after a period of rapid growth, potentially prompting companies to reassess their strategies in response to evolving market conditions.
Key Highlights of the Report:
- Greece Saccharin Market Outlook
- Market Size of Greece Saccharin Market, 2025
- Forecast of Greece Saccharin Market, 2032
- Historical Data and Forecast of Greece Saccharin Revenues & Volume for the Period 2022-2032F
- Greece Saccharin Market Trend Evolution
- Greece Saccharin Market Drivers and Challenges
- Greece Saccharin Price Trends
- Greece Saccharin Porter`s Five Forces
- Greece Saccharin Industry Life Cycle
- Historical Data and Forecast of Greece Saccharin Market Revenues & Volume By Form for the Period 2022-2032F
- Historical Data and Forecast of Greece Saccharin Market Revenues & Volume By Granular for the Period 2022-2032F
- Historical Data and Forecast of Greece Saccharin Market Revenues & Volume By Powder for the Period 2022-2032F
- Historical Data and Forecast of Greece Saccharin Market Revenues & Volume By Product Type for the Period 2022-2032F
- Historical Data and Forecast of Greece Saccharin Market Revenues & Volume By Sodium Saccharin for the Period 2022-2032F
- Historical Data and Forecast of Greece Saccharin Market Revenues & Volume By Calcium Saccharin for the Period 2022-2032F
- Historical Data and Forecast of Greece Saccharin Market Revenues & Volume By Insoluble Saccharin for the Period 2022-2032F
- Historical Data and Forecast of Greece Saccharin Market Revenues & Volume By Application for the Period 2022-2032F
- Historical Data and Forecast of Greece Saccharin Market Revenues & Volume By Food and Beverages for the Period 2022-2032F
- Historical Data and Forecast of Greece Saccharin Market Revenues & Volume By Agrochemicals and Chemicals for the Period 2022-2032F
- Historical Data and Forecast of Greece Saccharin Market Revenues & Volume By Dietary Supplements for the Period 2022-2032F
- Historical Data and Forecast of Greece Saccharin Market Revenues & Volume By Table-Top Sweeteners for the Period 2022-2032F
- Historical Data and Forecast of Greece Saccharin Market Revenues & Volume By Personal Care and Cosmetics Products for the Period 2022-2032F
- Historical Data and Forecast of Greece Saccharin Market Revenues & Volume By Pharmaceuticals for the Period 2022-2032F
- Historical Data and Forecast of Greece Saccharin Market Revenues & Volume By Electroplating Solutions for the Period 2022-2032F
- Historical Data and Forecast of Greece Saccharin Market Revenues & Volume By Others for the Period 2022-2032F
- Greece Saccharin Import Export Trade Statistics
- Market Opportunity Assessment By Form
- Market Opportunity Assessment By Product Type
- Market Opportunity Assessment By Application
- Greece Saccharin Top Companies Market Share
- Greece Saccharin Competitive Benchmarking By Technical and Operational Parameters
- Greece Saccharin Company Profiles
- Greece Saccharin Key Strategic Recommendations
Frequently Asked Questions About the Market Study (FAQs):
6Wresearch actively monitors the Greece Saccharin Market and publishes its comprehensive annual report, highlighting emerging trends, growth drivers, revenue analysis, and forecast outlook. Our insights help businesses to make data-backed strategic decisions with ongoing market dynamics. Our analysts track relevent industries related to the Greece Saccharin Market, allowing our clients with actionable intelligence and reliable forecasts tailored to emerging regional needs.
Yes, we provide customisation as per your requirements. To learn more, feel free to contact us on sales@6wresearch.com
1 Executive Summary |
2 Introduction |
2.1 Key Highlights of the Report |
2.2 Report Description |
2.3 Market Scope & Segmentation |
2.4 Research Methodology |
2.5 Assumptions |
3 Greece Saccharin Market Overview |
3.1 Greece Country Macro Economic Indicators |
3.2 Greece Saccharin Market Revenues & Volume, 2022 & 2032F |
3.3 Greece Saccharin Market - Industry Life Cycle |
3.4 Greece Saccharin Market - Porter's Five Forces |
3.5 Greece Saccharin Market Revenues & Volume Share, By Form, 2022 & 2032F |
3.6 Greece Saccharin Market Revenues & Volume Share, By Product Type, 2022 & 2032F |
3.7 Greece Saccharin Market Revenues & Volume Share, By Application, 2022 & 2032F |
4 Greece Saccharin Market Dynamics |
4.1 Impact Analysis |
4.2 Market Drivers |
4.2.1 Growing awareness about health concerns related to sugar consumption, leading consumers to seek low-calorie alternatives like saccharin. |
4.2.2 Increasing prevalence of diabetes and obesity, driving the demand for sugar substitutes in Greece. |
4.2.3 Rising adoption of saccharin in food and beverage industries for product formulation and reformulation to meet consumer preferences for healthier options. |
4.3 Market Restraints |
4.3.1 Stringent regulations and restrictions on the use of artificial sweeteners like saccharin, impacting market penetration. |
4.3.2 Concerns and controversies surrounding the safety and health effects of saccharin, leading to consumer hesitation in using these products. |
5 Greece Saccharin Market Trends |
6 Greece Saccharin Market Segmentations |
6.1 Greece Saccharin Market, By Form |
6.1.1 Overview and Analysis |
6.1.2 Greece Saccharin Market Revenues & Volume, By Granular, 2022-2032F |
6.1.3 Greece Saccharin Market Revenues & Volume, By Powder, 2022-2032F |
6.2 Greece Saccharin Market, By Product Type |
6.2.1 Overview and Analysis |
6.2.2 Greece Saccharin Market Revenues & Volume, By Sodium Saccharin, 2022-2032F |
6.2.3 Greece Saccharin Market Revenues & Volume, By Calcium Saccharin, 2022-2032F |
6.2.4 Greece Saccharin Market Revenues & Volume, By Insoluble Saccharin, 2022-2032F |
6.3 Greece Saccharin Market, By Application |
6.3.1 Overview and Analysis |
6.3.2 Greece Saccharin Market Revenues & Volume, By Food and Beverages, 2022-2032F |
6.3.3 Greece Saccharin Market Revenues & Volume, By Agrochemicals and Chemicals, 2022-2032F |
6.3.4 Greece Saccharin Market Revenues & Volume, By Dietary Supplements, 2022-2032F |
6.3.5 Greece Saccharin Market Revenues & Volume, By Table-Top Sweeteners, 2022-2032F |
6.3.6 Greece Saccharin Market Revenues & Volume, By Personal Care and Cosmetics Products, 2022-2032F |
6.3.7 Greece Saccharin Market Revenues & Volume, By Pharmaceuticals, 2022-2032F |
6.3.8 Greece Saccharin Market Revenues & Volume, By Others, 2022-2032F |
6.3.9 Greece Saccharin Market Revenues & Volume, By Others, 2022-2032F |
7 Greece Saccharin Market Import-Export Trade Statistics |
7.1 Greece Saccharin Market Export to Major Countries |
7.2 Greece Saccharin Market Imports from Major Countries |
8 Greece Saccharin Market Key Performance Indicators |
8.1 Consumer acceptance and perception surveys on saccharin as a sugar substitute. |
8.2 Number of new product launches incorporating saccharin in the Greek market. |
8.3 Research and development investment in saccharin-based products by key industry players. |
8.4 Market penetration and adoption rate of saccharin in different food and beverage categories in Greece. |
9 Greece Saccharin Market - Opportunity Assessment |
9.1 Greece Saccharin Market Opportunity Assessment, By Form, 2022 & 2032F |
9.2 Greece Saccharin Market Opportunity Assessment, By Product Type, 2022 & 2032F |
9.3 Greece Saccharin Market Opportunity Assessment, By Application, 2022 & 2032F |
10 Greece Saccharin Market - Competitive Landscape |
10.1 Greece Saccharin Market Revenue Share, By Companies, 2025 |
10.2 Greece Saccharin Market Competitive Benchmarking, By Operating and Technical Parameters |
11 Company Profiles |
12 Recommendations | 13 Disclaimer |
Global Go To Market Strategy - 2030
Export potential enables firms to identify high-growth global markets with greater confidence by combining advanced trade intelligence with a structured quantitative methodology. The framework analyzes emerging demand trends and country-level import patterns while integrating macroeconomic and trade datasets such as GDP and population forecasts, bilateral import–export flows, tariff structures, elasticity differentials between developed and developing economies, geographic distance, and import demand projections. Using weighted trade values from 2020–2024 as the base period to project country-to-country export potential for 2030, these inputs are operationalized through calculated drivers such as gravity model parameters, tariff impact factors, and projected GDP per-capita growth. Through an analysis of hidden potentials, demand hotspots, and market conditions that are most favorable to success, this method enables firms to focus on target countries, maximize returns, and global expansion with data, backed by accuracy.
By factoring in the projected importer demand gap that is currently unmet and could be potential opportunity, it identifies the potential for the Exporter (Country) among 190 countries, against the general trade analysis, which identifies the biggest importer or exporter.
To discover high-growth global markets and optimize your business strategy:
Click Here
Pricing
- Single User License$ 1,995
- Department License$ 2,400
- Site License$ 3,120
- Global License$ 3,795

Leadership Perspectives from Industry Events
Search
Thought Leadership and Analyst Meet


Our Clients
6WResearch In News
- Doha a strategic location for EV manufacturing hub: IPA Qatar
- Demand for luxury TVs surging in the GCC, says Samsung
- Empowering Growth: The Thriving Journey of Bangladesh’s Cable Industry
- Demand for luxury TVs surging in the GCC, says Samsung
- Video call with a traditional healer? Once unthinkable, it’s now common in South Africa
- Intelligent Buildings To Smooth GCC’s Path To Net Zero
Latest Reports
- New Zealand Aseptic Manufacturing Market (2026-2032)
- Netherlands Aseptic Manufacturing Market (2026-2032)
- Nauru Aseptic Manufacturing Market (2026-2032)
- Namibia Aseptic Manufacturing Market (2026-2032)
- Mozambique Aseptic Manufacturing Market (2026-2032)
- Montenegro Aseptic Manufacturing Market (2026-2032)
- Mongolia Aseptic Manufacturing Market (2026-2032)
- Monaco Aseptic Manufacturing Market (2026-2032)
- Micronesia Aseptic Manufacturing Market (2026-2032)
- Mauritius Aseptic Manufacturing Market (2026-2032)
Industry Events and Analyst Meet

HIMTEX 2026

India Refining Summit 2026

India EV Show 2026

EV tech India Expo 2026

Auto Tech Asia 2026
Whitepaper
- Middle East & Africa Commercial Security Market Click here to view more.
- Middle East & Africa Fire Safety Systems & Equipment Market Click here to view more.
- GCC Drone Market Click here to view more.
- Middle East Lighting Fixture Market Click here to view more.
- GCC Physical & Perimeter Security Market Click here to view more.