Greece Synthetic Tannins Market (2026-2032) | Share, Outlook, Growth, Trends, Value, Forecast, Competitive Landscape, Size & Revenue, Industry, Segmentation, Companies, Analysis
Market Forecast By Type (Hydrolyzable, Condensed), By Application (Pharmaceutical Industry, Food Industry, Paper Industry, Textile Industry, Others) And Competitive Landscape
| Product Code: ETC7360475 | Publication Date: Sep 2024 | Updated Date: Apr 2026 | Product Type: Market Research Report | |
| Publisher: 6Wresearch | Author: Dhaval Chaurasia | No. of Pages: 75 | No. of Figures: 35 | No. of Tables: 20 |
Greece Synthetic Tannins Market Size (2020-2030)
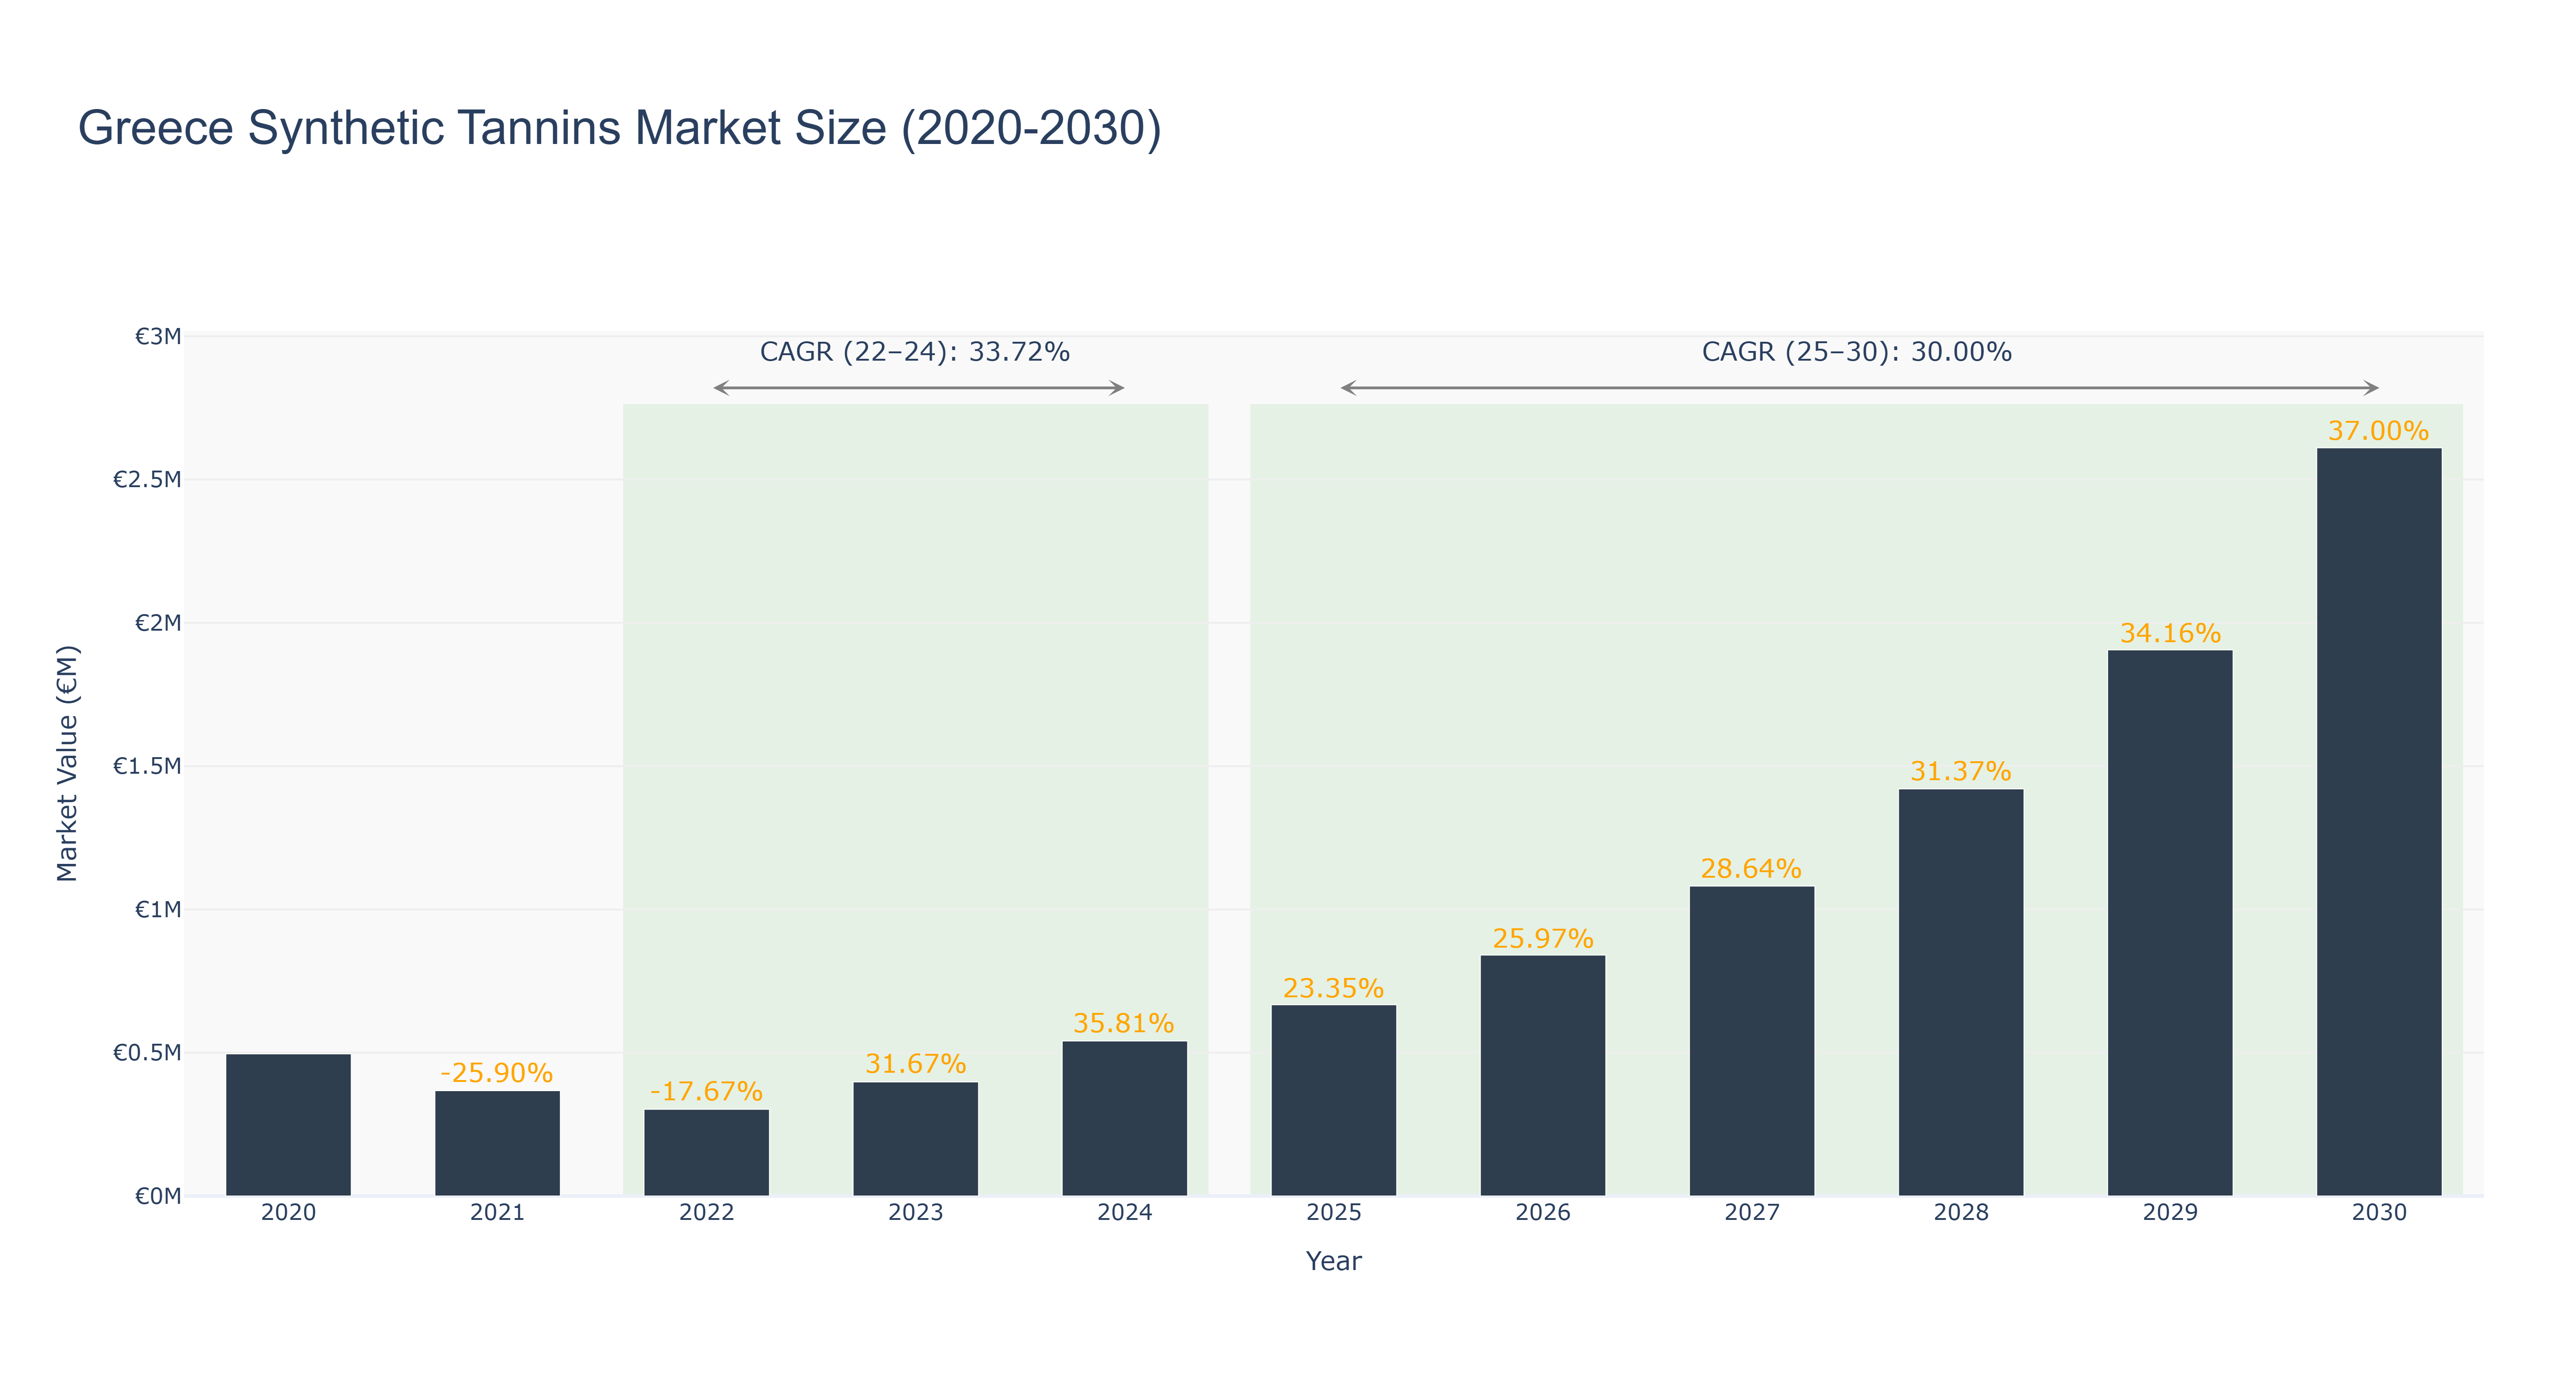
The Greece Synthetic Tannins Market experienced a steady growth trajectory from 2020 to 2024, reaching a peak market size of €0.54 million in 2024. However, the market size declined in 2021 and 2022 due to economic challenges, with a recovery starting in 2023 driven by increased demand for synthetic tannins in various industries. The market is forecasted to continue its growth trend, with a projected market size of €2.61 million in 2030. The CAGR for the period 2022-24 is 33.72%, reflecting the rapid recovery post-2022, while the CAGR for 2025-30 is expected to be 30.0%, indicating sustained growth momentum. Industry drivers such as the expanding leather industry and the increasing use of synthetic tannins in pharmaceuticals are expected to fuel market growth. Recent developments include collaborations between local tanneries and international fashion brands to enhance product quality and sustainability, setting the stage for future market expansion.
Greece Synthetic Tannins Market: Production & Trade Performance (2019-2025)
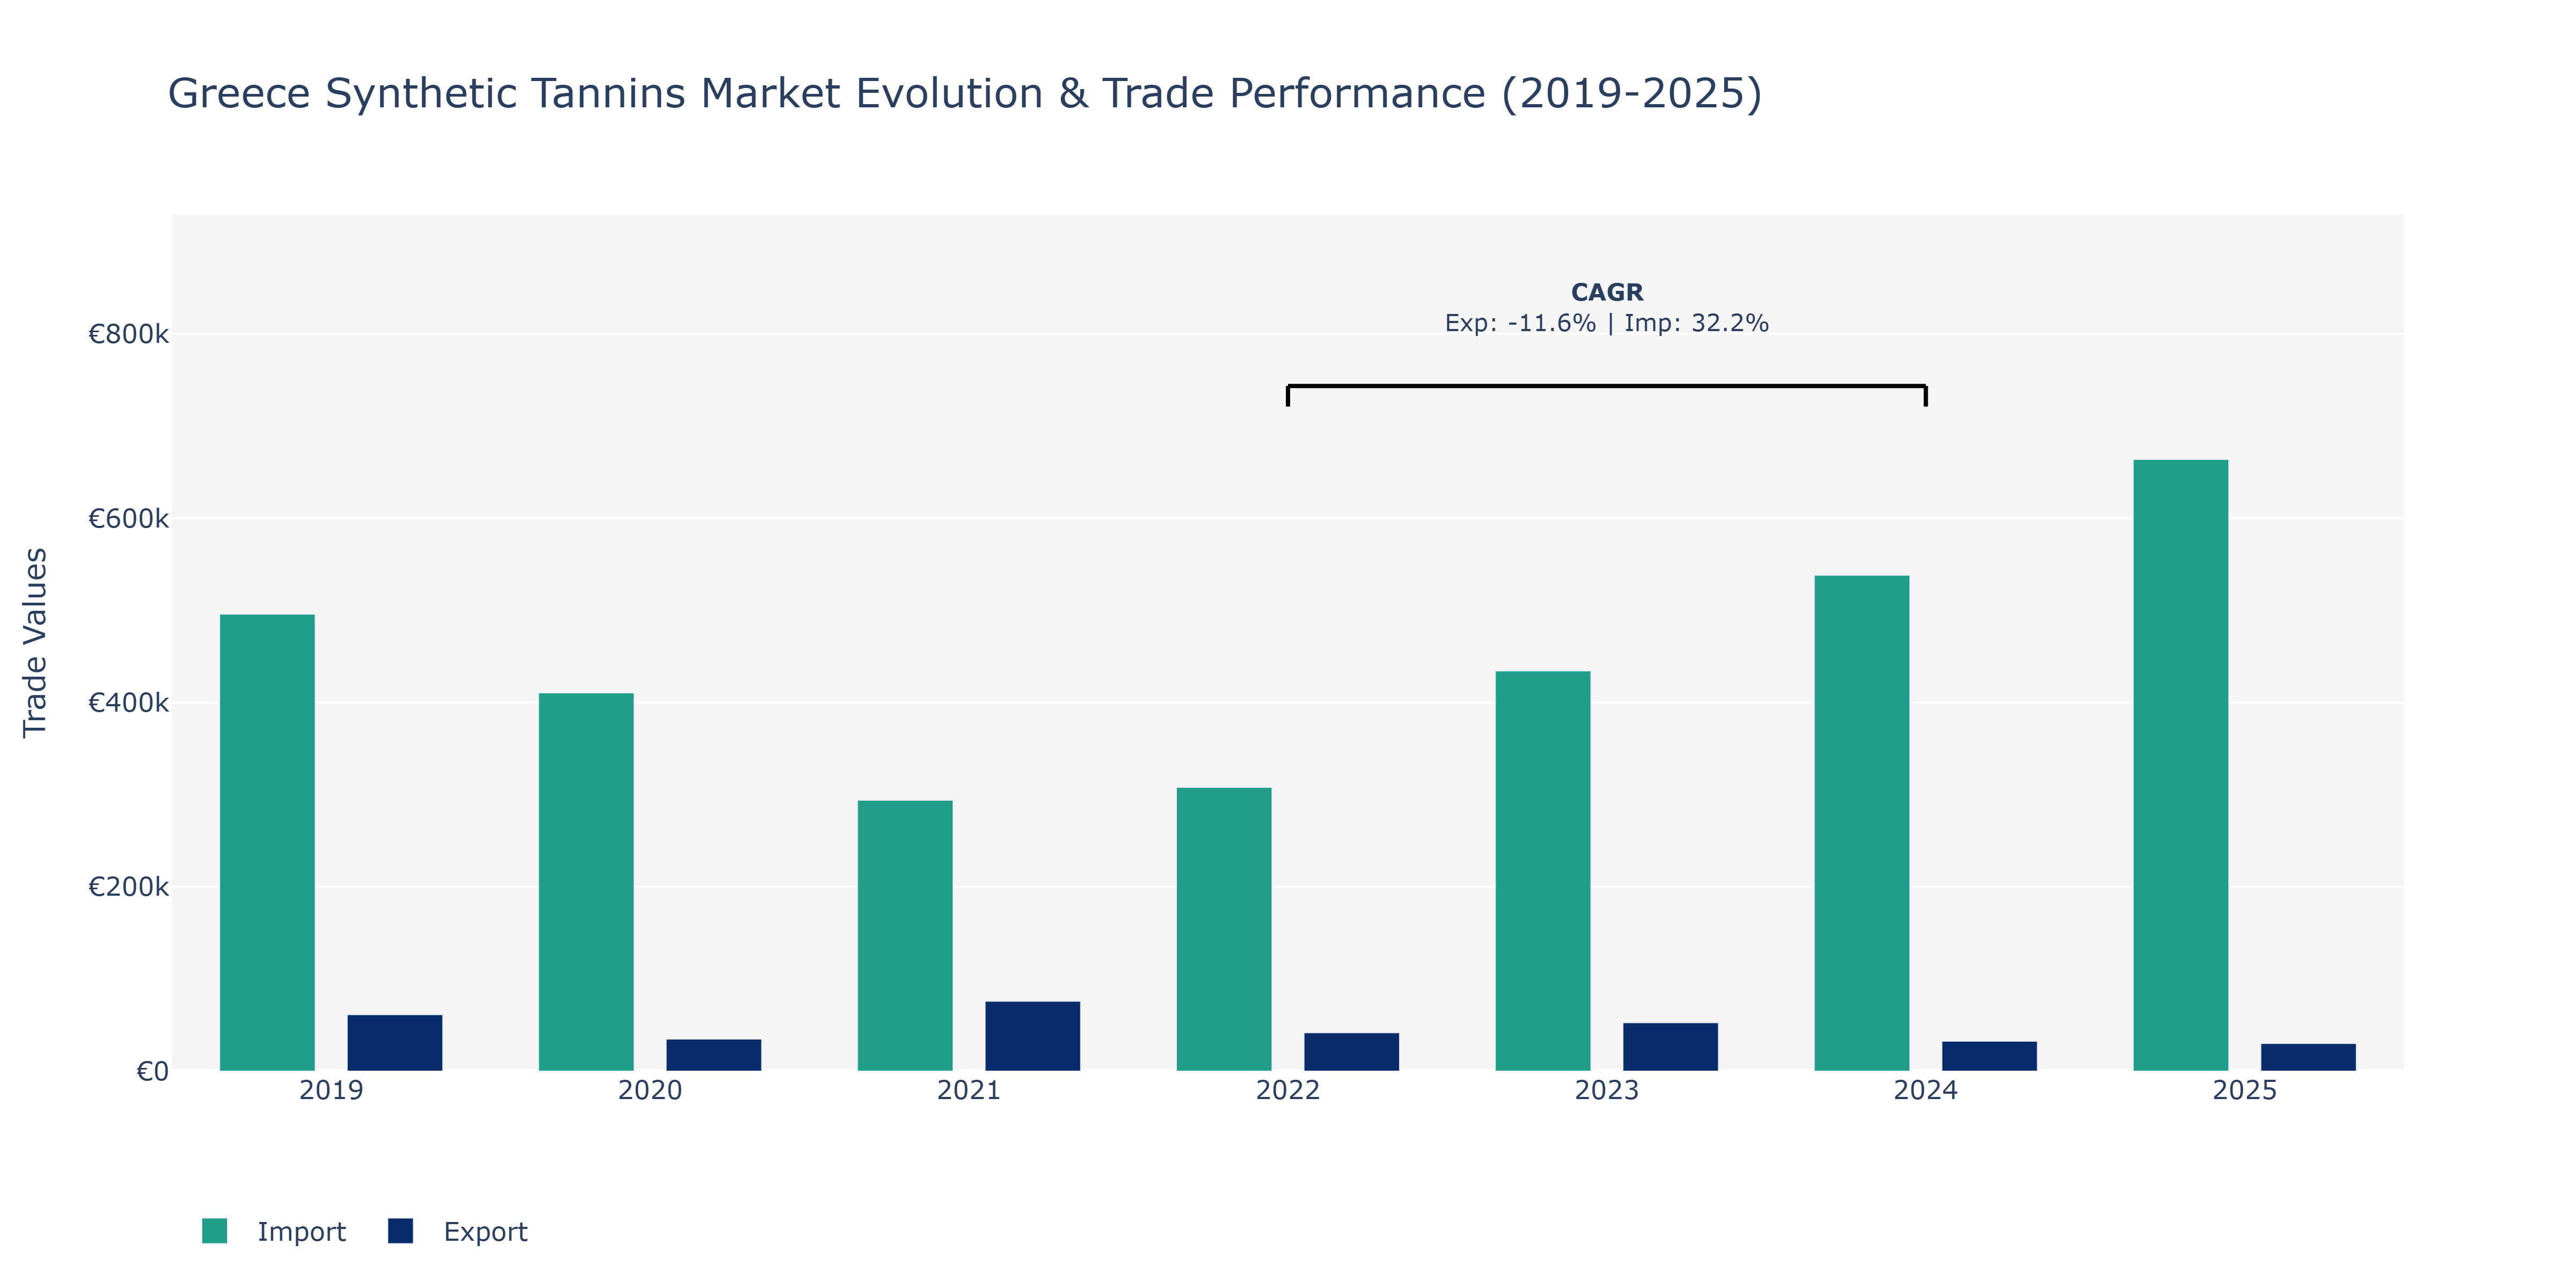
In the Greece Synthetic Tannins Market, exports showed a fluctuating trend during the period under review, starting at €61.4 thousand in 2019, dropping to €34.9 thousand in 2020, and gradually recovering to €75.94 thousand in 2021 before declining again in 2022 to €41.72 thousand. However, by 2025, exports decreased further to approximately €30.08 thousand. On the other hand, imports followed a different pattern, increasing consistently from €496.05 thousand in 2019 to €663.92 thousand in 2025, showcasing a clear upward trajectory. The peak point for imports was observed in 2025, possibly indicating growing demand for synthetic tannins in Greece. The fluctuations in exports could be attributed to varying global demand for synthetic tannins, changes in production capacities, and market competition. The increasing imports align with the industry's potential growth, suggesting Greece's reliance on foreign markets to meet domestic demand.
Key Highlights of the Report:
- Greece Synthetic Tannins Market Outlook
- Market Size of Greece Synthetic Tannins Market, 2025
- Forecast of Greece Synthetic Tannins Market, 2032
- Historical Data and Forecast of Greece Synthetic Tannins Revenues & Volume for the Period 2022-2032F
- Greece Synthetic Tannins Market Trend Evolution
- Greece Synthetic Tannins Market Drivers and Challenges
- Greece Synthetic Tannins Price Trends
- Greece Synthetic Tannins Porter's Five Forces
- Greece Synthetic Tannins Industry Life Cycle
- Historical Data and Forecast of Greece Synthetic Tannins Market Revenues & Volume By Type for the Period 2022-2032F
- Historical Data and Forecast of Greece Synthetic Tannins Market Revenues & Volume By Hydrolyzable for the Period 2022-2032F
- Historical Data and Forecast of Greece Synthetic Tannins Market Revenues & Volume By Condensed for the Period 2022-2032F
- Historical Data and Forecast of Greece Synthetic Tannins Market Revenues & Volume By Application for the Period 2022-2032F
- Historical Data and Forecast of Greece Synthetic Tannins Market Revenues & Volume By Pharmaceutical Industry for the Period 2022-2032F
- Historical Data and Forecast of Greece Synthetic Tannins Market Revenues & Volume By Food Industry for the Period 2022-2032F
- Historical Data and Forecast of Greece Synthetic Tannins Market Revenues & Volume By Paper Industry for the Period 2022-2032F
- Historical Data and Forecast of Greece Synthetic Tannins Market Revenues & Volume By Textile Industry for the Period 2022-2032F
- Historical Data and Forecast of Greece Synthetic Tannins Market Revenues & Volume By Others for the Period 2022-2032F
- Greece Synthetic Tannins Import Export Trade Statistics
- Market Opportunity Assessment By Type
- Market Opportunity Assessment By Application
- Greece Synthetic Tannins Top Companies Market Share
- Greece Synthetic Tannins Competitive Benchmarking By Technical and Operational Parameters
- Greece Synthetic Tannins Company Profiles
- Greece Synthetic Tannins Key Strategic Recommendations
Frequently Asked Questions About the Market Study (FAQs):
6Wresearch actively monitors the Greece Synthetic Tannins Market and publishes its comprehensive annual report, highlighting emerging trends, growth drivers, revenue analysis, and forecast outlook. Our insights help businesses to make data-backed strategic decisions with ongoing market dynamics. Our analysts track relevent industries related to the Greece Synthetic Tannins Market, allowing our clients with actionable intelligence and reliable forecasts tailored to emerging regional needs.
Yes, we provide customisation as per your requirements. To learn more, feel free to contact us on sales@6wresearch.com
1 Executive Summary |
2 Introduction |
2.1 Key Highlights of the Report |
2.2 Report Description |
2.3 Market Scope & Segmentation |
2.4 Research Methodology |
2.5 Assumptions |
3 Greece Synthetic Tannins Market Overview |
3.1 Greece Country Macro Economic Indicators |
3.2 Greece Synthetic Tannins Market Revenues & Volume, 2022 & 2032F |
3.3 Greece Synthetic Tannins Market - Industry Life Cycle |
3.4 Greece Synthetic Tannins Market - Porter's Five Forces |
3.5 Greece Synthetic Tannins Market Revenues & Volume Share, By Type, 2022 & 2032F |
3.6 Greece Synthetic Tannins Market Revenues & Volume Share, By Application, 2022 & 2032F |
4 Greece Synthetic Tannins Market Dynamics |
4.1 Impact Analysis |
4.2 Market Drivers |
4.2.1 Growing demand for environmentally friendly tanning agents |
4.2.2 Increasing adoption of synthetic tannins in the leather industry |
4.2.3 Rising awareness about the benefits of synthetic tannins over traditional tanning agents |
4.3 Market Restraints |
4.3.1 Fluctuating prices of raw materials used in synthetic tannin production |
4.3.2 Regulatory challenges related to the use of synthetic chemicals in tanning processes |
4.3.3 Competition from alternative tanning agents such as vegetable tannins |
5 Greece Synthetic Tannins Market Trends |
6 Greece Synthetic Tannins Market, By Types |
6.1 Greece Synthetic Tannins Market, By Type |
6.1.1 Overview and Analysis |
6.1.2 Greece Synthetic Tannins Market Revenues & Volume, By Type, 2022-2032F |
6.1.3 Greece Synthetic Tannins Market Revenues & Volume, By Hydrolyzable, 2022-2032F |
6.1.4 Greece Synthetic Tannins Market Revenues & Volume, By Condensed, 2022-2032F |
6.2 Greece Synthetic Tannins Market, By Application |
6.2.1 Overview and Analysis |
6.2.2 Greece Synthetic Tannins Market Revenues & Volume, By Pharmaceutical Industry, 2022-2032F |
6.2.3 Greece Synthetic Tannins Market Revenues & Volume, By Food Industry, 2022-2032F |
6.2.4 Greece Synthetic Tannins Market Revenues & Volume, By Paper Industry, 2022-2032F |
6.2.5 Greece Synthetic Tannins Market Revenues & Volume, By Textile Industry, 2022-2032F |
6.2.6 Greece Synthetic Tannins Market Revenues & Volume, By Others, 2022-2032F |
7 Greece Synthetic Tannins Market Import-Export Trade Statistics |
7.1 Greece Synthetic Tannins Market Export to Major Countries |
7.2 Greece Synthetic Tannins Market Imports from Major Countries |
8 Greece Synthetic Tannins Market Key Performance Indicators |
8.1 Environmental impact indicators (e.g., carbon footprint, water usage) |
8.2 Adoption rate of synthetic tannins in the leather industry |
8.3 Research and development investments in improving synthetic tannin formulations |
9 Greece Synthetic Tannins Market - Opportunity Assessment |
9.1 Greece Synthetic Tannins Market Opportunity Assessment, By Type, 2022 & 2032F |
9.2 Greece Synthetic Tannins Market Opportunity Assessment, By Application, 2022 & 2032F |
10 Greece Synthetic Tannins Market - Competitive Landscape |
10.1 Greece Synthetic Tannins Market Revenue Share, By Companies, 2025 |
10.2 Greece Synthetic Tannins Market Competitive Benchmarking, By Operating and Technical Parameters |
11 Company Profiles |
12 Recommendations |
13 Disclaimer |
Global Go To Market Strategy - 2030
Export potential enables firms to identify high-growth global markets with greater confidence by combining advanced trade intelligence with a structured quantitative methodology. The framework analyzes emerging demand trends and country-level import patterns while integrating macroeconomic and trade datasets such as GDP and population forecasts, bilateral import–export flows, tariff structures, elasticity differentials between developed and developing economies, geographic distance, and import demand projections. Using weighted trade values from 2020–2024 as the base period to project country-to-country export potential for 2030, these inputs are operationalized through calculated drivers such as gravity model parameters, tariff impact factors, and projected GDP per-capita growth. Through an analysis of hidden potentials, demand hotspots, and market conditions that are most favorable to success, this method enables firms to focus on target countries, maximize returns, and global expansion with data, backed by accuracy.
By factoring in the projected importer demand gap that is currently unmet and could be potential opportunity, it identifies the potential for the Exporter (Country) among 190 countries, against the general trade analysis, which identifies the biggest importer or exporter.
To discover high-growth global markets and optimize your business strategy:
Click Here
Pricing
- Single User License$ 1,995
- Department License$ 2,400
- Site License$ 3,120
- Global License$ 3,795

Leadership Perspectives from Industry Events
Search
Thought Leadership and Analyst Meet


Our Clients
6WResearch In News
- Doha a strategic location for EV manufacturing hub: IPA Qatar
- Demand for luxury TVs surging in the GCC, says Samsung
- Empowering Growth: The Thriving Journey of Bangladesh’s Cable Industry
- Demand for luxury TVs surging in the GCC, says Samsung
- Video call with a traditional healer? Once unthinkable, it’s now common in South Africa
- Intelligent Buildings To Smooth GCC’s Path To Net Zero
Latest Reports
- Taiwan Airport Wireless Infrastructure Market (2026-2032)
- Vietnam Airport Wireless Infrastructure Market (2026-2032)
- Thailand Airport Wireless Infrastructure Market (2026-2032)
- South Korea Airport Wireless Infrastructure Market (2026-2032)
- Romania Airport Wireless Infrastructure Market (2026-2032)
- Qatar Airport Wireless Infrastructure Market (2026-2032)
- Philippines Airport Wireless Infrastructure Market (2026-2032)
- Japan Airport Wireless Infrastructure Market (2026-2032)
- Taiwan Airport Winter Services Market (2026-2032)
- Vietnam Airport Winter Services Market (2026-2032)
Industry Events and Analyst Meet

HIMTEX 2026

India Refining Summit 2026

India EV Show 2026

EV tech India Expo 2026

Auto Tech Asia 2026
Whitepaper
- Middle East & Africa Commercial Security Market Click here to view more.
- Middle East & Africa Fire Safety Systems & Equipment Market Click here to view more.
- GCC Drone Market Click here to view more.
- Middle East Lighting Fixture Market Click here to view more.
- GCC Physical & Perimeter Security Market Click here to view more.