Greece Wood Tar Market (2026-2032) | Outlook, Size, Value, Segmentation, Trends, Industry, Companies, Share, Analysis, Growth, Forecast & Revenue
Market Forecast By Type (Resinous Wood Tar, Hardwood Tar), By Production Type (Carbonization, Destructive Distillation), By Application (Construction Coatings, Animal Husbandry, Ship Coatings, Pharmaceuticals, Metallurgy, Others) And Competitive Landscape
| Product Code: ETC5333870 | Publication Date: Nov 2023 | Updated Date: Apr 2026 | Product Type: Market Research Report | |
| Publisher: 6Wresearch | Author: Ravi Bhandari | No. of Pages: 60 | No. of Figures: 30 | No. of Tables: 5 |
Greece Wood Tar Market Size (2020-2030)
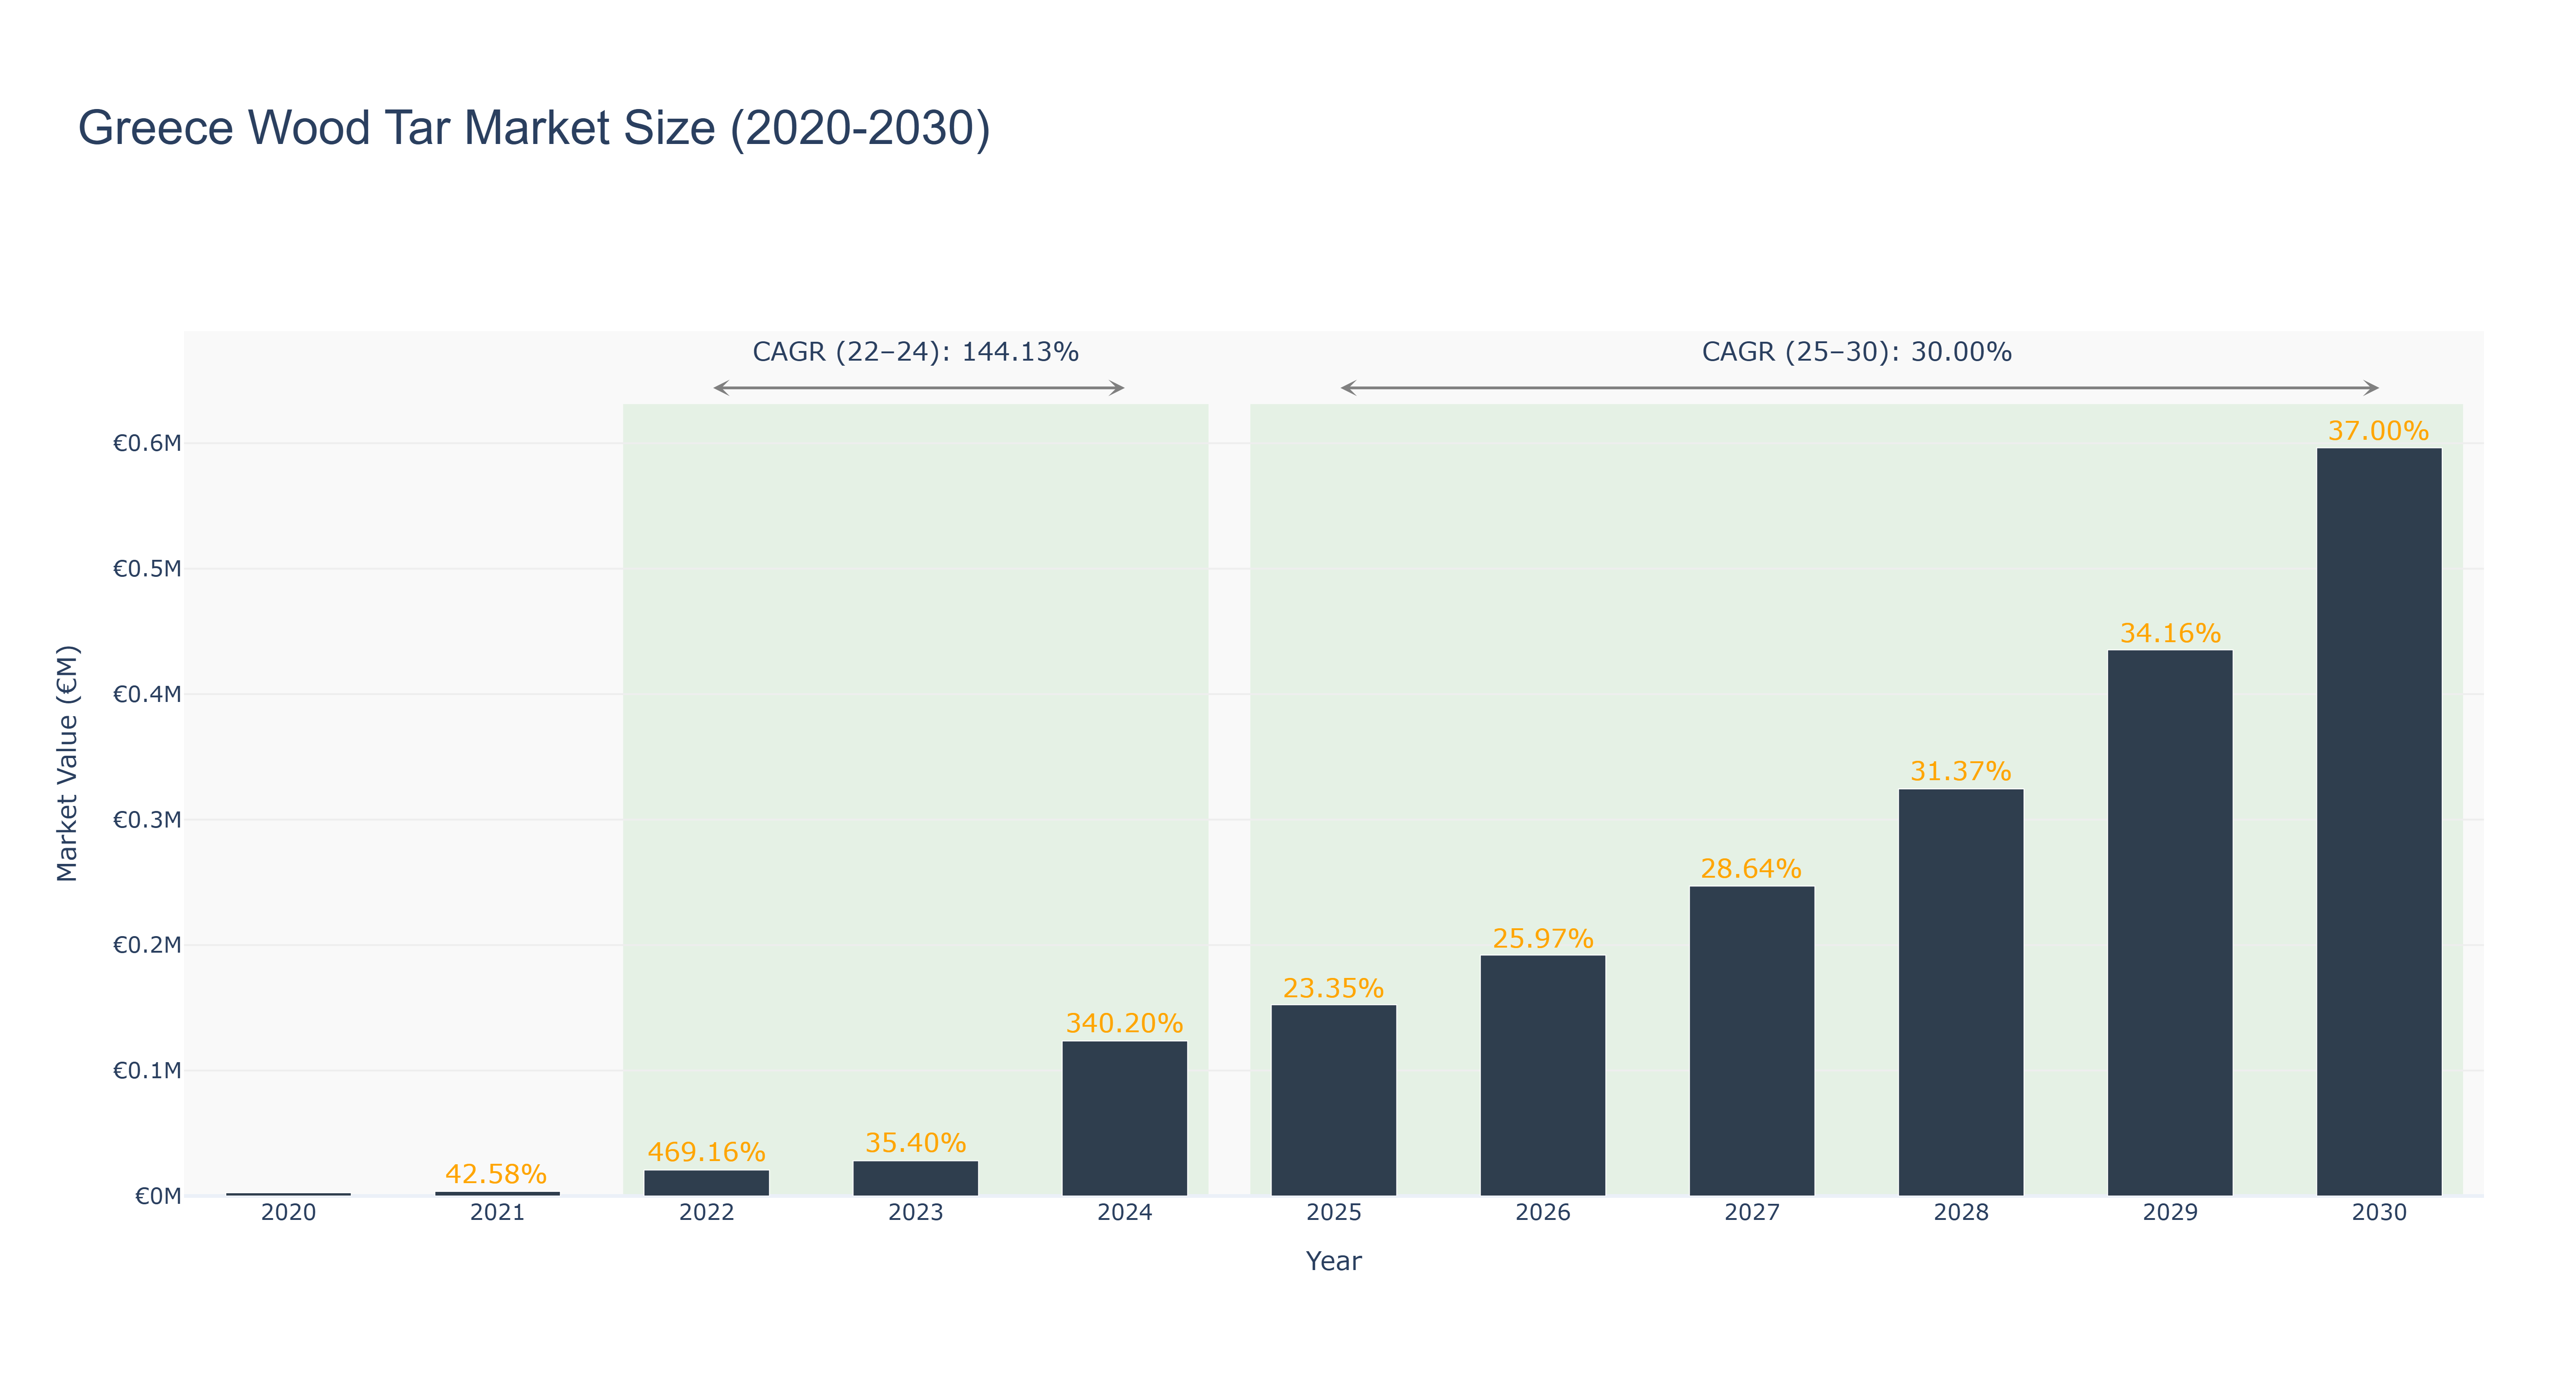
The Greece Wood Tar Market has shown significant growth over the past decade. The peak market size of €0.60 million was reached in 2030, with a steady increase from €0.02 million in 2022. The market is forecasted to continue its growth trajectory, with a CAGR of 30.0% from 2025 to 2030. The CAGR for the period 2022-24 was an impressive 144.13%. This growth can be attributed to increasing demand for wood tar products in various industries, such as pharmaceuticals and cosmetics. Recent developments in the market include increased investment in sustainable wood tar extraction methods, aiming to meet the growing demand while ensuring environmental sustainability. The future looks promising for the Greece Wood Tar Market, with ongoing projects focused on expanding market reach and product innovation to cater to evolving consumer preferences.
Greece Wood Tar Market: Production & Trade Performance (2019-2025)
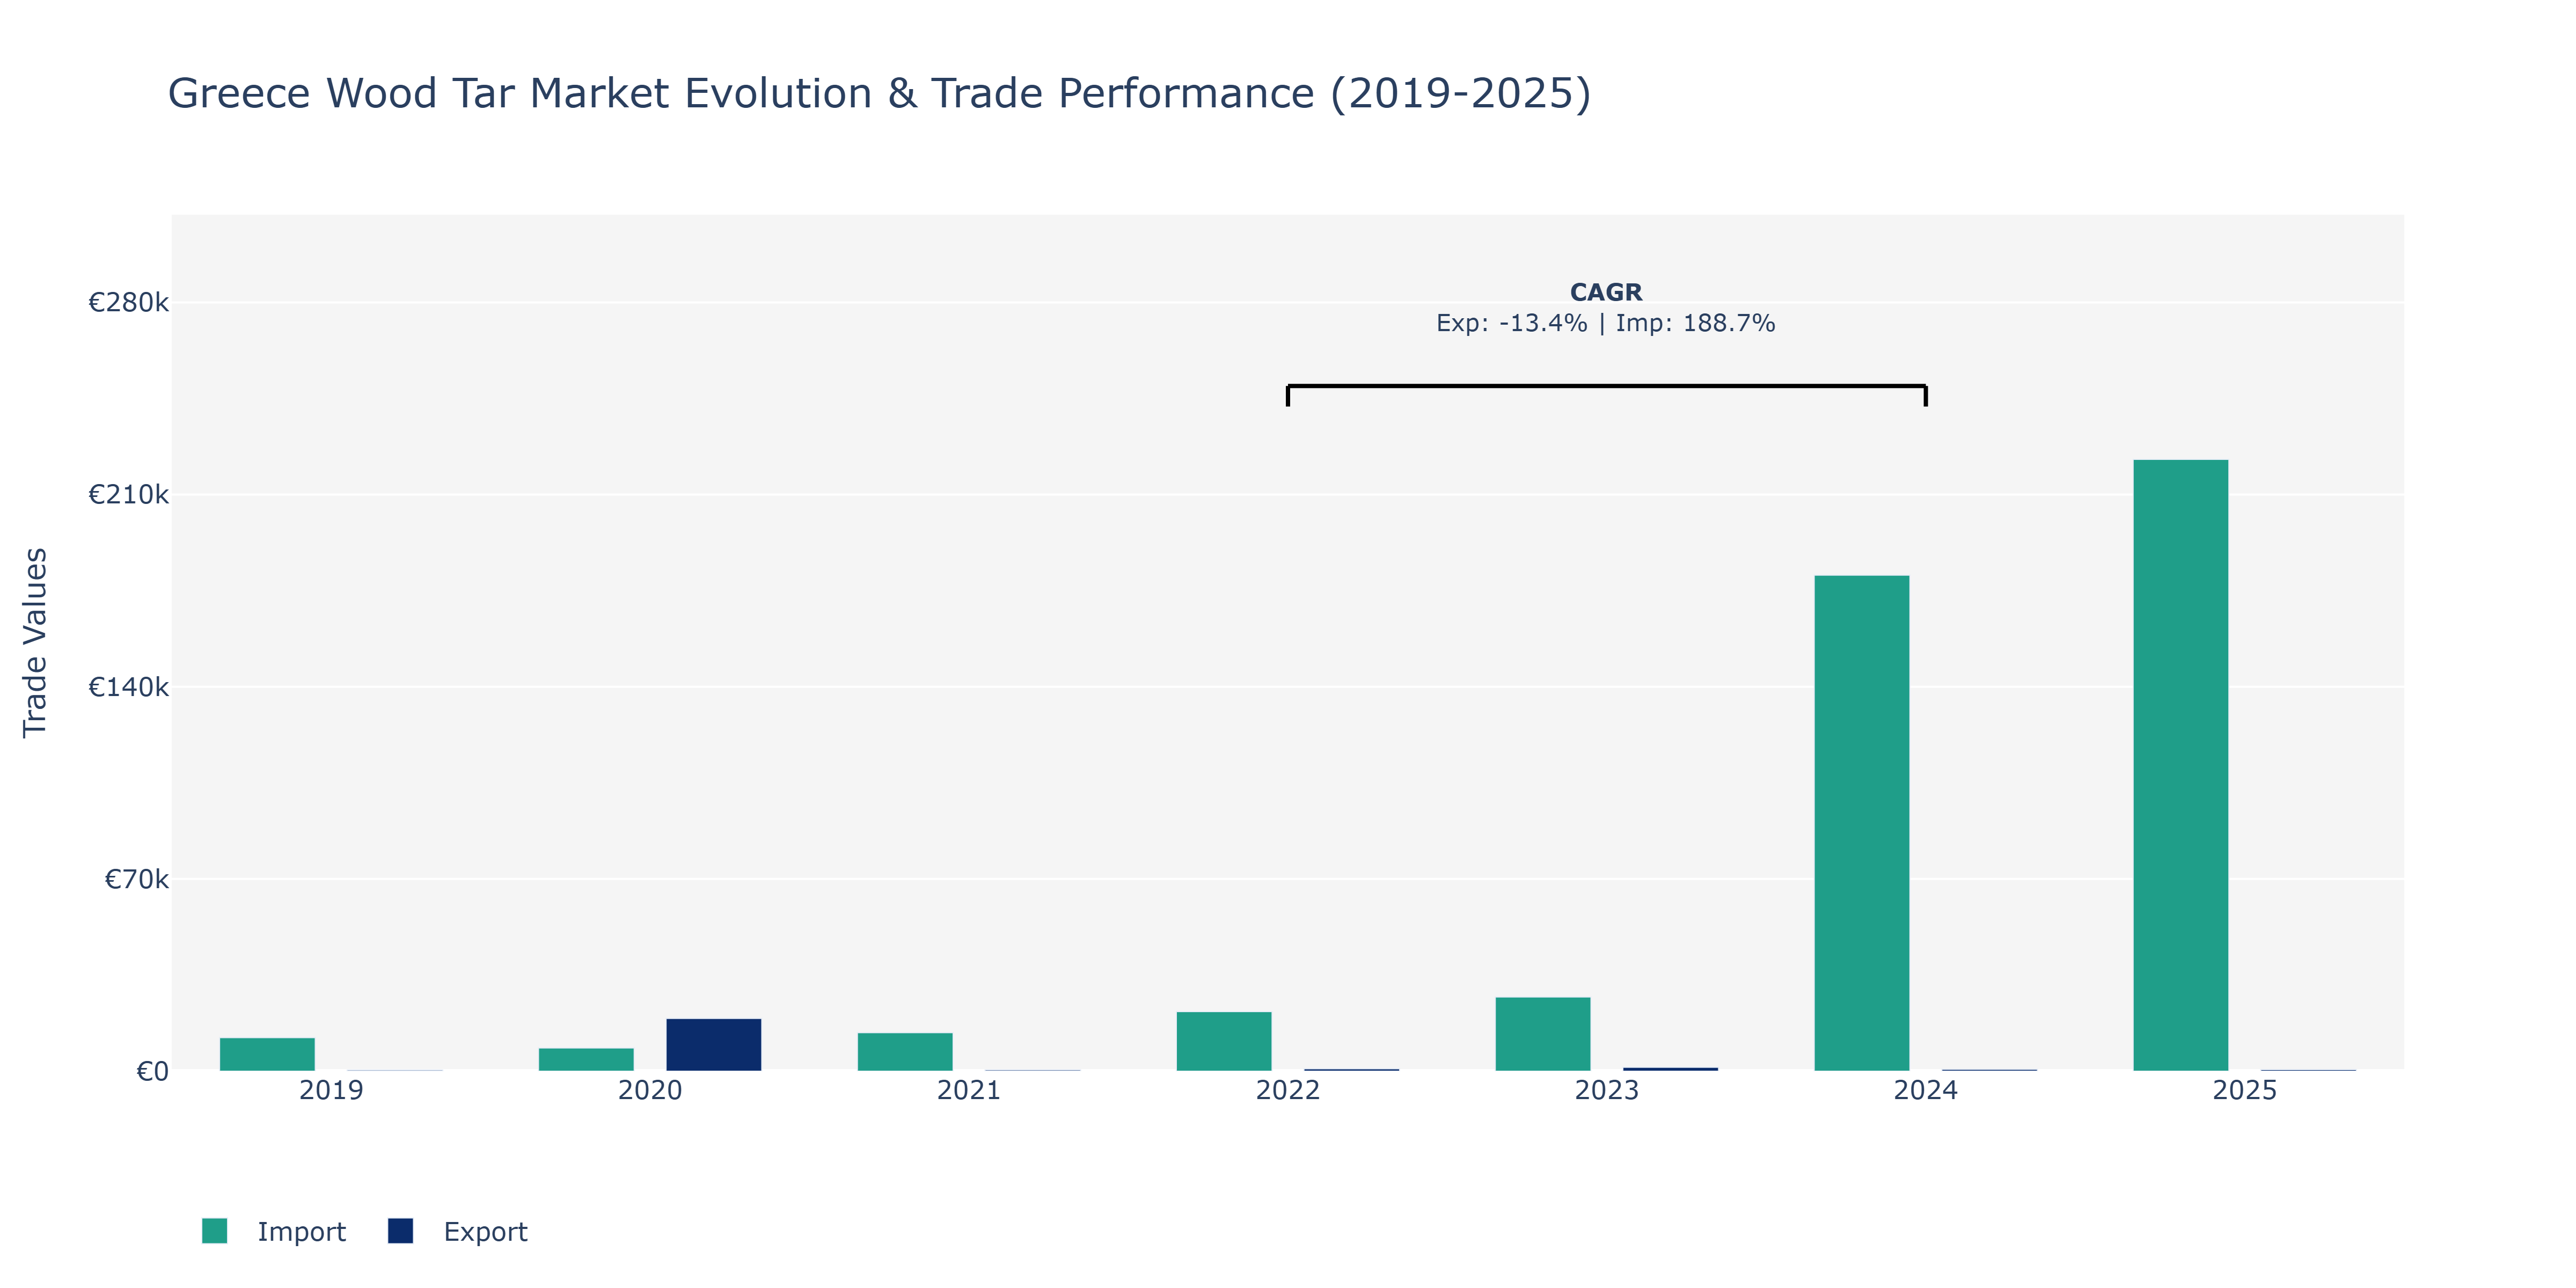
In the Greece Wood Tar Market, from 2019 to 2025, both Exports and Imports experienced notable fluctuations. In 2020, Exports surged to €19.21 thousand, a substantial increase from the previous year's €460, likely due to increased international demand or new market penetration strategies. Similarly, Imports peaked in 2025 at €222.82 thousand, reflecting a consistent upward trend since 2019, possibly driven by higher domestic consumption or expanding industrial activities requiring wood tar. The sharp decline in Exports in 2021 to €477 might be attributed to temporary market factors or disruptions in the supply chain, which could have impacted production capacities or trade agreements. Conversely, the remarkable growth in Imports from 2022 to 2025, reaching €180.63 thousand in 2024 and €222.82 thousand in 2025, could signify growing reliance on foreign sources for wood tar due to domestic supply constraints or quality considerations, aligning with the substantial 188.72% CAGR observed for this period. Such fluctuations emphasize the importance of market resilience and strategic planning in navigating dynamic trade environments within the wood tar industry.
Key Highlights of the Report:
- Greece Wood Tar Market Outlook
- Market Size of Greece Wood Tar Market, 2025
- Forecast of Greece Wood Tar Market, 2032
- Historical Data and Forecast of Greece Wood Tar Revenues & Volume for the Period 2022-2032F
- Greece Wood Tar Market Trend Evolution
- Greece Wood Tar Market Drivers and Challenges
- Greece Wood Tar Price Trends
- Greece Wood Tar Porter`s Five Forces
- Greece Wood Tar Industry Life Cycle
- Historical Data and Forecast of Greece Wood Tar Market Revenues & Volume By Type for the Period 2022-2032F
- Historical Data and Forecast of Greece Wood Tar Market Revenues & Volume By Resinous Wood Tar for the Period 2022-2032F
- Historical Data and Forecast of Greece Wood Tar Market Revenues & Volume By Hardwood Tar for the Period 2022-2032F
- Historical Data and Forecast of Greece Wood Tar Market Revenues & Volume By Production Type for the Period 2022-2032F
- Historical Data and Forecast of Greece Wood Tar Market Revenues & Volume By Carbonization for the Period 2022-2032F
- Historical Data and Forecast of Greece Wood Tar Market Revenues & Volume By Destructive Distillation for the Period 2022-2032F
- Historical Data and Forecast of Greece Wood Tar Market Revenues & Volume By Application for the Period 2022-2032F
- Historical Data and Forecast of Greece Wood Tar Market Revenues & Volume By Construction Coatings for the Period 2022-2032F
- Historical Data and Forecast of Greece Wood Tar Market Revenues & Volume By Animal Husbandry for the Period 2022-2032F
- Historical Data and Forecast of Greece Wood Tar Market Revenues & Volume By Ship Coatings for the Period 2022-2032F
- Historical Data and Forecast of Greece Wood Tar Market Revenues & Volume By Pharmaceuticals for the Period 2022-2032F
- Historical Data and Forecast of Greece Wood Tar Market Revenues & Volume By Metallurgy for the Period 2022-2032F
- Historical Data and Forecast of Greece Wood Tar Market Revenues & Volume By Others for the Period 2022-2032F
- Greece Wood Tar Import Export Trade Statistics
- Market Opportunity Assessment By Type
- Market Opportunity Assessment By Production Type
- Market Opportunity Assessment By Application
- Greece Wood Tar Top Companies Market Share
- Greece Wood Tar Competitive Benchmarking By Technical and Operational Parameters
- Greece Wood Tar Company Profiles
- Greece Wood Tar Key Strategic Recommendations
Frequently Asked Questions About the Market Study (FAQs):
6Wresearch actively monitors the Greece Wood Tar Market and publishes its comprehensive annual report, highlighting emerging trends, growth drivers, revenue analysis, and forecast outlook. Our insights help businesses to make data-backed strategic decisions with ongoing market dynamics. Our analysts track relevent industries related to the Greece Wood Tar Market, allowing our clients with actionable intelligence and reliable forecasts tailored to emerging regional needs.
Yes, we provide customisation as per your requirements. To learn more, feel free to contact us on sales@6wresearch.com
1 Executive Summary |
2 Introduction |
2.1 Key Highlights of the Report |
2.2 Report Description |
2.3 Market Scope & Segmentation |
2.4 Research Methodology |
2.5 Assumptions |
3 Greece Wood Tar Market Overview |
3.1 Greece Country Macro Economic Indicators |
3.2 Greece Wood Tar Market Revenues & Volume, 2022 & 2032F |
3.3 Greece Wood Tar Market - Industry Life Cycle |
3.4 Greece Wood Tar Market - Porter's Five Forces |
3.5 Greece Wood Tar Market Revenues & Volume Share, By Type, 2022 & 2032F |
3.6 Greece Wood Tar Market Revenues & Volume Share, By Production Type, 2022 & 2032F |
3.7 Greece Wood Tar Market Revenues & Volume Share, By Application, 2022 & 2032F |
4 Greece Wood Tar Market Dynamics |
4.1 Impact Analysis |
4.2 Market Drivers |
4.2.1 Increasing demand for eco-friendly and sustainable products |
4.2.2 Growth in the construction and infrastructure development sector |
4.2.3 Rising popularity of natural and herbal products |
4.3 Market Restraints |
4.3.1 Fluctuating prices of raw materials |
4.3.2 Intense competition from synthetic alternatives |
4.3.3 Stringent regulations and compliance requirements |
5 Greece Wood Tar Market Trends |
6 Greece Wood Tar Market Segmentations |
6.1 Greece Wood Tar Market, By Type |
6.1.1 Overview and Analysis |
6.1.2 Greece Wood Tar Market Revenues & Volume, By Resinous Wood Tar, 2022-2032F |
6.1.3 Greece Wood Tar Market Revenues & Volume, By Hardwood Tar, 2022-2032F |
6.2 Greece Wood Tar Market, By Production Type |
6.2.1 Overview and Analysis |
6.2.2 Greece Wood Tar Market Revenues & Volume, By Carbonization, 2022-2032F |
6.2.3 Greece Wood Tar Market Revenues & Volume, By Destructive Distillation, 2022-2032F |
6.3 Greece Wood Tar Market, By Application |
6.3.1 Overview and Analysis |
6.3.2 Greece Wood Tar Market Revenues & Volume, By Construction Coatings, 2022-2032F |
6.3.3 Greece Wood Tar Market Revenues & Volume, By Animal Husbandry, 2022-2032F |
6.3.4 Greece Wood Tar Market Revenues & Volume, By Ship Coatings, 2022-2032F |
6.3.5 Greece Wood Tar Market Revenues & Volume, By Pharmaceuticals, 2022-2032F |
6.3.6 Greece Wood Tar Market Revenues & Volume, By Metallurgy, 2022-2032F |
6.3.7 Greece Wood Tar Market Revenues & Volume, By Others, 2022-2032F |
7 Greece Wood Tar Market Import-Export Trade Statistics |
7.1 Greece Wood Tar Market Export to Major Countries |
7.2 Greece Wood Tar Market Imports from Major Countries |
8 Greece Wood Tar Market Key Performance Indicators |
8.1 Average selling price of wood tar products |
8.2 Number of new product developments using wood tar |
8.3 Percentage of market share held by wood tar products |
8.4 Customer satisfaction ratings for wood tar products |
8.5 Number of partnerships or collaborations in the wood tar industry |
9 Greece Wood Tar Market - Opportunity Assessment |
9.1 Greece Wood Tar Market Opportunity Assessment, By Type, 2022 & 2032F |
9.2 Greece Wood Tar Market Opportunity Assessment, By Production Type, 2022 & 2032F |
9.3 Greece Wood Tar Market Opportunity Assessment, By Application, 2022 & 2032F |
10 Greece Wood Tar Market - Competitive Landscape |
10.1 Greece Wood Tar Market Revenue Share, By Companies, 2025 |
10.2 Greece Wood Tar Market Competitive Benchmarking, By Operating and Technical Parameters |
11 Company Profiles |
12 Recommendations | 13 Disclaimer |
Export potential assessment - trade Analytics for 2030
Export potential enables firms to identify high-growth global markets with greater confidence by combining advanced trade intelligence with a structured quantitative methodology. The framework analyzes emerging demand trends and country-level import patterns while integrating macroeconomic and trade datasets such as GDP and population forecasts, bilateral import–export flows, tariff structures, elasticity differentials between developed and developing economies, geographic distance, and import demand projections. Using weighted trade values from 2020–2024 as the base period to project country-to-country export potential for 2030, these inputs are operationalized through calculated drivers such as gravity model parameters, tariff impact factors, and projected GDP per-capita growth. Through an analysis of hidden potentials, demand hotspots, and market conditions that are most favorable to success, this method enables firms to focus on target countries, maximize returns, and global expansion with data, backed by accuracy.
By factoring in the projected importer demand gap that is currently unmet and could be potential opportunity, it identifies the potential for the Exporter (Country) among 190 countries, against the general trade analysis, which identifies the biggest importer or exporter.
To discover high-growth global markets and optimize your business strategy:
Click Here
Pricing
- Single User License$ 1,995
- Department License$ 2,400
- Site License$ 3,120
- Global License$ 3,795

Search
Thought Leadership and Analyst Meet


Our Clients
Latest Reports
- Canada Cloud CFD Market (2026-2032) | Size & Revenue, Industry, Growth, Competitive Landscape, Forecast, Segmentation, Value, Outlook, Trends, Share, Analysis, Companies
- Taiwan Food Delivery Platform Market (2026-2032) | Companies, Outlook, Analysis, Trends, Value, Revenue, Segmentation, Share, Forecast, Competitive Landscape, Growth, Size & Forecast
- United Kingdom (UK) Long-term Care Insurance Market (2026-2032) | Growth, Share, Consumer Insights, Drivers, Opportunities, Competition, Pricing Analysis, Segments, Restraints, Companies, Competitive, Value, Outlook, Size, Demand, Analysis, Challenges, Strategic Insights, Investment Trends, Revenue, Trends, Supply, Forecast
- United Kingdom (UK) Long Term Care Market (2026-2032) | Companies, Outlook, Analysis, Trends, Value, Revenue, Segmentation, Share, Forecast, Competitive Landscape, Growth, Size & Forecast
- Iraq Insulation and Waterproofing Market (2026-2032) | Outlook, Drivers, Growth, Size, Share, Industry, Revenue, Trends, Demand, Competitive, Strategic Insights, Opportunities, Segments, Companies, Challenges, Strategy, Consumer Insights, Analysis, Investment Trends, Value, Segmentation, Forecast, Restraints
- India Switchgear Market Outlook (2026-2032) | Size, Share, Trends, Growth, Revenue, Forecast, Analysis, Value, Outlook
- Pakistan Contraceptive Implants Market (2025-2031) | Demand, Growth, Size, Share, Industry, Pricing Analysis, Competitive, Strategic Insights, Strategy, Consumer Insights, Analysis, Investment Trends, Opportunities, Revenue, Segments, Value, Segmentation, Supply, Forecast, Restraints, Outlook, Competition, Drivers, Trends, Companies, Challenges
- Sri Lanka Packaging Market (2026-2032) | Outlook, Competition, Drivers, Trends, Demand, Pricing Analysis, Competitive, Strategic Insights, Companies, Challenges, Strategy, Consumer Insights, Analysis, Investment Trends, Opportunities, Growth, Size, Share, Industry, Revenue, Segments, Value, Segmentation, Supply, Forecast, Restraints
- India Kids Watches Market (2026-2032) | Strategy, Consumer Insights, Analysis, Investment Trends, Opportunities, Growth, Size, Share, Industry, Revenue, Segments, Value, Segmentation, Supply, Forecast, Restraints, Outlook, Competition, Drivers, Trends, Demand, Pricing Analysis, Competitive, Strategic Insights, Companies, Challenges
- Saudi Arabia Core Assurance Service Market (2025-2031) | Strategy, Consumer Insights, Analysis, Investment Trends, Opportunities, Growth, Size, Share, Industry, Revenue, Segments, Value, Segmentation, Supply, Forecast, Restraints, Outlook, Competition, Drivers, Trends, Demand, Pricing Analysis, Competitive, Strategic Insights, Companies, Challenges
Industry Events and Analyst Meet

India EV Show 2026

EV tech India Expo 2026

Auto Tech Asia 2026

Battery Tech India 2026

Smart Production Solutions Guangzhou 2026
Whitepaper
- Middle East & Africa Commercial Security Market Click here to view more.
- Middle East & Africa Fire Safety Systems & Equipment Market Click here to view more.
- GCC Drone Market Click here to view more.
- Middle East Lighting Fixture Market Click here to view more.
- GCC Physical & Perimeter Security Market Click here to view more.
6WResearch In News
- Doha a strategic location for EV manufacturing hub: IPA Qatar
- Demand for luxury TVs surging in the GCC, says Samsung
- Empowering Growth: The Thriving Journey of Bangladesh’s Cable Industry
- Demand for luxury TVs surging in the GCC, says Samsung
- Video call with a traditional healer? Once unthinkable, it’s now common in South Africa
- Intelligent Buildings To Smooth GCC’s Path To Net Zero