Guatemala Dried Processed Food Market (2026-2032) | Size & Revenue, Competitive Landscape, Trends, Outlook, Forecast, Segmentation, Industry, Analysis, Companies, Share, Value, Growth
Market Forecast By Drying Technology (Freeze Dried, Spray Dried, Sun Dried, Hot Air Dried, Vacuum Dried, Others), By Product Types (Dry Pasta And Noodles, Dry Soups, Dry Prepared Foods, Dessert Mixes, More), By Distribution Channels (Convenience Stores, Retail Stores, Hypermarkets/Supermarkets, Online, Others) And Competitive Landscape
| Product Code: ETC7390583 | Publication Date: Sep 2024 | Updated Date: Apr 2026 | Product Type: Market Research Report | |
| Publisher: 6Wresearch | Author: Sumit Sagar | No. of Pages: 75 | No. of Figures: 35 | No. of Tables: 20 |
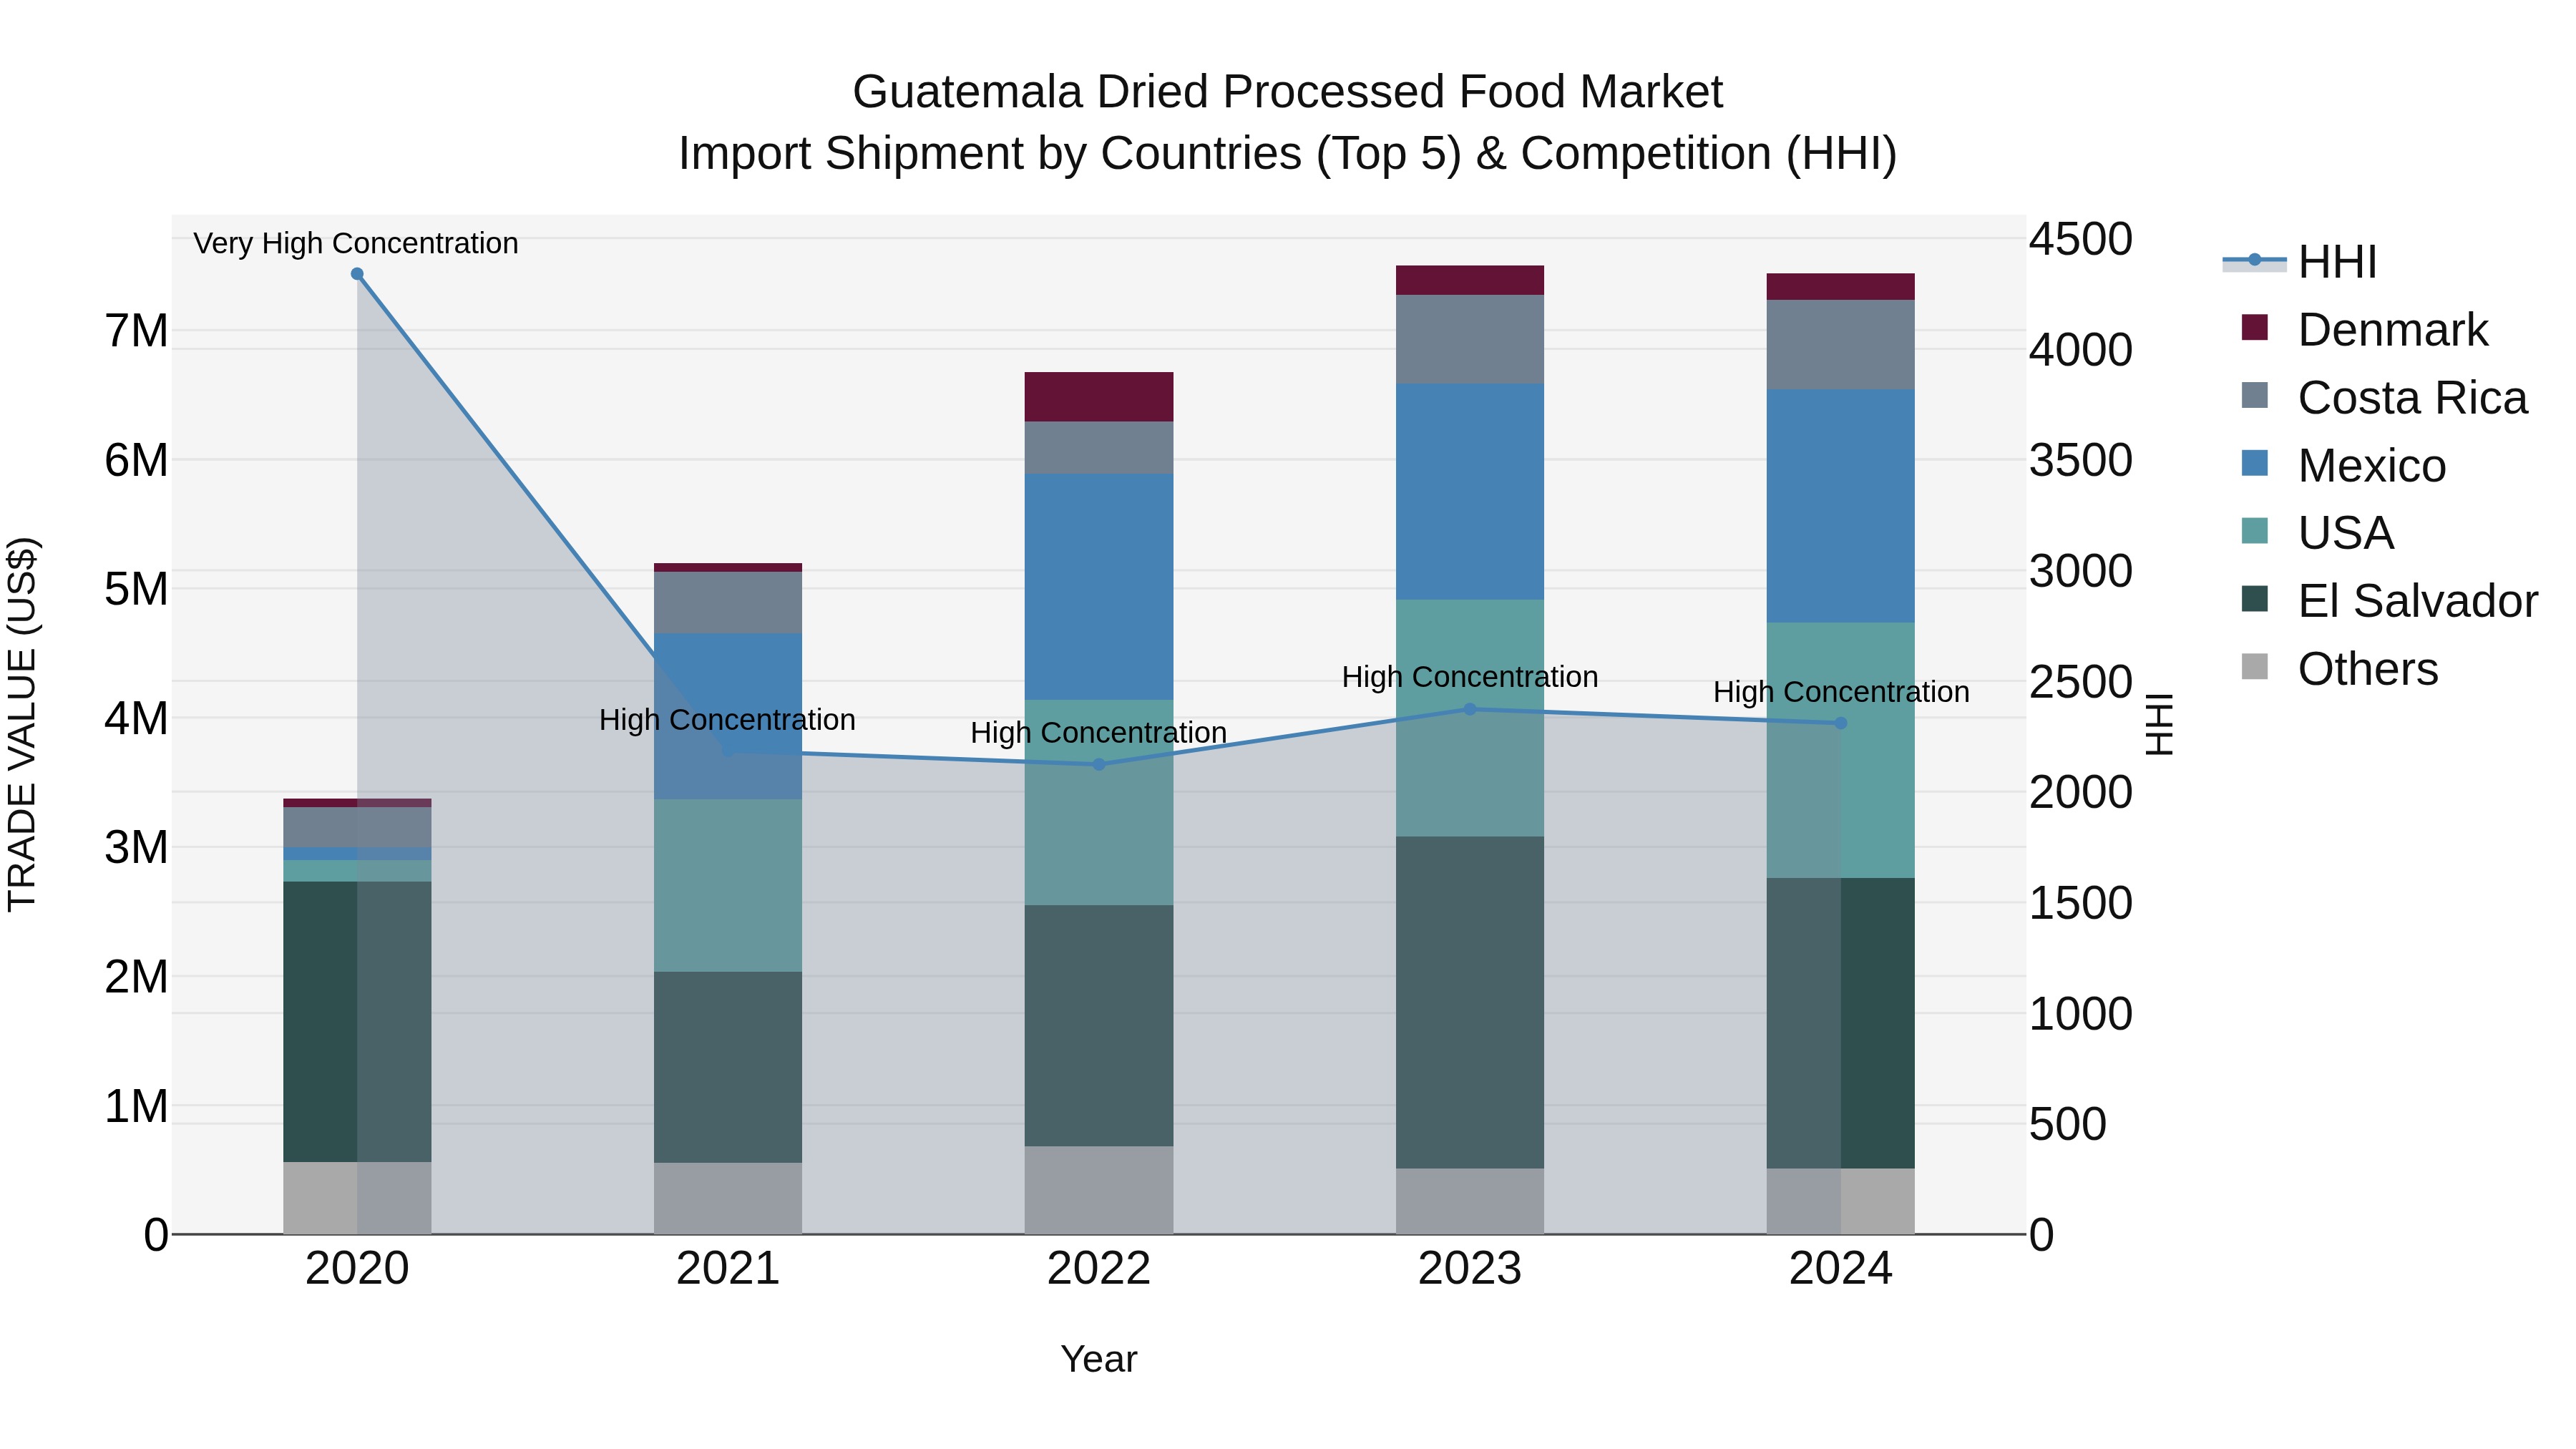
Guatemala Dried Processed Food Market Top 5 Importing Countries and Market Competition (HHI) Analysis
Guatemala continues to see a strong demand for dried processed food imports, with key exporting countries including El Salvador, USA, Mexico, Costa Rica, and Denmark. The market shows high concentration levels, as indicated by the Herfindahl-Hirschman Index (HHI). Despite a slight decline in growth rate from 2023 to 2024, the compound annual growth rate (CAGR) for the period 2020-2024 remains impressive at 21.88%. This suggests a sustained interest in dried processed foods in Guatemala, with opportunities for both local and international suppliers to capitalize on this growing market.
Key Highlights of the Report:
- Guatemala Dried Processed Food Market Outlook
- Market Size of Guatemala Dried Processed Food Market, 2025
- Forecast of Guatemala Dried Processed Food Market, 2032
- Historical Data and Forecast of Guatemala Dried Processed Food Revenues & Volume for the Period 2022 - 2032
- Guatemala Dried Processed Food Market Trend Evolution
- Guatemala Dried Processed Food Market Drivers and Challenges
- Guatemala Dried Processed Food Price Trends
- Guatemala Dried Processed Food Porter's Five Forces
- Guatemala Dried Processed Food Industry Life Cycle
- Historical Data and Forecast of Guatemala Dried Processed Food Market Revenues & Volume By Drying Technology for the Period 2022 - 2032
- Historical Data and Forecast of Guatemala Dried Processed Food Market Revenues & Volume By Freeze Dried for the Period 2022 - 2032
- Historical Data and Forecast of Guatemala Dried Processed Food Market Revenues & Volume By Spray Dried for the Period 2022 - 2032
- Historical Data and Forecast of Guatemala Dried Processed Food Market Revenues & Volume By Sun Dried for the Period 2022 - 2032
- Historical Data and Forecast of Guatemala Dried Processed Food Market Revenues & Volume By Hot Air Dried for the Period 2022 - 2032
- Historical Data and Forecast of Guatemala Dried Processed Food Market Revenues & Volume By Vacuum Dried for the Period 2022 - 2032
- Historical Data and Forecast of Guatemala Dried Processed Food Market Revenues & Volume By Others for the Period 2022 - 2032
- Historical Data and Forecast of Guatemala Dried Processed Food Market Revenues & Volume By Product Types for the Period 2022 - 2032
- Historical Data and Forecast of Guatemala Dried Processed Food Market Revenues & Volume By Dry Pasta And Noodles for the Period 2022 - 2032
- Historical Data and Forecast of Guatemala Dried Processed Food Market Revenues & Volume By Dry Soups for the Period 2022 - 2032
- Historical Data and Forecast of Guatemala Dried Processed Food Market Revenues & Volume By Dry Prepared Foods for the Period 2022 - 2032
- Historical Data and Forecast of Guatemala Dried Processed Food Market Revenues & Volume By Dessert Mixes for the Period 2022 - 2032
- Historical Data and Forecast of Guatemala Dried Processed Food Market Revenues & Volume By More for the Period 2022 - 2032
- Historical Data and Forecast of Guatemala Dried Processed Food Market Revenues & Volume By Distribution Channels for the Period 2022 - 2032
- Historical Data and Forecast of Guatemala Dried Processed Food Market Revenues & Volume By Convenience Stores for the Period 2022 - 2032
- Historical Data and Forecast of Guatemala Dried Processed Food Market Revenues & Volume By Retail Stores for the Period 2022 - 2032
- Historical Data and Forecast of Guatemala Dried Processed Food Market Revenues & Volume By Hypermarkets/Supermarkets for the Period 2022 - 2032
- Historical Data and Forecast of Guatemala Dried Processed Food Market Revenues & Volume By Online for the Period 2022 - 2032
- Historical Data and Forecast of Guatemala Dried Processed Food Market Revenues & Volume By Others for the Period 2022 - 2032
- Guatemala Dried Processed Food Import Export Trade Statistics
- Market Opportunity Assessment By Drying Technology
- Market Opportunity Assessment By Product Types
- Market Opportunity Assessment By Distribution Channels
- Guatemala Dried Processed Food Top Companies Market Share
- Guatemala Dried Processed Food Competitive Benchmarking By Technical and Operational Parameters
- Guatemala Dried Processed Food Company Profiles
- Guatemala Dried Processed Food Key Strategic Recommendations
Frequently Asked Questions About the Market Study (FAQs):
6Wresearch actively monitors the Guatemala Dried Processed Food Market and publishes its comprehensive annual report, highlighting emerging trends, growth drivers, revenue analysis, and forecast outlook. Our insights help businesses to make data-backed strategic decisions with ongoing market dynamics. Our analysts track relevent industries related to the Guatemala Dried Processed Food Market, allowing our clients with actionable intelligence and reliable forecasts tailored to emerging regional needs.
Yes, we provide customisation as per your requirements. To learn more, feel free to contact us on sales@6wresearch.com
1 Executive Summary |
2 Introduction |
2.1 Key Highlights of the Report |
2.2 Report Description |
2.3 Market Scope & Segmentation |
2.4 Research Methodology |
2.5 Assumptions |
3 Guatemala Dried Processed Food Market Overview |
3.1 Guatemala Country Macro Economic Indicators |
3.2 Guatemala Dried Processed Food Market Revenues & Volume, 2022 & 2032F |
3.3 Guatemala Dried Processed Food Market - Industry Life Cycle |
3.4 Guatemala Dried Processed Food Market - Porter's Five Forces |
3.5 Guatemala Dried Processed Food Market Revenues & Volume Share, By Drying Technology, 2022 & 2032F |
3.6 Guatemala Dried Processed Food Market Revenues & Volume Share, By Product Types, 2022 & 2032F |
3.7 Guatemala Dried Processed Food Market Revenues & Volume Share, By Distribution Channels, 2022 & 2032F |
4 Guatemala Dried Processed Food Market Dynamics |
4.1 Impact Analysis |
4.2 Market Drivers |
4.2.1 Increasing consumer demand for convenient and shelf-stable food products |
4.2.2 Growing awareness about the benefits of dried processed foods in terms of nutrition and longer shelf life |
4.2.3 Expansion of distribution channels, including e-commerce, making dried processed foods more accessible |
4.3 Market Restraints |
4.3.1 Fluctuating prices of raw materials such as fruits, vegetables, and grains, impacting production costs |
4.3.2 Intense competition among manufacturers leading to price wars and margin pressures |
4.3.3 Concerns regarding the use of additives, preservatives, and artificial ingredients in some dried processed foods, affecting consumer trust |
5 Guatemala Dried Processed Food Market Trends |
6 Guatemala Dried Processed Food Market, By Types |
6.1 Guatemala Dried Processed Food Market, By Drying Technology |
6.1.1 Overview and Analysis |
6.1.2 Guatemala Dried Processed Food Market Revenues & Volume, By Drying Technology, 2022 - 2032F |
6.1.3 Guatemala Dried Processed Food Market Revenues & Volume, By Freeze Dried, 2022 - 2032F |
6.1.4 Guatemala Dried Processed Food Market Revenues & Volume, By Spray Dried, 2022 - 2032F |
6.1.5 Guatemala Dried Processed Food Market Revenues & Volume, By Sun Dried, 2022 - 2032F |
6.1.6 Guatemala Dried Processed Food Market Revenues & Volume, By Hot Air Dried, 2022 - 2032F |
6.1.7 Guatemala Dried Processed Food Market Revenues & Volume, By Vacuum Dried, 2022 - 2032F |
6.1.8 Guatemala Dried Processed Food Market Revenues & Volume, By Others, 2022 - 2032F |
6.2 Guatemala Dried Processed Food Market, By Product Types |
6.2.1 Overview and Analysis |
6.2.2 Guatemala Dried Processed Food Market Revenues & Volume, By Dry Pasta And Noodles, 2022 - 2032F |
6.2.3 Guatemala Dried Processed Food Market Revenues & Volume, By Dry Soups, 2022 - 2032F |
6.2.4 Guatemala Dried Processed Food Market Revenues & Volume, By Dry Prepared Foods, 2022 - 2032F |
6.2.5 Guatemala Dried Processed Food Market Revenues & Volume, By Dessert Mixes, 2022 - 2032F |
6.2.6 Guatemala Dried Processed Food Market Revenues & Volume, By More, 2022 - 2032F |
6.3 Guatemala Dried Processed Food Market, By Distribution Channels |
6.3.1 Overview and Analysis |
6.3.2 Guatemala Dried Processed Food Market Revenues & Volume, By Convenience Stores, 2022 - 2032F |
6.3.3 Guatemala Dried Processed Food Market Revenues & Volume, By Retail Stores, 2022 - 2032F |
6.3.4 Guatemala Dried Processed Food Market Revenues & Volume, By Hypermarkets/Supermarkets, 2022 - 2032F |
6.3.5 Guatemala Dried Processed Food Market Revenues & Volume, By Online, 2022 - 2032F |
6.3.6 Guatemala Dried Processed Food Market Revenues & Volume, By Others, 2022 - 2032F |
7 Guatemala Dried Processed Food Market Import-Export Trade Statistics |
7.1 Guatemala Dried Processed Food Market Export to Major Countries |
7.2 Guatemala Dried Processed Food Market Imports from Major Countries |
8 Guatemala Dried Processed Food Market Key Performance Indicators |
8.1 Consumer engagement with digital marketing campaigns promoting dried processed foods |
8.2 Percentage of repeat purchases indicating customer loyalty and satisfaction |
8.3 Growth in the number of retail outlets stocking a variety of dried processed food products |
8.4 Rate of new product development and innovation in the dried processed food segment |
8.5 Consumer surveys measuring perception and acceptance of dried processed foods |
9 Guatemala Dried Processed Food Market - Opportunity Assessment |
9.1 Guatemala Dried Processed Food Market Opportunity Assessment, By Drying Technology, 2022 & 2032F |
9.2 Guatemala Dried Processed Food Market Opportunity Assessment, By Product Types, 2022 & 2032F |
9.3 Guatemala Dried Processed Food Market Opportunity Assessment, By Distribution Channels, 2022 & 2032F |
10 Guatemala Dried Processed Food Market - Competitive Landscape |
10.1 Guatemala Dried Processed Food Market Revenue Share, By Companies, 2025 |
10.2 Guatemala Dried Processed Food Market Competitive Benchmarking, By Operating and Technical Parameters |
11 Company Profiles |
12 Recommendations |
13 Disclaimer |
Global Go To Market Strategy - 2030
Export potential enables firms to identify high-growth global markets with greater confidence by combining advanced trade intelligence with a structured quantitative methodology. The framework analyzes emerging demand trends and country-level import patterns while integrating macroeconomic and trade datasets such as GDP and population forecasts, bilateral import–export flows, tariff structures, elasticity differentials between developed and developing economies, geographic distance, and import demand projections. Using weighted trade values from 2020–2024 as the base period to project country-to-country export potential for 2030, these inputs are operationalized through calculated drivers such as gravity model parameters, tariff impact factors, and projected GDP per-capita growth. Through an analysis of hidden potentials, demand hotspots, and market conditions that are most favorable to success, this method enables firms to focus on target countries, maximize returns, and global expansion with data, backed by accuracy.
By factoring in the projected importer demand gap that is currently unmet and could be potential opportunity, it identifies the potential for the Exporter (Country) among 190 countries, against the general trade analysis, which identifies the biggest importer or exporter.
To discover high-growth global markets and optimize your business strategy:
Click Here
Pricing
- Single User License$ 1,995
- Department License$ 2,400
- Site License$ 3,120
- Global License$ 3,795

Leadership Perspectives from Industry Events
Search
Thought Leadership and Analyst Meet


Our Clients
6WResearch In News
- Doha a strategic location for EV manufacturing hub: IPA Qatar
- Demand for luxury TVs surging in the GCC, says Samsung
- Empowering Growth: The Thriving Journey of Bangladesh’s Cable Industry
- Demand for luxury TVs surging in the GCC, says Samsung
- Video call with a traditional healer? Once unthinkable, it’s now common in South Africa
- Intelligent Buildings To Smooth GCC’s Path To Net Zero
Latest Reports
- Taiwan Airport Wireless Infrastructure Market (2026-2032)
- Vietnam Airport Wireless Infrastructure Market (2026-2032)
- Thailand Airport Wireless Infrastructure Market (2026-2032)
- South Korea Airport Wireless Infrastructure Market (2026-2032)
- Romania Airport Wireless Infrastructure Market (2026-2032)
- Qatar Airport Wireless Infrastructure Market (2026-2032)
- Philippines Airport Wireless Infrastructure Market (2026-2032)
- Japan Airport Wireless Infrastructure Market (2026-2032)
- Taiwan Airport Winter Services Market (2026-2032)
- Vietnam Airport Winter Services Market (2026-2032)
Industry Events and Analyst Meet

HIMTEX 2026

India Refining Summit 2026

India EV Show 2026

EV tech India Expo 2026

Auto Tech Asia 2026
Whitepaper
- Middle East & Africa Commercial Security Market Click here to view more.
- Middle East & Africa Fire Safety Systems & Equipment Market Click here to view more.
- GCC Drone Market Click here to view more.
- Middle East Lighting Fixture Market Click here to view more.
- GCC Physical & Perimeter Security Market Click here to view more.