Guyana Glass Bottle Market (2025-2031) | Size, Outlook, Forecast, Value, Growth, Segmentation, Companies, Trends, Analysis, Revenue, Share & Industry
Market Forecast By Filament Type (Moulded, Tubular), By Application (Beverage, Food, Cosmetics, Pharmaceutical, Other) And Competitive Landscape
| Product Code: ETC5527768 | Publication Date: Nov 2023 | Updated Date: Aug 2025 | Product Type: Market Research Report | |
| Publisher: 6Wresearch | Author: Vasudha | No. of Pages: 60 | No. of Figures: 30 | No. of Tables: 5 |
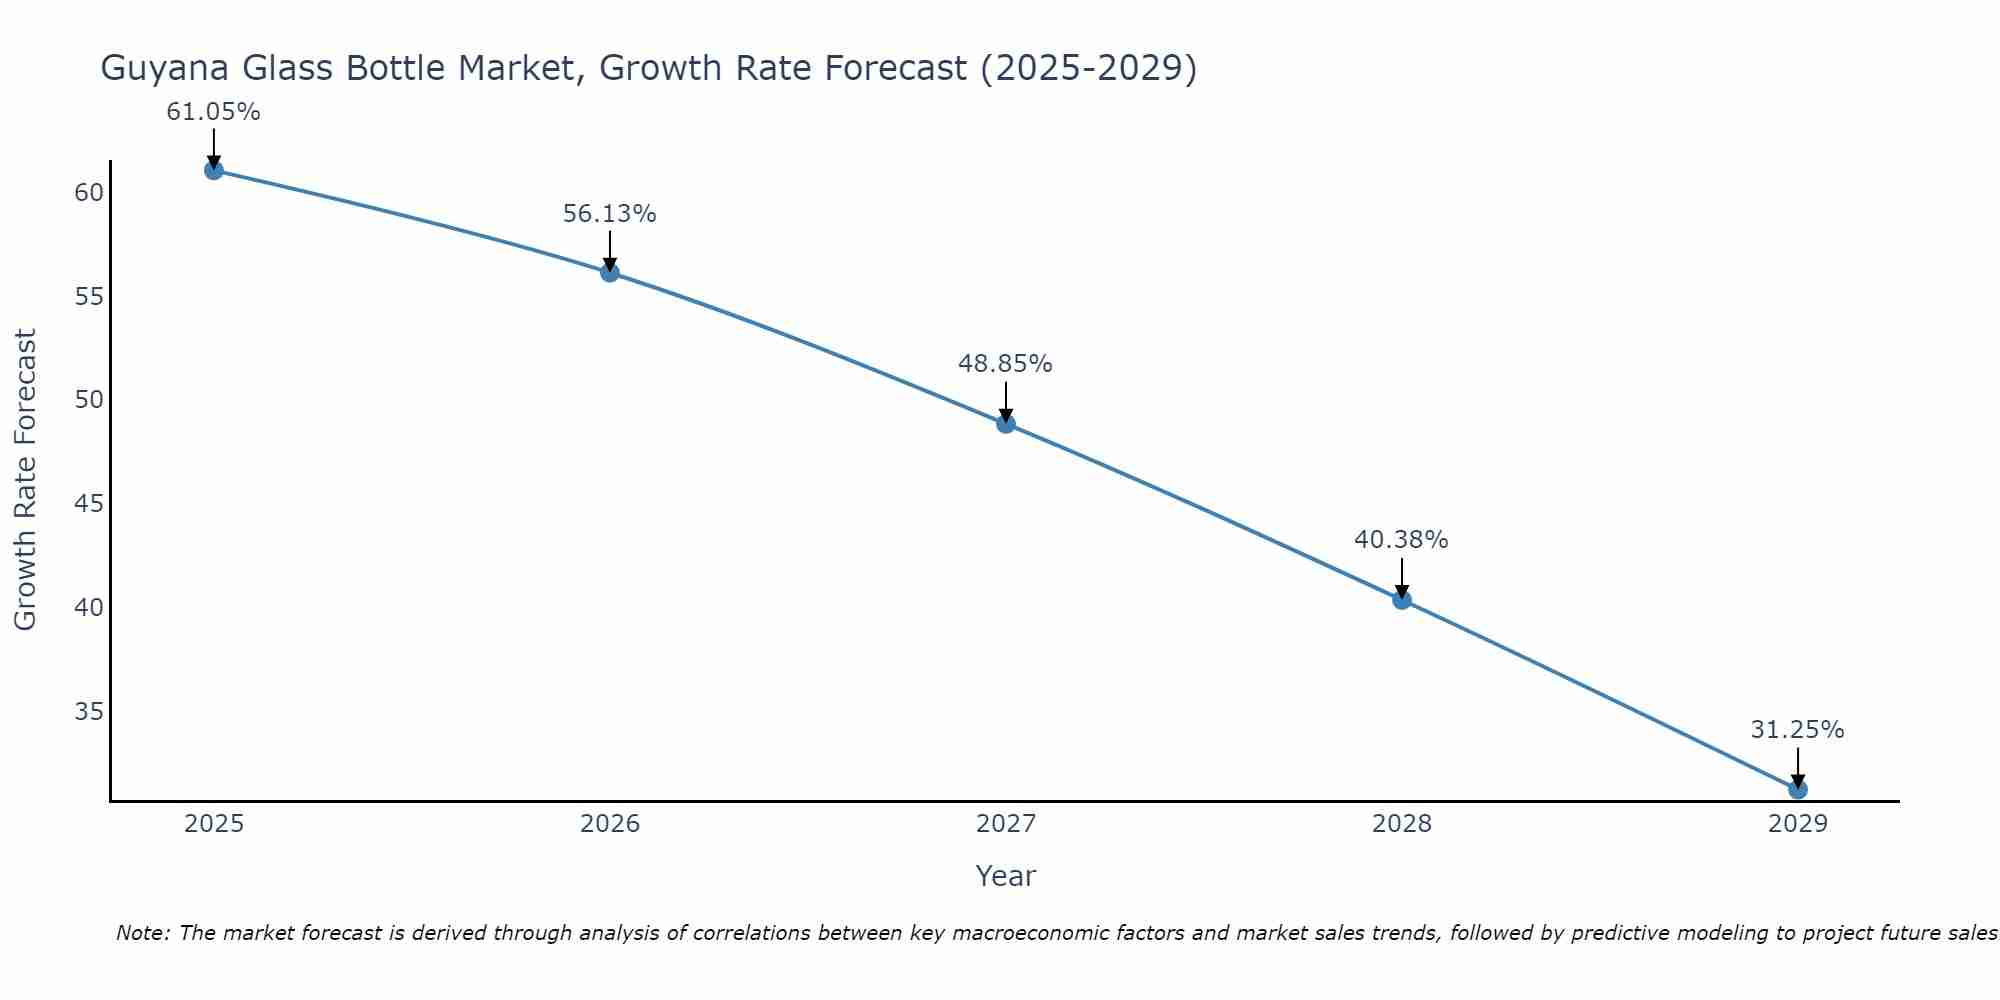
Guyana Glass Bottle Market Size Growth Rate
The Guyana Glass Bottle Market may undergo a gradual slowdown in growth rates between 2025 and 2029. Although the growth rate starts strong at 61.05% in 2025, it steadily loses momentum, ending at 31.25% by 2029.
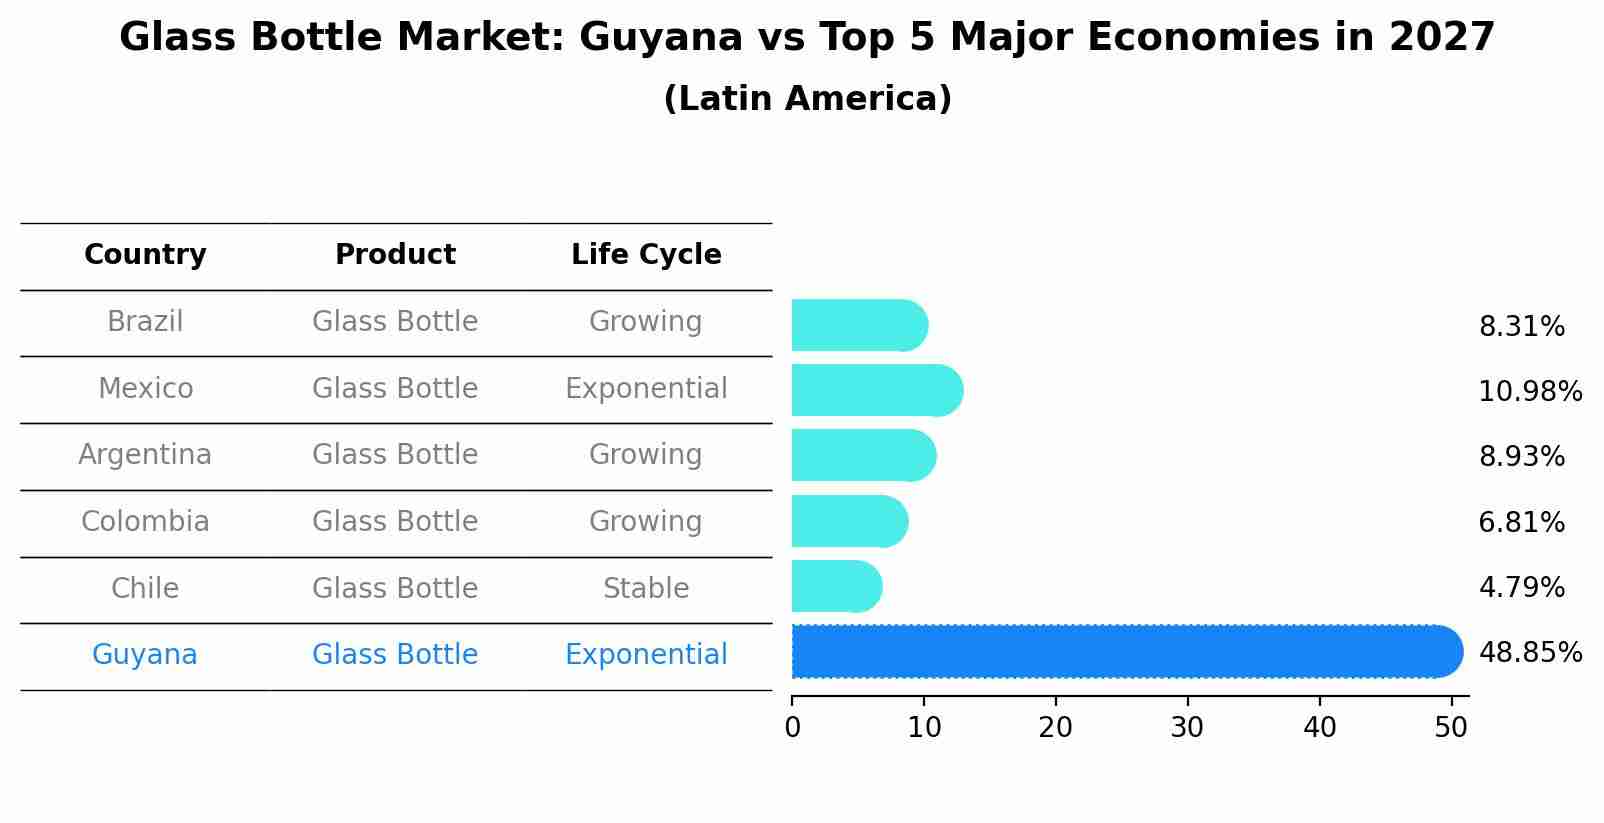
Glass Bottle Market: Guyana vs Top 5 Major Economies in 2027 (Latin America)
In the Latin America region, the Glass Bottle market in Guyana is projected to expand at a exponential growth rate of 48.85% by 2027. The largest economy is Brazil, followed by Mexico, Argentina, Colombia and Chile.
Guyana Glass Bottle Market Overview
The glass bottle market in Guyana is experiencing steady growth due to rising demand from the beverage and pharmaceutical sectors. The push for sustainable packaging has also boosted the appeal of glass bottles as an eco-friendly alternative. With increasing investments in manufacturing and recycling facilities, the market is poised for expansion. However, high production costs and competition from plastic packaging pose challenges to local manufacturers.
Drivers of the market
The Guyana glass bottle market is primarily driven by the rising consumption of beverages, particularly premium and health-oriented drinks. Glass bottles are increasingly favored due to their sustainability, ability to preserve the quality and taste of beverages, and their recyclable nature. With growing environmental concerns, both consumers and businesses are opting for glass over plastic, pushing the demand for glass bottles. Moreover, the trend toward eco-friendly packaging, especially in the beverage industry, is anticipated to drive growth in the market.
Challenges of the market
The glass bottle market in Guyana is affected by high production and transportation costs, primarily due to the import of raw materials and the lack of a local manufacturing base for glass bottles. This leads to higher prices for end consumers, reducing demand. Moreover, environmental concerns regarding glass waste management, as well as increasing competition from plastic alternatives, create challenges for the market. The market also suffers from limited recycling infrastructure, which further escalates the issue of environmental sustainability.
Government Policy of the market
Government policies in Guyana favor the local manufacturing of glass products, including glass bottles, through fiscal incentives like tax holidays and subsidies on raw materials. The government has introduced regulations aimed at reducing plastic usage, promoting the shift to glass packaging. Import duties on certain raw materials are reduced to encourage domestic production, especially in the context of sustainable packaging alternatives.
Key Highlights of the Report:
- Guyana Glass Bottle Market Outlook
- Market Size of Guyana Glass Bottle Market, 2024
- Forecast of Guyana Glass Bottle Market, 2031
- Historical Data and Forecast of Guyana Glass Bottle Revenues & Volume for the Period 2021-2031
- Guyana Glass Bottle Market Trend Evolution
- Guyana Glass Bottle Market Drivers and Challenges
- Guyana Glass Bottle Price Trends
- Guyana Glass Bottle Porter`s Five Forces
- Guyana Glass Bottle Industry Life Cycle
- Historical Data and Forecast of Guyana Glass Bottle Market Revenues & Volume By Filament Type for the Period 2021-2031
- Historical Data and Forecast of Guyana Glass Bottle Market Revenues & Volume By Moulded for the Period 2021-2031
- Historical Data and Forecast of Guyana Glass Bottle Market Revenues & Volume By Tubular for the Period 2021-2031
- Historical Data and Forecast of Guyana Glass Bottle Market Revenues & Volume By Application for the Period 2021-2031
- Historical Data and Forecast of Guyana Glass Bottle Market Revenues & Volume By Beverage for the Period 2021-2031
- Historical Data and Forecast of Guyana Glass Bottle Market Revenues & Volume By Food for the Period 2021-2031
- Historical Data and Forecast of Guyana Glass Bottle Market Revenues & Volume By Cosmetics for the Period 2021-2031
- Historical Data and Forecast of Guyana Glass Bottle Market Revenues & Volume By Pharmaceutical for the Period 2021-2031
- Historical Data and Forecast of Guyana Glass Bottle Market Revenues & Volume By Other for the Period 2021-2031
- Guyana Glass Bottle Import Export Trade Statistics
- Market Opportunity Assessment By Filament Type
- Market Opportunity Assessment By Application
- Guyana Glass Bottle Top Companies Market Share
- Guyana Glass Bottle Competitive Benchmarking By Technical and Operational Parameters
- Guyana Glass Bottle Company Profiles
- Guyana Glass Bottle Key Strategic Recommendations
Frequently Asked Questions About the Market Study (FAQs):
6Wresearch actively monitors the Guyana Glass Bottle Market and publishes its comprehensive annual report, highlighting emerging trends, growth drivers, revenue analysis, and forecast outlook. Our insights help businesses to make data-backed strategic decisions with ongoing market dynamics. Our analysts track relevent industries related to the Guyana Glass Bottle Market, allowing our clients with actionable intelligence and reliable forecasts tailored to emerging regional needs.
Yes, we provide customisation as per your requirements. To learn more, feel free to contact us on sales@6wresearch.com
1 Executive Summary |
2 Introduction |
2.1 Key Highlights of the Report |
2.2 Report Description |
2.3 Market Scope & Segmentation |
2.4 Research Methodology |
2.5 Assumptions |
3 Guyana Glass Bottle Market Overview |
3.1 Guyana Country Macro Economic Indicators |
3.2 Guyana Glass Bottle Market Revenues & Volume, 2021 & 2031F |
3.3 Guyana Glass Bottle Market - Industry Life Cycle |
3.4 Guyana Glass Bottle Market - Porter's Five Forces |
3.5 Guyana Glass Bottle Market Revenues & Volume Share, By Filament Type, 2021 & 2031F |
3.6 Guyana Glass Bottle Market Revenues & Volume Share, By Application, 2021 & 2031F |
4 Guyana Glass Bottle Market Dynamics |
4.1 Impact Analysis |
4.2 Market Drivers |
4.2.1 Growing demand for eco-friendly packaging solutions |
4.2.2 Increasing consumption of beverages and alcoholic drinks |
4.2.3 Growth in the pharmaceutical industry in Guyana |
4.3 Market Restraints |
4.3.1 Fluctuating raw material prices |
4.3.2 Competition from alternative packaging materials such as plastic and metal |
4.3.3 Lack of technological advancements in glass bottle production in Guyana |
5 Guyana Glass Bottle Market Trends |
6 Guyana Glass Bottle Market Segmentations |
6.1 Guyana Glass Bottle Market, By Filament Type |
6.1.1 Overview and Analysis |
6.1.2 Guyana Glass Bottle Market Revenues & Volume, By Moulded, 2021-2031F |
6.1.3 Guyana Glass Bottle Market Revenues & Volume, By Tubular, 2021-2031F |
6.2 Guyana Glass Bottle Market, By Application |
6.2.1 Overview and Analysis |
6.2.2 Guyana Glass Bottle Market Revenues & Volume, By Beverage, 2021-2031F |
6.2.3 Guyana Glass Bottle Market Revenues & Volume, By Food, 2021-2031F |
6.2.4 Guyana Glass Bottle Market Revenues & Volume, By Cosmetics, 2021-2031F |
6.2.5 Guyana Glass Bottle Market Revenues & Volume, By Pharmaceutical, 2021-2031F |
6.2.6 Guyana Glass Bottle Market Revenues & Volume, By Other, 2021-2031F |
7 Guyana Glass Bottle Market Import-Export Trade Statistics |
7.1 Guyana Glass Bottle Market Export to Major Countries |
7.2 Guyana Glass Bottle Market Imports from Major Countries |
8 Guyana Glass Bottle Market Key Performance Indicators |
8.1 Sustainability initiatives implemented by glass bottle manufacturers |
8.2 Adoption rate of glass bottles by beverage and pharmaceutical companies in Guyana |
8.3 Investment in research and development for innovative glass bottle designs |
8.4 Compliance with environmental regulations and standards |
8.5 Customer satisfaction and repeat orders for glass bottles |
9 Guyana Glass Bottle Market - Opportunity Assessment |
9.1 Guyana Glass Bottle Market Opportunity Assessment, By Filament Type, 2021 & 2031F |
9.2 Guyana Glass Bottle Market Opportunity Assessment, By Application, 2021 & 2031F |
10 Guyana Glass Bottle Market - Competitive Landscape |
10.1 Guyana Glass Bottle Market Revenue Share, By Companies, 2024 |
10.2 Guyana Glass Bottle Market Competitive Benchmarking, By Operating and Technical Parameters |
11 Company Profiles |
12 Recommendations | 13 Disclaimer |
Global Go To Market Strategy - 2030
Export potential enables firms to identify high-growth global markets with greater confidence by combining advanced trade intelligence with a structured quantitative methodology. The framework analyzes emerging demand trends and country-level import patterns while integrating macroeconomic and trade datasets such as GDP and population forecasts, bilateral import–export flows, tariff structures, elasticity differentials between developed and developing economies, geographic distance, and import demand projections. Using weighted trade values from 2020–2024 as the base period to project country-to-country export potential for 2030, these inputs are operationalized through calculated drivers such as gravity model parameters, tariff impact factors, and projected GDP per-capita growth. Through an analysis of hidden potentials, demand hotspots, and market conditions that are most favorable to success, this method enables firms to focus on target countries, maximize returns, and global expansion with data, backed by accuracy.
By factoring in the projected importer demand gap that is currently unmet and could be potential opportunity, it identifies the potential for the Exporter (Country) among 190 countries, against the general trade analysis, which identifies the biggest importer or exporter.
To discover high-growth global markets and optimize your business strategy:
Click Here
Pricing
- Single User License$ 1,995
- Department License$ 2,400
- Site License$ 3,120
- Global License$ 3,795

Leadership Perspectives from Industry Events
Search
Thought Leadership and Analyst Meet


Our Clients
6WResearch In News
- India Export Attractiveness Tracker 2026
- India Air Conditioner Market Set for Strong Rebound in 2026 After Weather-Led Correction and GST-Driven Recovery: 6Wresearch
- ADAS in India: How Automatic Emergency Braking, Blind Spot Detection & Driver Monitoring are Transforming Road Safety
- Doha a strategic location for EV manufacturing hub: IPA Qatar
- Demand for luxury TVs surging in the GCC, says Samsung
- Empowering Growth: The Thriving Journey of Bangladesh’s Cable Industry
Latest Reports
- Nicaragua RPG Gaming Market (2026-2032)
- New Zealand RPG Gaming Market (2026-2032)
- Netherlands RPG Gaming Market (2026-2032)
- Nauru RPG Gaming Market (2026-2032)
- Namibia RPG Gaming Market (2026-2032)
- Mozambique RPG Gaming Market (2026-2032)
- Montenegro RPG Gaming Market (2026-2032)
- Mongolia RPG Gaming Market (2026-2032)
- Monaco RPG Gaming Market (2026-2032)
- Micronesia RPG Gaming Market (2026-2032)
Industry Events and Analyst Meet

EV India Expo 2026

HIMTEX 2026

India Refining Summit 2026

India EV Show 2026

EV tech India Expo 2026
Whitepaper
- Middle East & Africa Commercial Security Market Click here to view more.
- Middle East & Africa Fire Safety Systems & Equipment Market Click here to view more.
- GCC Drone Market Click here to view more.
- Middle East Lighting Fixture Market Click here to view more.
- GCC Physical & Perimeter Security Market Click here to view more.