Guyana Soups Market (2025-2031) | Outlook, Value, Analysis, Companies, Revenue, Growth, Size, Share, Segmentation, Trends, Industry & Forecast
Market Forecast By Type (Dry, Wet, Others), By Distribution Channel (Supermarkets & Hypermarkets, Convenience Stores, Others) And Competitive Landscape
| Product Code: ETC5008954 | Publication Date: Nov 2023 | Updated Date: Sep 2025 | Product Type: Market Research Report | |
| Publisher: 6Wresearch | Author: Sachin Kumar Rai | No. of Pages: 60 | No. of Figures: 30 | No. of Tables: 5 |
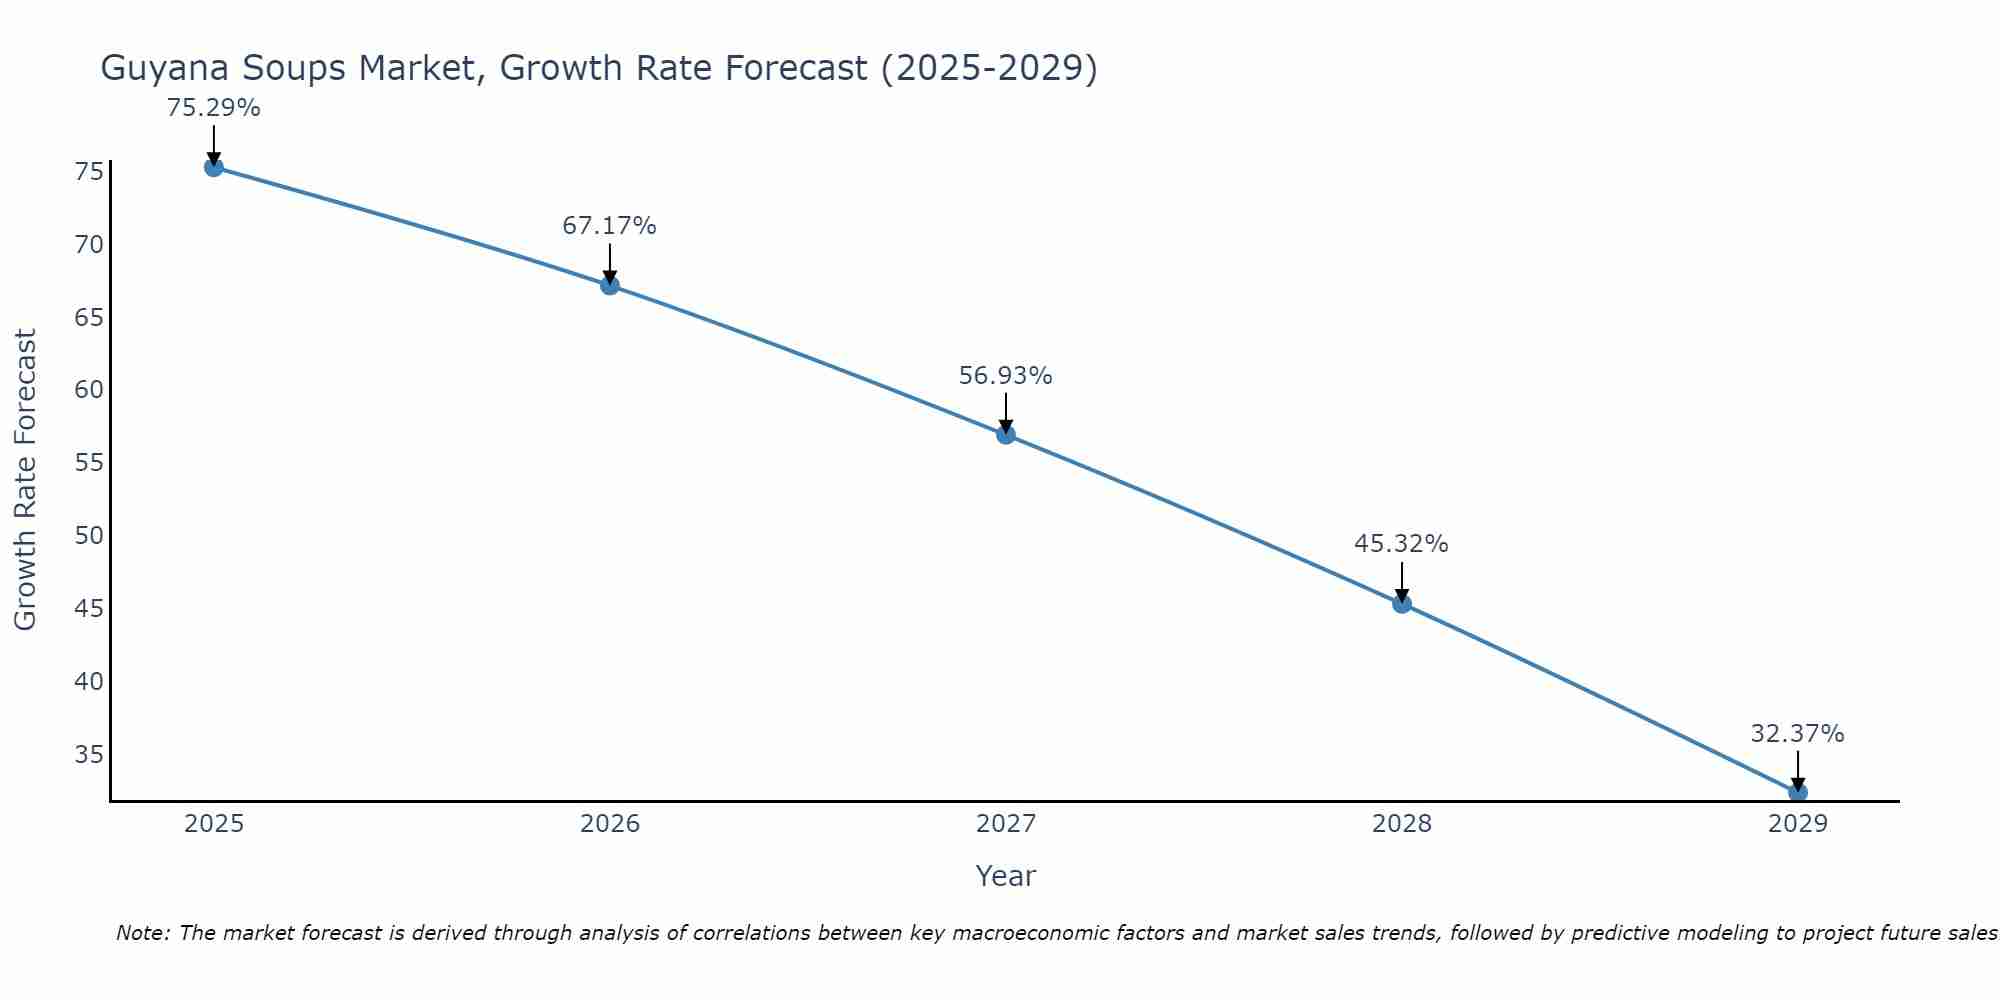
Guyana Soups Market Size Growth Rate
The Guyana Soups Market may undergo a gradual slowdown in growth rates between 2025 and 2029. Starting high at 75.29% in 2025, the market steadily declines to 32.37% by 2029.
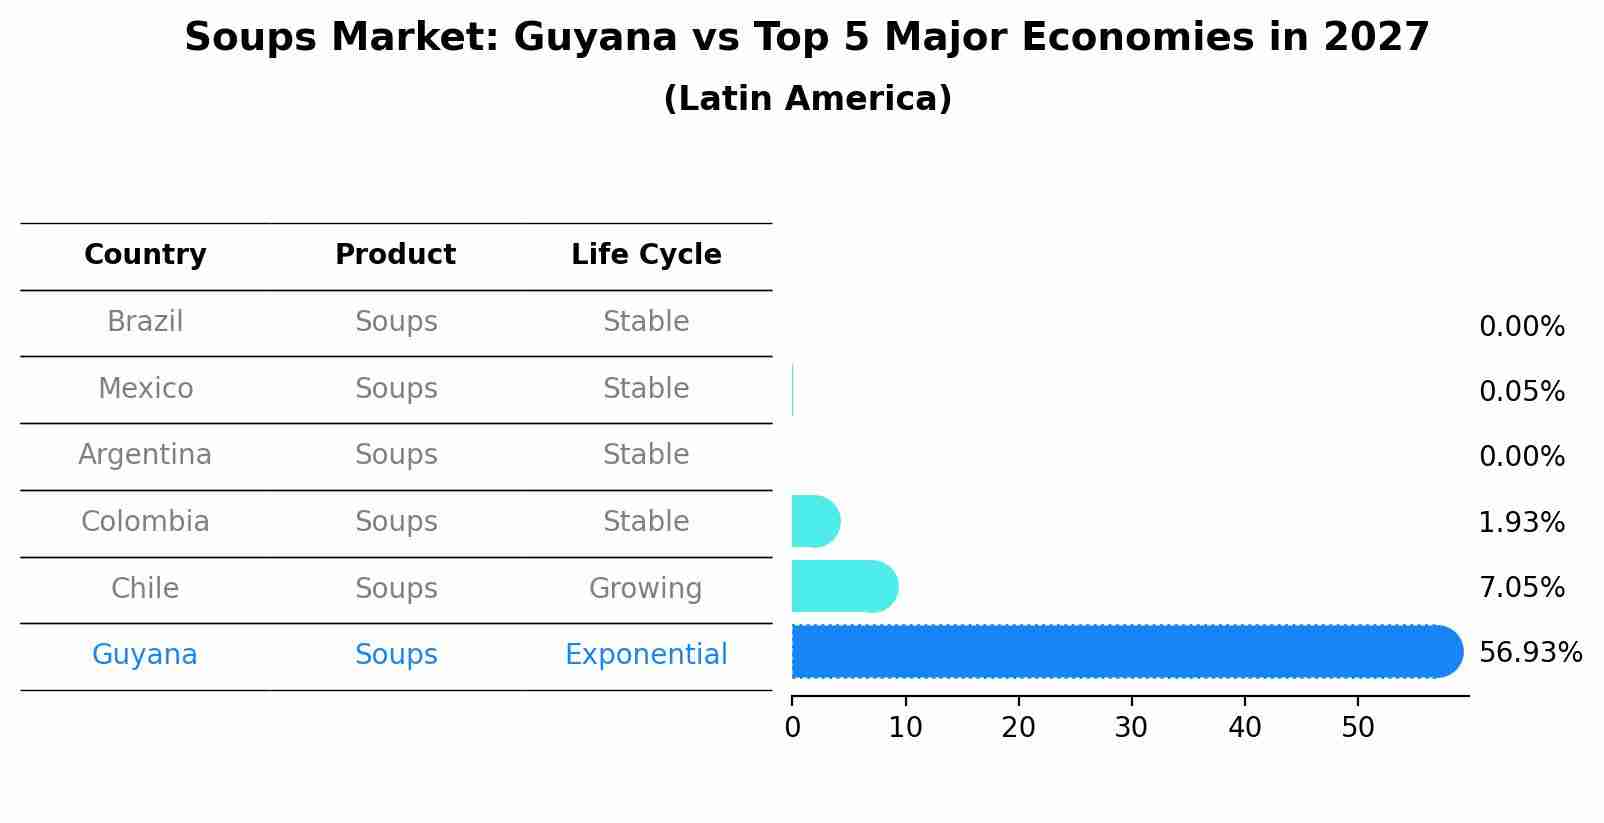
Soups Market: Guyana vs Top 5 Major Economies in 2027 (Latin America)
The Soups market in Guyana is projected to grow at a exponential growth rate of 56.93% by 2027, highlighting the country's increasing focus on advanced technologies within the Latin America region, where Brazil holds the dominant position, followed closely by Mexico, Argentina, Colombia and Chile, shaping overall regional demand.
Guyana Soups Market Overview
The Guyana soups market has experienced steady growth, particularly in the ready-to-eat and convenience segments. Rising consumer interest in healthy eating and the growing popularity of plant-based diets have contributed to the increasing demand for soups made from natural ingredients. However, the market faces challenges such as the availability of fresh, local ingredients and competition from imported products. Additionally, consumer preferences for homemade soups over processed alternatives may impact the markets growth.
Drivers of the market
The Guyana soups market is driven by the increasing preference for convenient and nutritious meal options. Ready-to-eat soups, especially those offering local and familiar flavors, are becoming more popular due to the fast-paced lifestyles of urban consumers. Additionally, the growing focus on health and wellness has led to higher demand for soups with added nutritional value, including low-sodium, organic, and plant-based options. The availability of diverse flavors and the increasing use of local ingredients in soup production also contribute to the market`s expansion. Consumer convenience and the demand for healthy, easy-to-prepare meals are key drivers of the soup market.
Challenges of the market
The Guyana soups market faces challenges related to the preference for traditional and homemade soups, as consumers may be reluctant to adopt pre-packaged or processed options. The availability of locally made soups with natural ingredients can make it difficult for packaged soup products to compete. Additionally, the cost of ingredients, such as vegetables, herbs, and spices, can fluctuate, potentially leading to price increases for packaged soups. Distribution challenges in rural areas and the lack of cold storage facilities can also hinder the market`s growth potential, especially for perishable products.
Government Policy of the market
Government policies impacting the soups market in Guyana are primarily focused on food safety, agricultural development, and nutrition. The government can promote local production of fresh and healthy ingredients for soup manufacturing, thus fostering the growth of the soups market. Additionally, regulations around food labeling, hygiene standards, and packaging ensure the quality and safety of soup products. However, challenges arise due to inconsistent policy implementation and a need for stronger incentives to encourage local production over imported canned soups.
Key Highlights of the Report:
- Guyana Soups Market Outlook
- Market Size of Guyana Soups Market, 2024
- Forecast of Guyana Soups Market, 2031
- Historical Data and Forecast of Guyana Soups Revenues & Volume for the Period 2021-2031
- Guyana Soups Market Trend Evolution
- Guyana Soups Market Drivers and Challenges
- Guyana Soups Price Trends
- Guyana Soups Porter`s Five Forces
- Guyana Soups Industry Life Cycle
- Historical Data and Forecast of Guyana Soups Market Revenues & Volume By Type for the Period 2021-2031
- Historical Data and Forecast of Guyana Soups Market Revenues & Volume By Dry for the Period 2021-2031
- Historical Data and Forecast of Guyana Soups Market Revenues & Volume By Wet for the Period 2021-2031
- Historical Data and Forecast of Guyana Soups Market Revenues & Volume By Others for the Period 2021-2031
- Historical Data and Forecast of Guyana Soups Market Revenues & Volume By Distribution Channel for the Period 2021-2031
- Historical Data and Forecast of Guyana Soups Market Revenues & Volume By Supermarkets & Hypermarkets for the Period 2021-2031
- Historical Data and Forecast of Guyana Soups Market Revenues & Volume By Convenience Stores for the Period 2021-2031
- Historical Data and Forecast of Guyana Soups Market Revenues & Volume By Others for the Period 2021-2031
- Guyana Soups Import Export Trade Statistics
- Market Opportunity Assessment By Type
- Market Opportunity Assessment By Distribution Channel
- Guyana Soups Top Companies Market Share
- Guyana Soups Competitive Benchmarking By Technical and Operational Parameters
- Guyana Soups Company Profiles
- Guyana Soups Key Strategic Recommendations
Frequently Asked Questions About the Market Study (FAQs):
6Wresearch actively monitors the Guyana Soups Market and publishes its comprehensive annual report, highlighting emerging trends, growth drivers, revenue analysis, and forecast outlook. Our insights help businesses to make data-backed strategic decisions with ongoing market dynamics. Our analysts track relevent industries related to the Guyana Soups Market, allowing our clients with actionable intelligence and reliable forecasts tailored to emerging regional needs.
Yes, we provide customisation as per your requirements. To learn more, feel free to contact us on sales@6wresearch.com
1 Executive Summary |
2 Introduction |
2.1 Key Highlights of the Report |
2.2 Report Description |
2.3 Market Scope & Segmentation |
2.4 Research Methodology |
2.5 Assumptions |
3 Guyana Soups Market Overview |
3.1 Guyana Country Macro Economic Indicators |
3.2 Guyana Soups Market Revenues & Volume, 2021 & 2031F |
3.3 Guyana Soups Market - Industry Life Cycle |
3.4 Guyana Soups Market - Porter's Five Forces |
3.5 Guyana Soups Market Revenues & Volume Share, By Type, 2021 & 2031F |
3.6 Guyana Soups Market Revenues & Volume Share, By Distribution Channel, 2021 & 2031F |
4 Guyana Soups Market Dynamics |
4.1 Impact Analysis |
4.2 Market Drivers |
4.2.1 Increasing consumer awareness and demand for healthy and natural food options |
4.2.2 Growing interest in global cuisines and flavors, leading to the popularity of Guyanese cuisine |
4.2.3 Rise in disposable income and changing lifestyles, resulting in higher spending on convenience foods |
4.3 Market Restraints |
4.3.1 Fluctuating raw material prices impacting production costs |
4.3.2 Intense competition from other packaged soup brands in the market |
5 Guyana Soups Market Trends |
6 Guyana Soups Market Segmentations |
6.1 Guyana Soups Market, By Type |
6.1.1 Overview and Analysis |
6.1.2 Guyana Soups Market Revenues & Volume, By Dry, 2021-2031F |
6.1.3 Guyana Soups Market Revenues & Volume, By Wet, 2021-2031F |
6.1.4 Guyana Soups Market Revenues & Volume, By Others, 2021-2031F |
6.2 Guyana Soups Market, By Distribution Channel |
6.2.1 Overview and Analysis |
6.2.2 Guyana Soups Market Revenues & Volume, By Supermarkets & Hypermarkets, 2021-2031F |
6.2.3 Guyana Soups Market Revenues & Volume, By Convenience Stores, 2021-2031F |
6.2.4 Guyana Soups Market Revenues & Volume, By Others, 2021-2031F |
7 Guyana Soups Market Import-Export Trade Statistics |
7.1 Guyana Soups Market Export to Major Countries |
7.2 Guyana Soups Market Imports from Major Countries |
8 Guyana Soups Market Key Performance Indicators |
8.1 Consumer engagement on social media platforms for Guyanese soup brands |
8.2 Number of new product launches and flavor innovations in the Guyana soups market |
8.3 Rate of adoption of Guyanese soups in non-traditional markets or regions |
9 Guyana Soups Market - Opportunity Assessment |
9.1 Guyana Soups Market Opportunity Assessment, By Type, 2021 & 2031F |
9.2 Guyana Soups Market Opportunity Assessment, By Distribution Channel, 2021 & 2031F |
10 Guyana Soups Market - Competitive Landscape |
10.1 Guyana Soups Market Revenue Share, By Companies, 2024 |
10.2 Guyana Soups Market Competitive Benchmarking, By Operating and Technical Parameters |
11 Company Profiles |
12 Recommendations | 13 Disclaimer |
Global Go To Market Strategy - 2030
Export potential enables firms to identify high-growth global markets with greater confidence by combining advanced trade intelligence with a structured quantitative methodology. The framework analyzes emerging demand trends and country-level import patterns while integrating macroeconomic and trade datasets such as GDP and population forecasts, bilateral import–export flows, tariff structures, elasticity differentials between developed and developing economies, geographic distance, and import demand projections. Using weighted trade values from 2020–2024 as the base period to project country-to-country export potential for 2030, these inputs are operationalized through calculated drivers such as gravity model parameters, tariff impact factors, and projected GDP per-capita growth. Through an analysis of hidden potentials, demand hotspots, and market conditions that are most favorable to success, this method enables firms to focus on target countries, maximize returns, and global expansion with data, backed by accuracy.
By factoring in the projected importer demand gap that is currently unmet and could be potential opportunity, it identifies the potential for the Exporter (Country) among 190 countries, against the general trade analysis, which identifies the biggest importer or exporter.
To discover high-growth global markets and optimize your business strategy:
Click Here
Pricing
- Single User License$ 1,995
- Department License$ 2,400
- Site License$ 3,120
- Global License$ 3,795

Leadership Perspectives from Industry Events
Search
Thought Leadership and Analyst Meet


Our Clients
6WResearch In News
- Doha a strategic location for EV manufacturing hub: IPA Qatar
- Demand for luxury TVs surging in the GCC, says Samsung
- Empowering Growth: The Thriving Journey of Bangladesh’s Cable Industry
- Demand for luxury TVs surging in the GCC, says Samsung
- Video call with a traditional healer? Once unthinkable, it’s now common in South Africa
- Intelligent Buildings To Smooth GCC’s Path To Net Zero
Latest Reports
- New Zealand Aseptic Manufacturing Market (2026-2032)
- Netherlands Aseptic Manufacturing Market (2026-2032)
- Nauru Aseptic Manufacturing Market (2026-2032)
- Namibia Aseptic Manufacturing Market (2026-2032)
- Mozambique Aseptic Manufacturing Market (2026-2032)
- Montenegro Aseptic Manufacturing Market (2026-2032)
- Mongolia Aseptic Manufacturing Market (2026-2032)
- Monaco Aseptic Manufacturing Market (2026-2032)
- Micronesia Aseptic Manufacturing Market (2026-2032)
- Mauritius Aseptic Manufacturing Market (2026-2032)
Industry Events and Analyst Meet

HIMTEX 2026

India Refining Summit 2026

India EV Show 2026

EV tech India Expo 2026

Auto Tech Asia 2026
Whitepaper
- Middle East & Africa Commercial Security Market Click here to view more.
- Middle East & Africa Fire Safety Systems & Equipment Market Click here to view more.
- GCC Drone Market Click here to view more.
- Middle East Lighting Fixture Market Click here to view more.
- GCC Physical & Perimeter Security Market Click here to view more.