Hong Kong Carbonated Beverage Processing Equipment Market (2025-2031) | Growth, Industry, Size, Outlook, Companies, Revenue, Share, Value, Segmentation, Forecast, Trends & Analysis
Market Forecast By Equipment Type (Sugar Dissolvers, Carbonation Equipment, Blenders & Mixers, Heat Exchangers), By Beverage Type (Flavored Drinks, Functional Drinks, Club Soda) And Competitive Landscape
| Product Code: ETC5807736 | Publication Date: Nov 2023 | Updated Date: Nov 2025 | Product Type: Market Research Report | |
| Publisher: 6Wresearch | Author: Summon Dutta | No. of Pages: 60 | No. of Figures: 30 | No. of Tables: 5 |
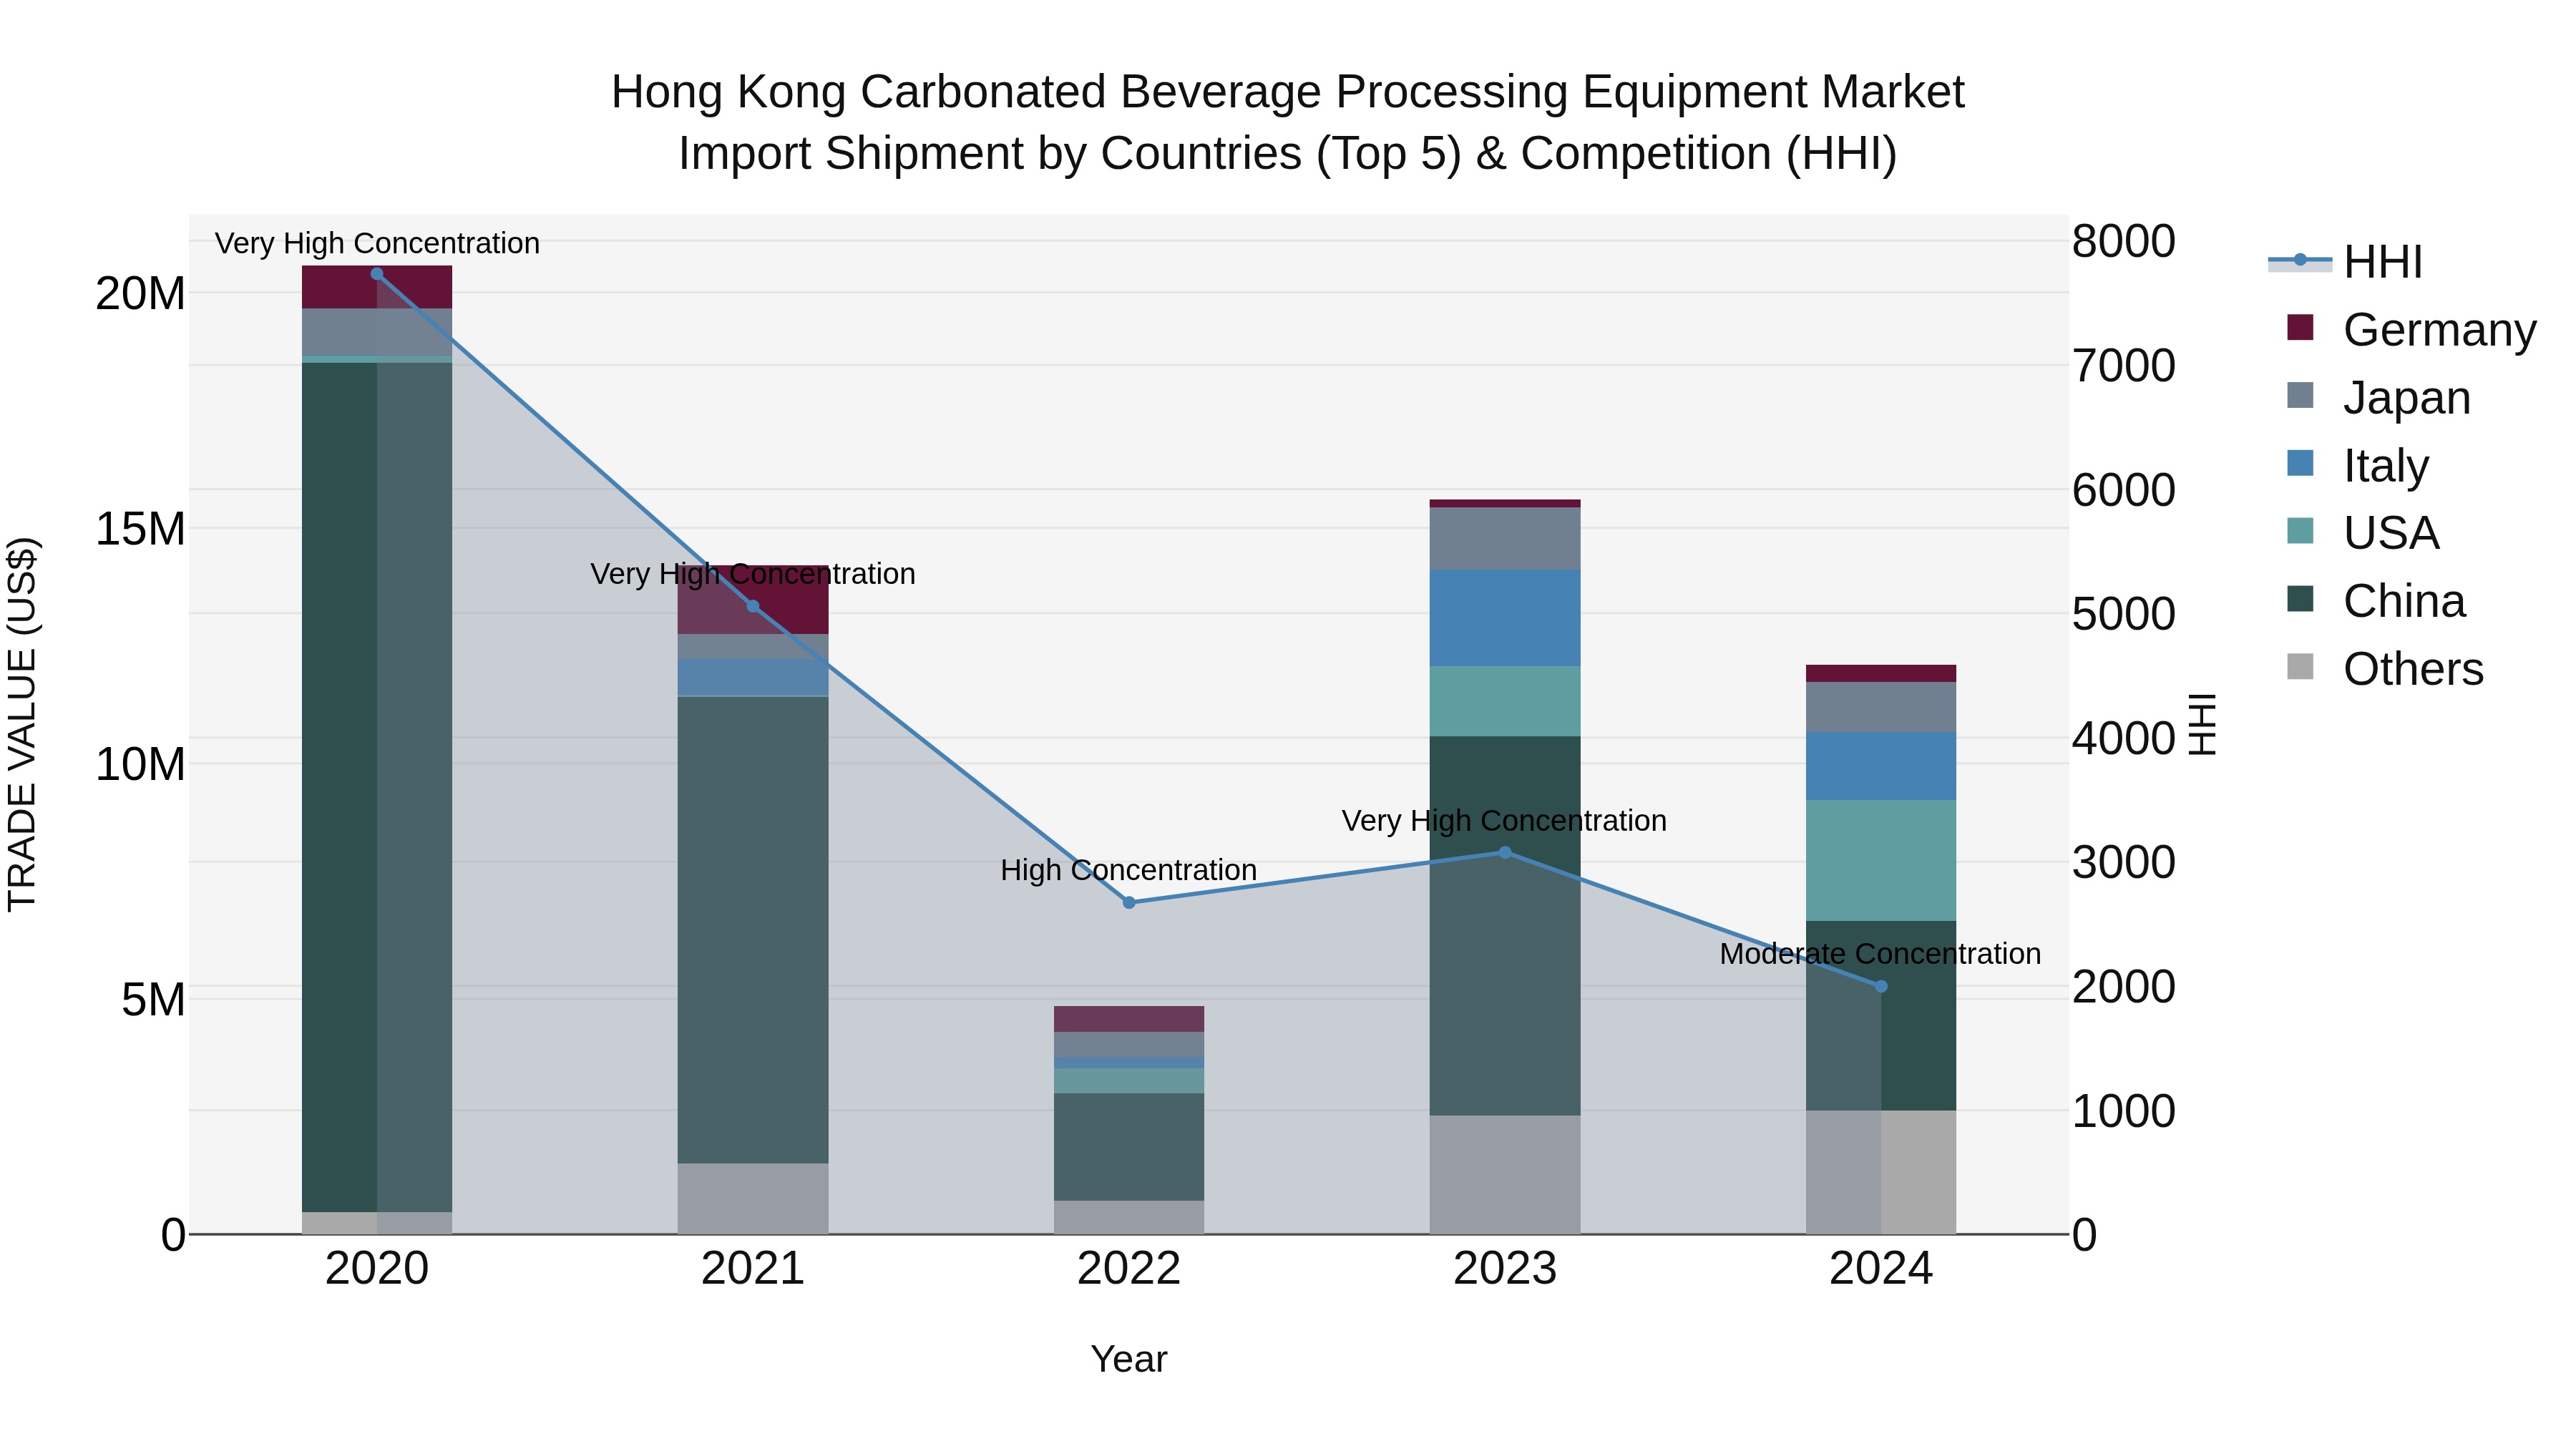
Hong Kong Carbonated Beverage Processing Equipment Market Top 5 Importing Countries and Market Competition (HHI) Analysis
In 2024, Hong Kong saw a shift in the concentration of carbonated beverage processing equipment imports, moving from very high concentration in 2023 to a more moderate level. The top exporting countries to Hong Kong in 2024 were China, USA, Malaysia, Italy, and Japan. The industry experienced a significant decline with a CAGR of -12.44% from 2020 to 2024, and a growth rate of -22.55% from 2023 to 2024. This indicates a challenging market environment for carbonated beverage processing equipment importers in Hong Kong, potentially driven by various economic factors impacting the industry.
Hong Kong Carbonated Beverage Processing Equipment Market Synopsis
The carbonated beverage processing equipment market benefits from Hong Kong robust beverage industry. Demand for advanced equipment that improves efficiency and sustainability in production processes is driving market expansion.
Drivers of the market
The growth of the carbonated beverage industry in Hong Kong, fueled by rising consumer demand for soft drinks and sparkling water, is driving the market for processing equipment. Manufacturers are increasingly investing in advanced machinery to enhance production efficiency and cater to the evolving tastes of consumers seeking innovative and healthier beverage options.
Challenges of the market
This market faces challenges from rising raw material and energy costs, as well as the need for continuous innovation to meet changing consumer preferences. Regulatory compliance regarding food safety and environmental sustainability further complicates operations.
Government Policy of the market
In the Carbonated Beverage Processing Equipment market, the Hong Kong government emphasizes compliance with food safety standards and equipment quality. Regulatory frameworks are established to ensure that processing equipment meets safety and performance criteria. The government promotes research and development initiatives aimed at enhancing processing technologies in the beverage industry. Additionally, policies support consumer education regarding safe and sustainable beverage production practices.
Key Highlights of the Report:
- Hong Kong Carbonated Beverage Processing Equipment Market Outlook
- Market Size of Hong Kong Carbonated Beverage Processing Equipment Market, 2024
- Forecast of Hong Kong Carbonated Beverage Processing Equipment Market, 2031
- Historical Data and Forecast of Hong Kong Carbonated Beverage Processing Equipment Revenues & Volume for the Period 2021-2031
- Hong Kong Carbonated Beverage Processing Equipment Market Trend Evolution
- Hong Kong Carbonated Beverage Processing Equipment Market Drivers and Challenges
- Hong Kong Carbonated Beverage Processing Equipment Price Trends
- Hong Kong Carbonated Beverage Processing Equipment Porter`s Five Forces
- Hong Kong Carbonated Beverage Processing Equipment Industry Life Cycle
- Historical Data and Forecast of Hong Kong Carbonated Beverage Processing Equipment Market Revenues & Volume By Equipment Type for the Period 2021-2031
- Historical Data and Forecast of Hong Kong Carbonated Beverage Processing Equipment Market Revenues & Volume By Sugar Dissolvers for the Period 2021-2031
- Historical Data and Forecast of Hong Kong Carbonated Beverage Processing Equipment Market Revenues & Volume By Carbonation Equipment for the Period 2021-2031
- Historical Data and Forecast of Hong Kong Carbonated Beverage Processing Equipment Market Revenues & Volume By Blenders & Mixers for the Period 2021-2031
- Historical Data and Forecast of Hong Kong Carbonated Beverage Processing Equipment Market Revenues & Volume By Heat Exchangers for the Period 2021-2031
- Historical Data and Forecast of Hong Kong Carbonated Beverage Processing Equipment Market Revenues & Volume By Beverage Type for the Period 2021-2031
- Historical Data and Forecast of Hong Kong Carbonated Beverage Processing Equipment Market Revenues & Volume By Flavored Drinks for the Period 2021-2031
- Historical Data and Forecast of Hong Kong Carbonated Beverage Processing Equipment Market Revenues & Volume By Functional Drinks for the Period 2021-2031
- Historical Data and Forecast of Hong Kong Carbonated Beverage Processing Equipment Market Revenues & Volume By Club Soda for the Period 2021-2031
- Hong Kong Carbonated Beverage Processing Equipment Import Export Trade Statistics
- Market Opportunity Assessment By Equipment Type
- Market Opportunity Assessment By Beverage Type
- Hong Kong Carbonated Beverage Processing Equipment Top Companies Market Share
- Hong Kong Carbonated Beverage Processing Equipment Competitive Benchmarking By Technical and Operational Parameters
- Hong Kong Carbonated Beverage Processing Equipment Company Profiles
- Hong Kong Carbonated Beverage Processing Equipment Key Strategic Recommendations
Frequently Asked Questions About the Market Study (FAQs):
6Wresearch actively monitors the Hong Kong Carbonated Beverage Processing Equipment Market and publishes its comprehensive annual report, highlighting emerging trends, growth drivers, revenue analysis, and forecast outlook. Our insights help businesses to make data-backed strategic decisions with ongoing market dynamics. Our analysts track relevent industries related to the Hong Kong Carbonated Beverage Processing Equipment Market, allowing our clients with actionable intelligence and reliable forecasts tailored to emerging regional needs.
Yes, we provide customisation as per your requirements. To learn more, feel free to contact us on sales@6wresearch.com
1 Executive Summary |
2 Introduction |
2.1 Key Highlights of the Report |
2.2 Report Description |
2.3 Market Scope & Segmentation |
2.4 Research Methodology |
2.5 Assumptions |
3 Hong Kong Carbonated Beverage Processing Equipment Market Overview |
3.1 Hong Kong Country Macro Economic Indicators |
3.2 Hong Kong Carbonated Beverage Processing Equipment Market Revenues & Volume, 2021 & 2031F |
3.3 Hong Kong Carbonated Beverage Processing Equipment Market - Industry Life Cycle |
3.4 Hong Kong Carbonated Beverage Processing Equipment Market - Porter's Five Forces |
3.5 Hong Kong Carbonated Beverage Processing Equipment Market Revenues & Volume Share, By Equipment Type, 2021 & 2031F |
3.6 Hong Kong Carbonated Beverage Processing Equipment Market Revenues & Volume Share, By Beverage Type, 2021 & 2031F |
4 Hong Kong Carbonated Beverage Processing Equipment Market Dynamics |
4.1 Impact Analysis |
4.2 Market Drivers |
4.2.1 Increasing demand for carbonated beverages in Hong Kong |
4.2.2 Growing trend towards automation and efficiency in beverage processing |
4.2.3 Technological advancements in carbonated beverage processing equipment |
4.3 Market Restraints |
4.3.1 High initial investment cost for carbonated beverage processing equipment |
4.3.2 Stringent regulations and standards in the food and beverage industry in Hong Kong |
5 Hong Kong Carbonated Beverage Processing Equipment Market Trends |
6 Hong Kong Carbonated Beverage Processing Equipment Market Segmentations |
6.1 Hong Kong Carbonated Beverage Processing Equipment Market, By Equipment Type |
6.1.1 Overview and Analysis |
6.1.2 Hong Kong Carbonated Beverage Processing Equipment Market Revenues & Volume, By Sugar Dissolvers, 2021-2031F |
6.1.3 Hong Kong Carbonated Beverage Processing Equipment Market Revenues & Volume, By Carbonation Equipment, 2021-2031F |
6.1.4 Hong Kong Carbonated Beverage Processing Equipment Market Revenues & Volume, By Blenders & Mixers, 2021-2031F |
6.1.5 Hong Kong Carbonated Beverage Processing Equipment Market Revenues & Volume, By Heat Exchangers, 2021-2031F |
6.2 Hong Kong Carbonated Beverage Processing Equipment Market, By Beverage Type |
6.2.1 Overview and Analysis |
6.2.2 Hong Kong Carbonated Beverage Processing Equipment Market Revenues & Volume, By Flavored Drinks, 2021-2031F |
6.2.3 Hong Kong Carbonated Beverage Processing Equipment Market Revenues & Volume, By Functional Drinks, 2021-2031F |
6.2.4 Hong Kong Carbonated Beverage Processing Equipment Market Revenues & Volume, By Club Soda, 2021-2031F |
7 Hong Kong Carbonated Beverage Processing Equipment Market Import-Export Trade Statistics |
7.1 Hong Kong Carbonated Beverage Processing Equipment Market Export to Major Countries |
7.2 Hong Kong Carbonated Beverage Processing Equipment Market Imports from Major Countries |
8 Hong Kong Carbonated Beverage Processing Equipment Market Key Performance Indicators |
8.1 Percentage increase in the adoption of automated processing equipment |
8.2 Rate of technological upgrades in carbonated beverage processing equipment |
8.3 Energy efficiency improvements in processing equipment |
8.4 Number of new product developments in the carbonated beverage market in Hong Kong |
8.5 Level of compliance with food safety regulations and standards |
9 Hong Kong Carbonated Beverage Processing Equipment Market - Opportunity Assessment |
9.1 Hong Kong Carbonated Beverage Processing Equipment Market Opportunity Assessment, By Equipment Type, 2021 & 2031F |
9.2 Hong Kong Carbonated Beverage Processing Equipment Market Opportunity Assessment, By Beverage Type, 2021 & 2031F |
10 Hong Kong Carbonated Beverage Processing Equipment Market - Competitive Landscape |
10.1 Hong Kong Carbonated Beverage Processing Equipment Market Revenue Share, By Companies, 2024 |
10.2 Hong Kong Carbonated Beverage Processing Equipment Market Competitive Benchmarking, By Operating and Technical Parameters |
11 Company Profiles |
12 Recommendations | 13 Disclaimer |
Export potential assessment - trade Analytics for 2030
Export potential enables firms to identify high-growth global markets with greater confidence by combining advanced trade intelligence with a structured quantitative methodology. The framework analyzes emerging demand trends and country-level import patterns while integrating macroeconomic and trade datasets such as GDP and population forecasts, bilateral import–export flows, tariff structures, elasticity differentials between developed and developing economies, geographic distance, and import demand projections. Using weighted trade values from 2020–2024 as the base period to project country-to-country export potential for 2030, these inputs are operationalized through calculated drivers such as gravity model parameters, tariff impact factors, and projected GDP per-capita growth. Through an analysis of hidden potentials, demand hotspots, and market conditions that are most favorable to success, this method enables firms to focus on target countries, maximize returns, and global expansion with data, backed by accuracy.
By factoring in the projected importer demand gap that is currently unmet and could be potential opportunity, it identifies the potential for the Exporter (Country) among 190 countries, against the general trade analysis, which identifies the biggest importer or exporter.
To discover high-growth global markets and optimize your business strategy:
Click Here
Pricing
- Single User License$ 1,995
- Department License$ 2,400
- Site License$ 3,120
- Global License$ 3,795

Search
Thought Leadership and Analyst Meet


Our Clients
Latest Reports
- United Kingdom (UK) Long-term Care Insurance Market (2026-2032) | Growth, Share, Consumer Insights, Drivers, Opportunities, Competition, Pricing Analysis, Segments, Restraints, Companies, Competitive, Value, Outlook, Size, Demand, Analysis, Challenges, Strategic Insights, Investment Trends, Revenue, Trends, Supply, Forecast
- United Kingdom (UK) Long Term Care Market (2026-2032) | Companies, Outlook, Analysis, Trends, Value, Revenue, Segmentation, Share, Forecast, Competitive Landscape, Growth, Size & Forecast
- Iraq Insulation and Waterproofing Market (2026-2032) | Outlook, Drivers, Growth, Size, Share, Industry, Revenue, Trends, Demand, Competitive, Strategic Insights, Opportunities, Segments, Companies, Challenges, Strategy, Consumer Insights, Analysis, Investment Trends, Value, Segmentation, Forecast, Restraints
- India Switchgear Market Outlook (2026 - 2032) | Size, Share, Trends, Growth, Revenue, Forecast, Analysis, Value, Outlook
- Pakistan Contraceptive Implants Market (2025-2031) | Demand, Growth, Size, Share, Industry, Pricing Analysis, Competitive, Strategic Insights, Strategy, Consumer Insights, Analysis, Investment Trends, Opportunities, Revenue, Segments, Value, Segmentation, Supply, Forecast, Restraints, Outlook, Competition, Drivers, Trends, Companies, Challenges
- Sri Lanka Packaging Market (2026-2032) | Outlook, Competition, Drivers, Trends, Demand, Pricing Analysis, Competitive, Strategic Insights, Companies, Challenges, Strategy, Consumer Insights, Analysis, Investment Trends, Opportunities, Growth, Size, Share, Industry, Revenue, Segments, Value, Segmentation, Supply, Forecast, Restraints
- India Kids Watches Market (2026-2032) | Strategy, Consumer Insights, Analysis, Investment Trends, Opportunities, Growth, Size, Share, Industry, Revenue, Segments, Value, Segmentation, Supply, Forecast, Restraints, Outlook, Competition, Drivers, Trends, Demand, Pricing Analysis, Competitive, Strategic Insights, Companies, Challenges
- Saudi Arabia Core Assurance Service Market (2025-2031) | Strategy, Consumer Insights, Analysis, Investment Trends, Opportunities, Growth, Size, Share, Industry, Revenue, Segments, Value, Segmentation, Supply, Forecast, Restraints, Outlook, Competition, Drivers, Trends, Demand, Pricing Analysis, Competitive, Strategic Insights, Companies, Challenges
- Romania Uninterruptible Power Supply (UPS) Market (2026-2032) | Industry, Analysis, Revenue, Size, Forecast, Outlook, Value, Trends, Share, Growth & Companies
- Saudi Arabia Car Window Tinting Film, Paint Protection Film (PPF), and Ceramic Coating Market (2025-2031) | Strategy, Consumer Insights, Analysis, Investment Trends, Opportunities, Growth, Size, Share, Industry, Revenue, Segments, Value, Segmentation, Supply, Forecast, Restraints, Outlook, Competition, Drivers, Trends, Demand, Pricing Analysis, Competitive, Strategic Insights, Companies, Challenges
Industry Events and Analyst Meet

India EV Show 2026

EV tech India Expo 2026

Auto Tech Asia 2026

Battery Tech India 2026

Smart Production Solutions Guangzhou 2026
Whitepaper
- Middle East & Africa Commercial Security Market Click here to view more.
- Middle East & Africa Fire Safety Systems & Equipment Market Click here to view more.
- GCC Drone Market Click here to view more.
- Middle East Lighting Fixture Market Click here to view more.
- GCC Physical & Perimeter Security Market Click here to view more.
6WResearch In News
- Doha a strategic location for EV manufacturing hub: IPA Qatar
- Demand for luxury TVs surging in the GCC, says Samsung
- Empowering Growth: The Thriving Journey of Bangladesh’s Cable Industry
- Demand for luxury TVs surging in the GCC, says Samsung
- Video call with a traditional healer? Once unthinkable, it’s now common in South Africa
- Intelligent Buildings To Smooth GCC’s Path To Net Zero