Hong Kong Polyurethane (PU) Microspheres Market (2025-2031) | Growth, Companies, Size, Outlook, Revenue, Trends, Forecast, Industry, Value, Share, Segmentation & Analysis
Market Forecast By Applications (Encapsulation, Paints & coatings, Adhesives films, Cosmetics, Other applications) And Competitive Landscape
| Product Code: ETC5738044 | Publication Date: Nov 2023 | Updated Date: Nov 2025 | Product Type: Market Research Report | |
| Publisher: 6Wresearch | Author: Sumit Sagar | No. of Pages: 60 | No. of Figures: 30 | No. of Tables: 5 |
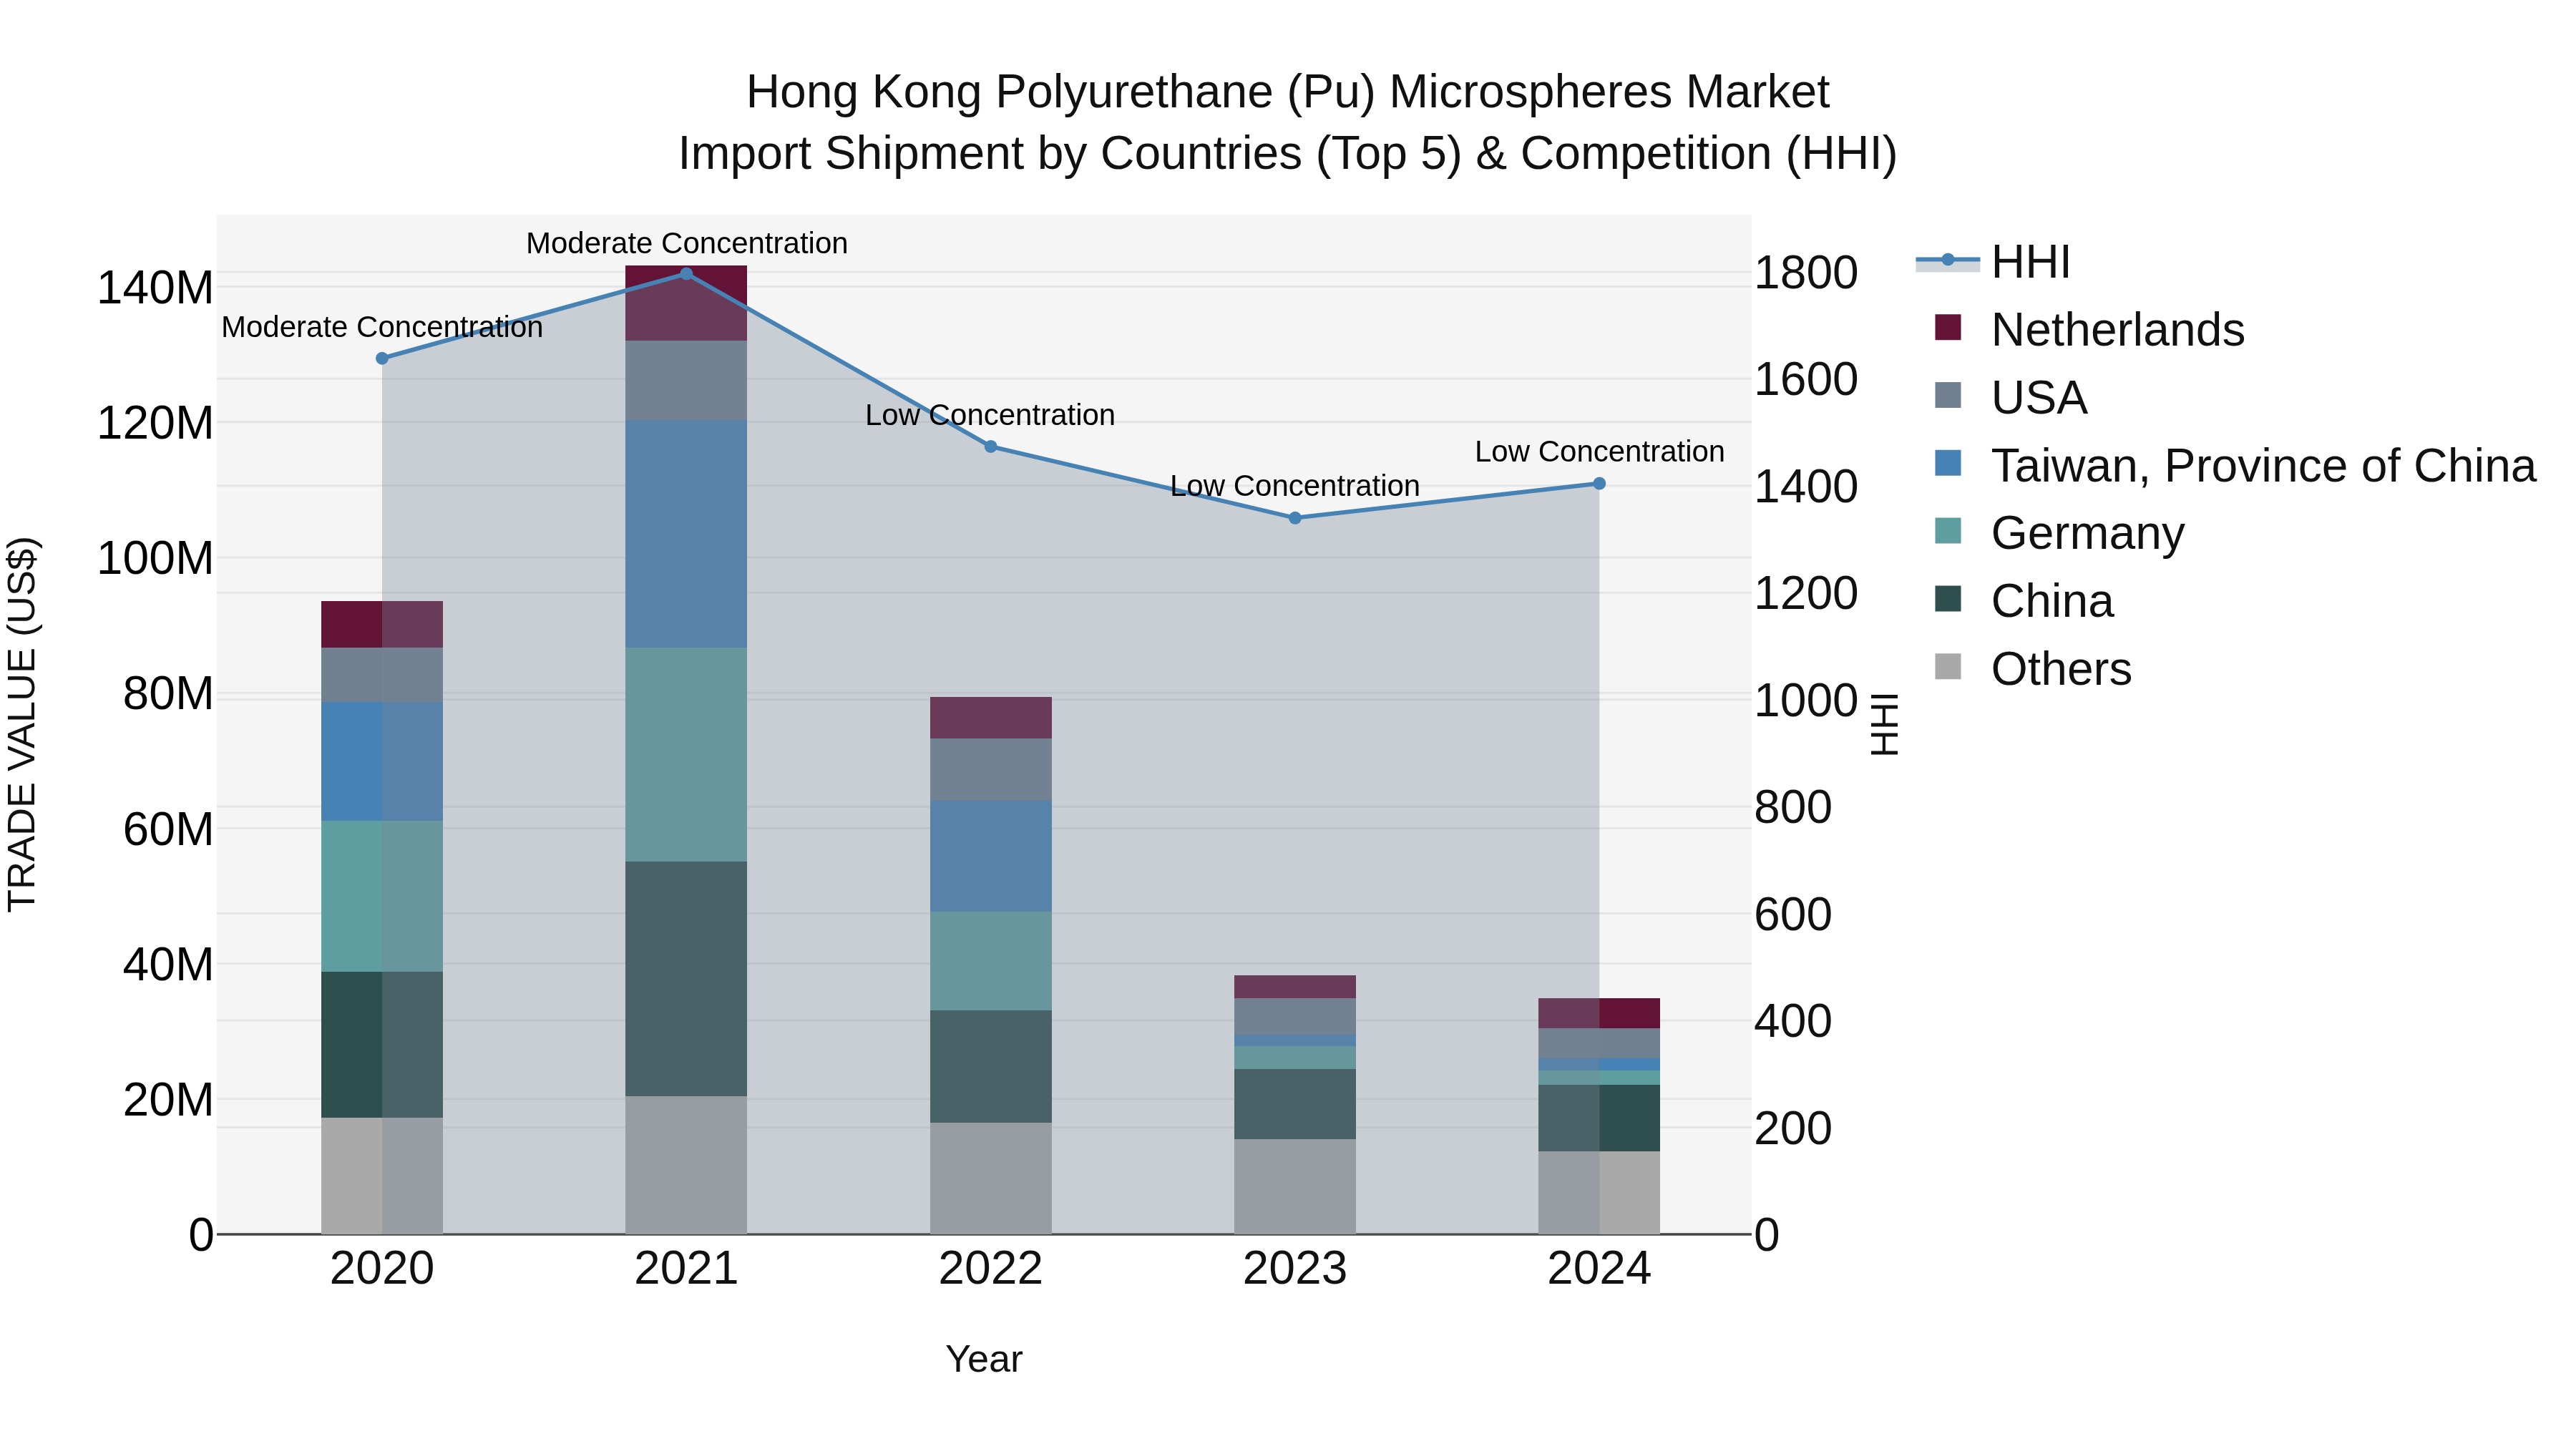
Hong Kong Polyurethane (Pu) Microspheres Market Top 5 Importing Countries and Market Competition (HHI) Analysis
In 2024, Hong Kong continued to see a diverse range of import sources for polyurethane (PU) microspheres, with top exporters including China, Netherlands, USA, Japan, and South Korea. The market showed a low concentration level based on the Herfindahl-Hirschman Index (HHI) in 2024. However, the compound annual growth rate (CAGR) for the period 2020-24 experienced a decline of -21.87%, with a further decrease in growth rate from 2023 to 2024 at -8.91%. These trends suggest a challenging market environment, potentially impacted by various factors affecting the demand for PU microspheres in Hong Kong.
Hong Kong Polyurethane (PU) Microspheres Market Synopsis
The polyurethane microspheres market in Hong Kong is emerging as a significant segment due to their diverse applications in coatings, cosmetics, and pharmaceuticals. PU microspheres offer unique properties such as controlled release and encapsulation, making them ideal for various formulations. As industries seek innovative solutions that enhance product performance and sustainability, the demand for polyurethane microspheres is expected to rise.
Drivers of the market
The polyurethane microspheres market in Hong Kong is expanding due to their applications in coatings, adhesives, and cosmetic products. PU microspheres are valued for their ability to enhance texture and provide a smooth finish in various formulations. The growing demand for high-performance coatings and the increasing interest in innovative cosmetic formulations are propelling the growth of the PU microspheres market.
Challenges of the market
The polyurethane (PU) microspheres market in Hong Kong faces challenges primarily due to high production costs and limited availability of raw materials. Additionally, competition from alternative microsphere materials and stringent regulatory standards regarding chemical safety and environmental impact further complicate market expansion. The market also struggles to cater to diverse application needs, especially in coatings and adhesives, which require consistent performance.
Government Policy of the market
The polyurethane microspheres market in Hong Kong is driven by government policies encouraging the use of advanced materials in coatings, adhesives, and medical applications. The government promotes the adoption of polyurethane microspheres due to their versatility, durability, and high-performance characteristics. Regulatory bodies ensure that polyurethane microspheres comply with safety, quality, and environmental standards, fostering their use in various sectors.
Key Highlights of the Report:
- Hong Kong Polyurethane (PU) Microspheres Market Outlook
- Market Size of Hong Kong Polyurethane (PU) Microspheres Market, 2024
- Forecast of Hong Kong Polyurethane (PU) Microspheres Market, 2031
- Historical Data and Forecast of Hong Kong Polyurethane (PU) Microspheres Revenues & Volume for the Period 2021-2031
- Hong Kong Polyurethane (PU) Microspheres Market Trend Evolution
- Hong Kong Polyurethane (PU) Microspheres Market Drivers and Challenges
- Hong Kong Polyurethane (PU) Microspheres Price Trends
- Hong Kong Polyurethane (PU) Microspheres Porter`s Five Forces
- Hong Kong Polyurethane (PU) Microspheres Industry Life Cycle
- Historical Data and Forecast of Hong Kong Polyurethane (PU) Microspheres Market Revenues & Volume By Applications for the Period 2021-2031
- Historical Data and Forecast of Hong Kong Polyurethane (PU) Microspheres Market Revenues & Volume By Encapsulation for the Period 2021-2031
- Historical Data and Forecast of Hong Kong Polyurethane (PU) Microspheres Market Revenues & Volume By Paints & coatings for the Period 2021-2031
- Historical Data and Forecast of Hong Kong Polyurethane (PU) Microspheres Market Revenues & Volume By Adhesives films for the Period 2021-2031
- Historical Data and Forecast of Hong Kong Polyurethane (PU) Microspheres Market Revenues & Volume By Cosmetics for the Period 2021-2031
- Historical Data and Forecast of Hong Kong Polyurethane (PU) Microspheres Market Revenues & Volume By Other applications for the Period 2021-2031
- Hong Kong Polyurethane (PU) Microspheres Import Export Trade Statistics
- Market Opportunity Assessment By Applications
- Hong Kong Polyurethane (PU) Microspheres Top Companies Market Share
- Hong Kong Polyurethane (PU) Microspheres Competitive Benchmarking By Technical and Operational Parameters
- Hong Kong Polyurethane (PU) Microspheres Company Profiles
- Hong Kong Polyurethane (PU) Microspheres Key Strategic Recommendations
Frequently Asked Questions About the Market Study (FAQs):
6Wresearch actively monitors the Hong Kong Polyurethane (PU) Microspheres Market and publishes its comprehensive annual report, highlighting emerging trends, growth drivers, revenue analysis, and forecast outlook. Our insights help businesses to make data-backed strategic decisions with ongoing market dynamics. Our analysts track relevent industries related to the Hong Kong Polyurethane (PU) Microspheres Market, allowing our clients with actionable intelligence and reliable forecasts tailored to emerging regional needs.
Yes, we provide customisation as per your requirements. To learn more, feel free to contact us on sales@6wresearch.com
1 Executive Summary |
2 Introduction |
2.1 Key Highlights of the Report |
2.2 Report Description |
2.3 Market Scope & Segmentation |
2.4 Research Methodology |
2.5 Assumptions |
3 Hong Kong Polyurethane (PU) Microspheres Market Overview |
3.1 Hong Kong Country Macro Economic Indicators |
3.2 Hong Kong Polyurethane (PU) Microspheres Market Revenues & Volume, 2021 & 2031F |
3.3 Hong Kong Polyurethane (PU) Microspheres Market - Industry Life Cycle |
3.4 Hong Kong Polyurethane (PU) Microspheres Market - Porter's Five Forces |
3.5 Hong Kong Polyurethane (PU) Microspheres Market Revenues & Volume Share, By Applications, 2021 & 2031F |
4 Hong Kong Polyurethane (PU) Microspheres Market Dynamics |
4.1 Impact Analysis |
4.2 Market Drivers |
4.2.1 Increasing demand for lightweight materials in industries such as automotive, aerospace, and construction |
4.2.2 Growing awareness about the benefits of using polyurethane microspheres in various applications |
4.2.3 Technological advancements leading to the development of innovative products and applications |
4.3 Market Restraints |
4.3.1 Volatility in raw material prices impacting the production cost of polyurethane microspheres |
4.3.2 Stringent regulations and environmental concerns related to the use of polyurethane materials |
4.3.3 Competition from alternative materials like glass bubbles or ceramic microspheres |
5 Hong Kong Polyurethane (PU) Microspheres Market Trends |
6 Hong Kong Polyurethane (PU) Microspheres Market Segmentations |
6.1 Hong Kong Polyurethane (PU) Microspheres Market, By Applications |
6.1.1 Overview and Analysis |
6.1.2 Hong Kong Polyurethane (PU) Microspheres Market Revenues & Volume, By Encapsulation, 2021-2031F |
6.1.3 Hong Kong Polyurethane (PU) Microspheres Market Revenues & Volume, By Paints & coatings, 2021-2031F |
6.1.4 Hong Kong Polyurethane (PU) Microspheres Market Revenues & Volume, By Adhesives films, 2021-2031F |
6.1.5 Hong Kong Polyurethane (PU) Microspheres Market Revenues & Volume, By Cosmetics, 2021-2031F |
6.1.6 Hong Kong Polyurethane (PU) Microspheres Market Revenues & Volume, By Other applications, 2021-2031F |
7 Hong Kong Polyurethane (PU) Microspheres Market Import-Export Trade Statistics |
7.1 Hong Kong Polyurethane (PU) Microspheres Market Export to Major Countries |
7.2 Hong Kong Polyurethane (PU) Microspheres Market Imports from Major Countries |
8 Hong Kong Polyurethane (PU) Microspheres Market Key Performance Indicators |
8.1 Research and development investment in new polyurethane microsphere products |
8.2 Adoption rate of polyurethane microspheres in key industries |
8.3 Number of patents filed for polyurethane microsphere technologies |
8.4 Percentage increase in the number of applications utilizing polyurethane microspheres |
8.5 Customer satisfaction and feedback on the performance of polyurethane microsphere products |
9 Hong Kong Polyurethane (PU) Microspheres Market - Opportunity Assessment |
9.1 Hong Kong Polyurethane (PU) Microspheres Market Opportunity Assessment, By Applications, 2021 & 2031F |
10 Hong Kong Polyurethane (PU) Microspheres Market - Competitive Landscape |
10.1 Hong Kong Polyurethane (PU) Microspheres Market Revenue Share, By Companies, 2024 |
10.2 Hong Kong Polyurethane (PU) Microspheres Market Competitive Benchmarking, By Operating and Technical Parameters |
11 Company Profiles |
12 Recommendations | 13 Disclaimer |
Export potential assessment - trade Analytics for 2030
Export potential enables firms to identify high-growth global markets with greater confidence by combining advanced trade intelligence with a structured quantitative methodology. The framework analyzes emerging demand trends and country-level import patterns while integrating macroeconomic and trade datasets such as GDP and population forecasts, bilateral import–export flows, tariff structures, elasticity differentials between developed and developing economies, geographic distance, and import demand projections. Using weighted trade values from 2020–2024 as the base period to project country-to-country export potential for 2030, these inputs are operationalized through calculated drivers such as gravity model parameters, tariff impact factors, and projected GDP per-capita growth. Through an analysis of hidden potentials, demand hotspots, and market conditions that are most favorable to success, this method enables firms to focus on target countries, maximize returns, and global expansion with data, backed by accuracy.
By factoring in the projected importer demand gap that is currently unmet and could be potential opportunity, it identifies the potential for the Exporter (Country) among 190 countries, against the general trade analysis, which identifies the biggest importer or exporter.
To discover high-growth global markets and optimize your business strategy:
Click Here
Pricing
- Single User License$ 1,995
- Department License$ 2,400
- Site License$ 3,120
- Global License$ 3,795

Search
Thought Leadership and Analyst Meet


Our Clients
Latest Reports
- France Thermally Conductive Filler Dispersants Market (2026-2032) | Challenges, Restraints, Value, Share, Size, segmentation, Analysis, Trends, Investment Opportunities, Outlook, Pricing, Demand, Forecast, Revenue, Companies, Growth, Drivers, Strategy, Insights, Competition
- Egypt Thermally Conductive Filler Dispersants Market (2026-2032) | Competition, Forecast, Strategy, Value, Insights, Outlook, Investment Opportunities, Pricing, Demand, Share, segmentation, Drivers, Size, Companies, Restraints, Growth, Trends, Revenue, Challenges, Analysis
- Czech Republic Thermally Conductive Filler Dispersants Market (2026-2032) | Forecast, Pricing, Analysis, Drivers, Insights, Size, Demand, Growth, Challenges, segmentation, Competition, Outlook, Trends, Investment Opportunities, Companies, Strategy, Revenue, Share, Value, Restraints
- Colombia Thermally Conductive Filler Dispersants Market (2026-2032) | segmentation, Trends, Share, Drivers, Strategy, Companies, Demand, Insights, Size, Challenges, Value, Competition, Analysis, Growth, Revenue, Restraints, Forecast, Pricing, Outlook, Investment Opportunities
- China Thermally Conductive Filler Dispersants Market (2026-2032) | Restraints, Investment Opportunities, Pricing, Companies, Share, Size, Challenges, Trends, Outlook, Value, Analysis, Competition, Revenue, Drivers, Forecast, Demand, Insights, Growth, Strategy, segmentation
- Chile Thermally Conductive Filler Dispersants Market (2026-2032) | Investment Opportunities, Trends, Value, Restraints, Share, Companies, Forecast, segmentation, Pricing, Challenges, Demand, Size, Analysis, Drivers, Outlook, Growth, Competition, Strategy, Revenue, Insights
- Cambodia Thermally Conductive Filler Dispersants Market (2026-2032) | Analysis, Share, Outlook, Strategy, Pricing, Demand, Size, Growth, segmentation, Insights, Revenue, Forecast, Challenges, Competition, Companies, Investment Opportunities, Trends, Restraints, Value, Drivers
- Brazil Thermally Conductive Filler Dispersants Market (2026-2032) | Restraints, Forecast, Competition, Size, Revenue, Value, Investment Opportunities, Trends, Insights, Outlook, Growth, Analysis, Drivers, segmentation, Pricing, Challenges, Strategy, Share, Companies, Demand
- Bangladesh Thermally Conductive Filler Dispersants Market (2026-2032) | Restraints, Trends, Analysis, Competition, Insights, Forecast, Value, Investment Opportunities, Pricing, Share, Demand, Outlook, Revenue, segmentation, Companies, Drivers, Growth, Size, Challenges, Strategy
- Bahrain Thermally Conductive Filler Dispersants Market (2026-2032) | Trends, Outlook, Pricing, Demand, Value, Competition, Forecast, Growth, segmentation, Revenue, Companies, Analysis, Insights, Size, Drivers, Challenges, Strategy, Investment Opportunities, Share, Restraints
Industry Events and Analyst Meet

HIMTEX 2026

India Refining Summit 2026

India EV Show 2026

EV tech India Expo 2026

Auto Tech Asia 2026
Whitepaper
- Middle East & Africa Commercial Security Market Click here to view more.
- Middle East & Africa Fire Safety Systems & Equipment Market Click here to view more.
- GCC Drone Market Click here to view more.
- Middle East Lighting Fixture Market Click here to view more.
- GCC Physical & Perimeter Security Market Click here to view more.
6WResearch In News
- Doha a strategic location for EV manufacturing hub: IPA Qatar
- Demand for luxury TVs surging in the GCC, says Samsung
- Empowering Growth: The Thriving Journey of Bangladesh’s Cable Industry
- Demand for luxury TVs surging in the GCC, says Samsung
- Video call with a traditional healer? Once unthinkable, it’s now common in South Africa
- Intelligent Buildings To Smooth GCC’s Path To Net Zero