Hong Kong Tamarind Extract Market (2026-2032) | Strategic Insights, Forecast, Strategy, Opportunities, Industry, Size, Supply, Competition, Investment Trends, Pricing Analysis, Outlook, Drivers, Demand, Companies, Segmentation, Consumer Insights, Segments, Growth, Restraints, Trends, Revenue, Analysis, Competitive, Value, Challenges, Share
Market Forecast By Product Type (Liquid Extract, Powder Extract, Paste Extract), By Application (Beverages, Food Processing, Pharmaceuticals), By Form (Liquid, Powder, Paste), By Active Component (Tartaric Acid, Polyphenols, Antioxidants), By End Use (Soft Drinks, Confectionery, Herbal Medicine) And Competitive Landscape
| Product Code: ETC10898283 | Publication Date: Apr 2025 | Updated Date: Apr 2026 | Product Type: Market Research Report | |
| Publisher: 6Wresearch | No. of Pages: 65 | No. of Figures: 34 | No. of Tables: 19 | |
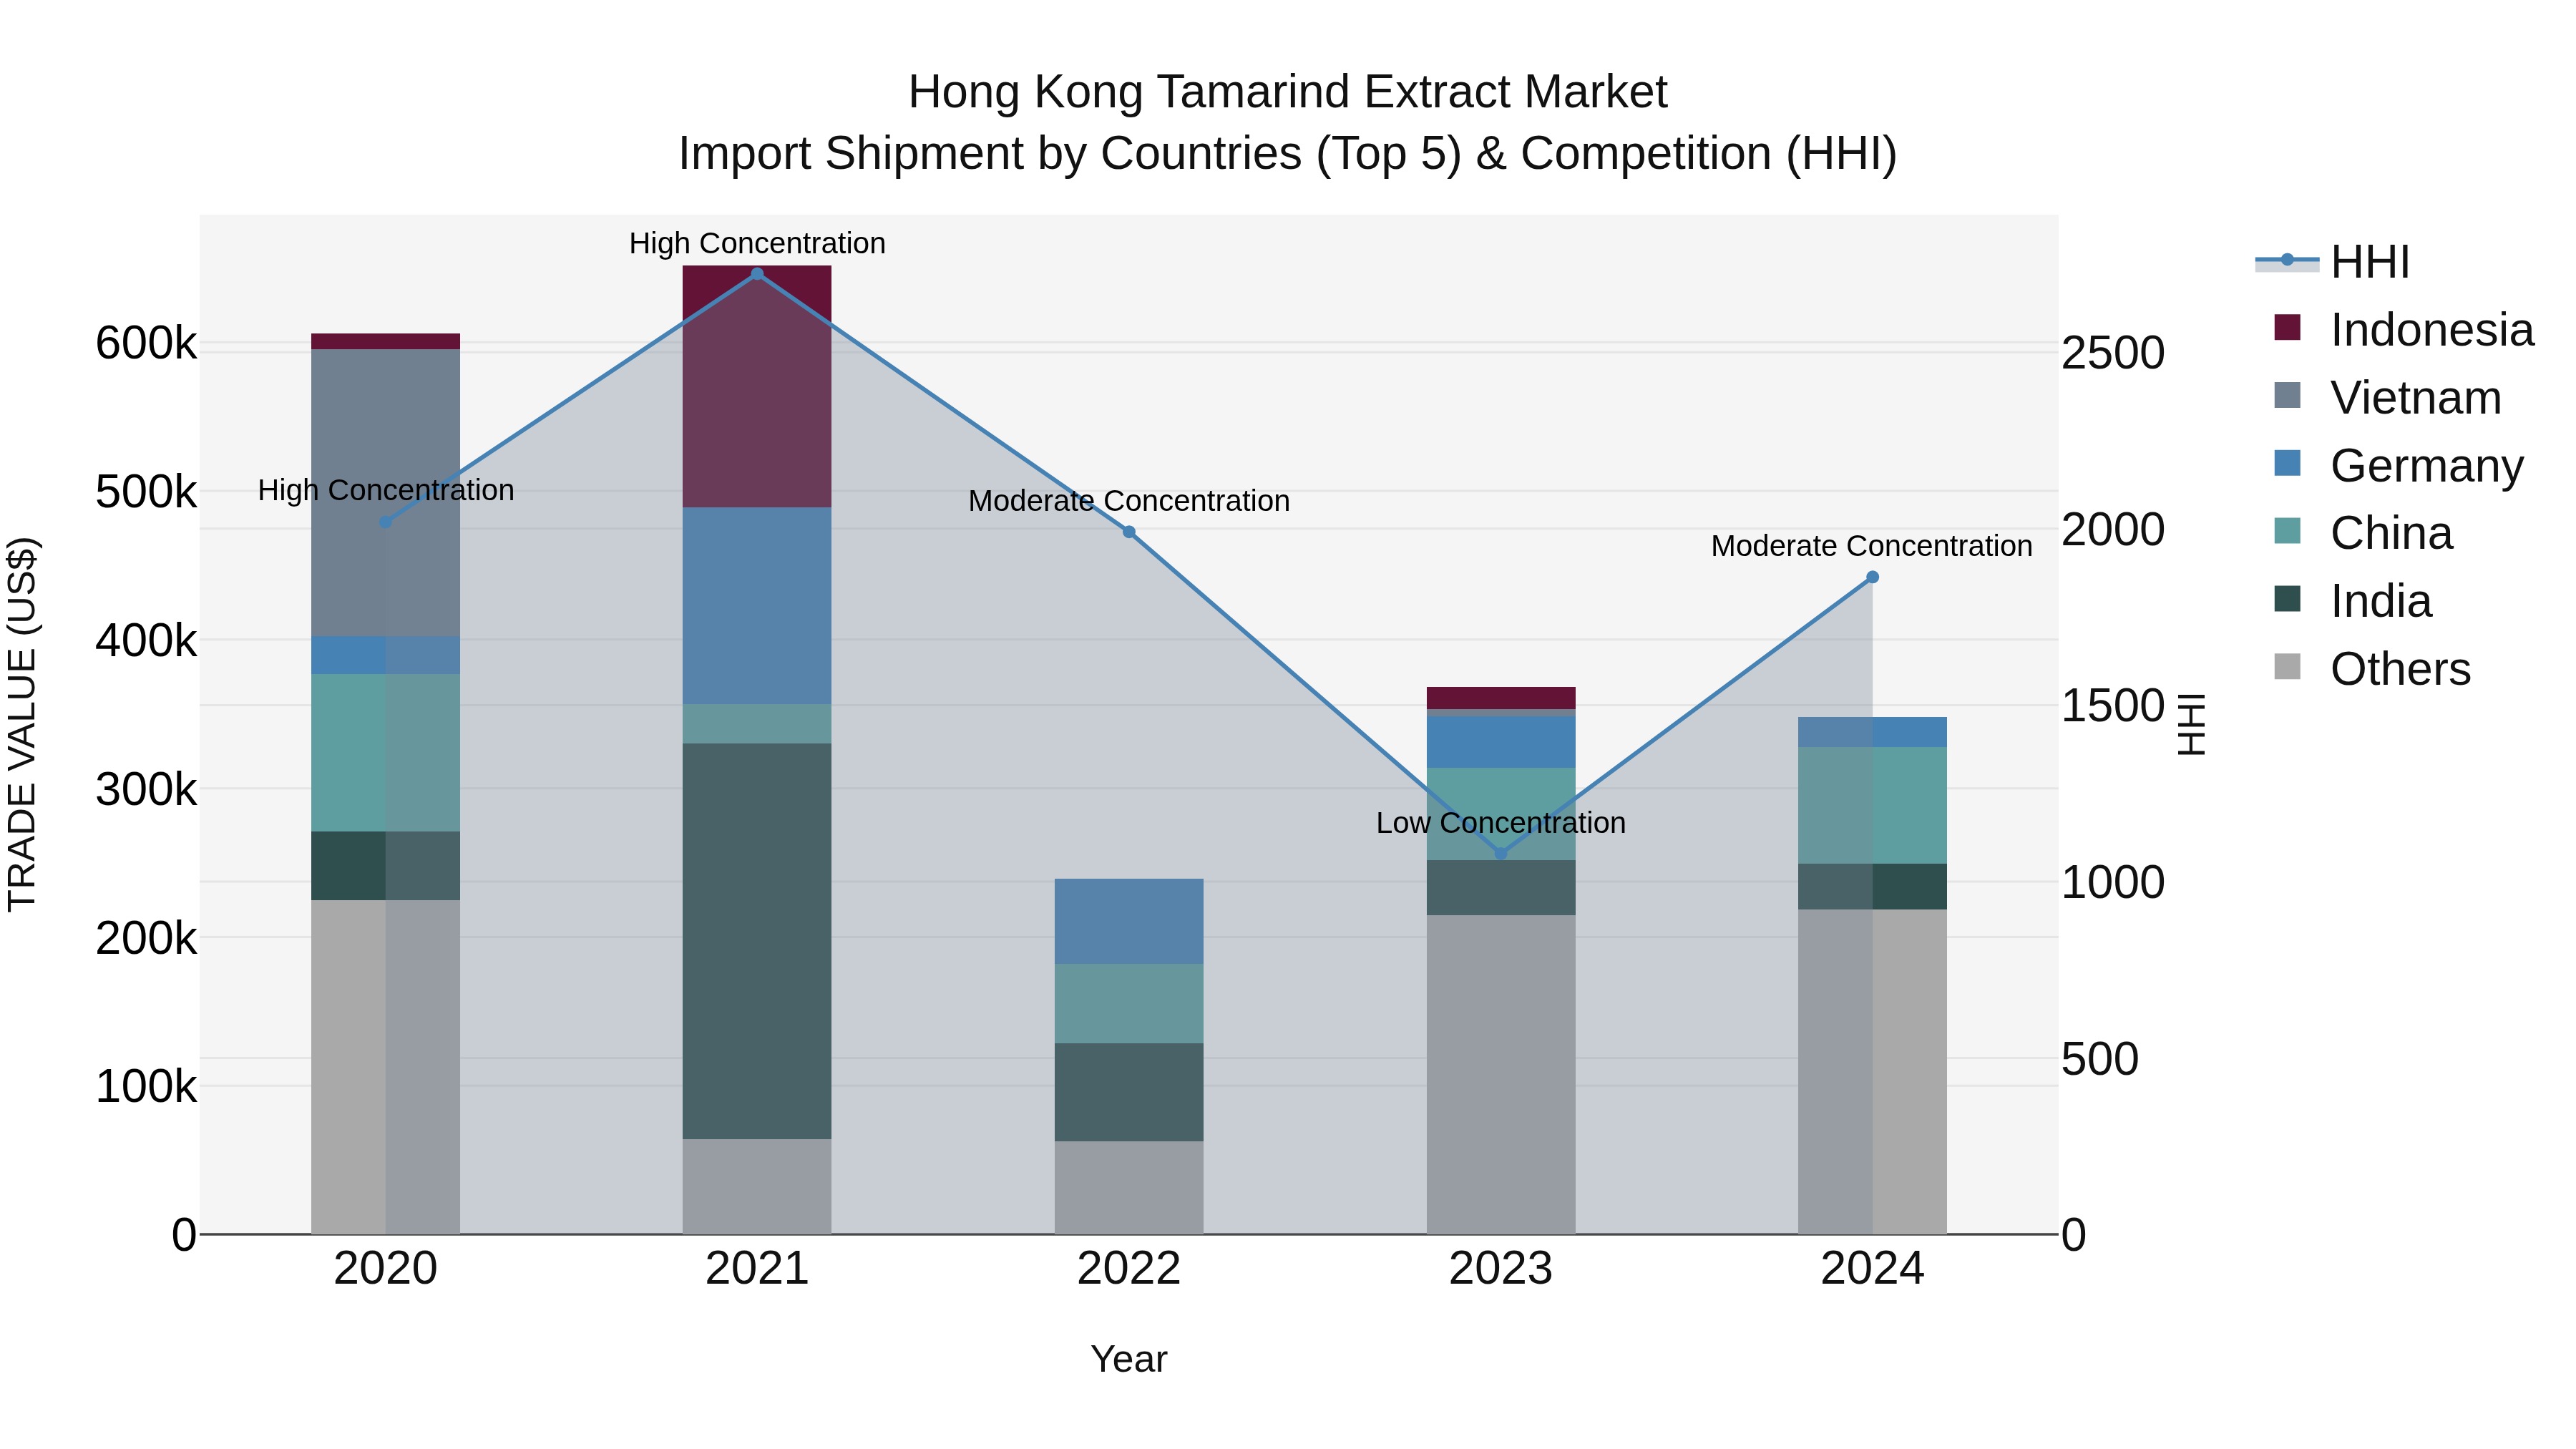
Hong Kong Tamarind Extract Market Top 5 Importing Countries and Market Competition (HHI) Analysis
The import shipments of tamarind extract to Hong Kong in 2024 saw a shift in concentration levels from low to moderate, indicating a more balanced distribution among top exporting countries. Italy, China, Canada, India, and the UAE emerged as key players in supplying tamarind extract to Hong Kong. Despite the negative CAGR and growth rate, the market seems to be stabilizing, possibly due to increased competition and diversification of sources. It will be interesting to monitor how these trends continue to evolve in the coming years.
Key Highlights of the Report:
- Hong Kong Tamarind Extract Market Outlook
- Market Size of Hong Kong Tamarind Extract Market, 2025
- Forecast of Hong Kong Tamarind Extract Market, 2032
- Historical Data and Forecast of Hong Kong Tamarind Extract Revenues & Volume for the Period 2022 - 2032F
- Hong Kong Tamarind Extract Market Trend Evolution
- Hong Kong Tamarind Extract Market Drivers and Challenges
- Hong Kong Tamarind Extract Price Trends
- Hong Kong Tamarind Extract Porter's Five Forces
- Hong Kong Tamarind Extract Industry Life Cycle
- Historical Data and Forecast of Hong Kong Tamarind Extract Market Revenues & Volume By Product Type for the Period 2022 - 2032F
- Historical Data and Forecast of Hong Kong Tamarind Extract Market Revenues & Volume By Liquid Extract for the Period 2022 - 2032F
- Historical Data and Forecast of Hong Kong Tamarind Extract Market Revenues & Volume By Powder Extract for the Period 2022 - 2032F
- Historical Data and Forecast of Hong Kong Tamarind Extract Market Revenues & Volume By Paste Extract for the Period 2022 - 2032F
- Historical Data and Forecast of Hong Kong Tamarind Extract Market Revenues & Volume By Application for the Period 2022 - 2032F
- Historical Data and Forecast of Hong Kong Tamarind Extract Market Revenues & Volume By Beverages for the Period 2022 - 2032F
- Historical Data and Forecast of Hong Kong Tamarind Extract Market Revenues & Volume By Food Processing for the Period 2022 - 2032F
- Historical Data and Forecast of Hong Kong Tamarind Extract Market Revenues & Volume By Pharmaceuticals for the Period 2022 - 2032F
- Historical Data and Forecast of Hong Kong Tamarind Extract Market Revenues & Volume By Form for the Period 2022 - 2032F
- Historical Data and Forecast of Hong Kong Tamarind Extract Market Revenues & Volume By Liquid for the Period 2022 - 2032F
- Historical Data and Forecast of Hong Kong Tamarind Extract Market Revenues & Volume By Powder for the Period 2022 - 2032F
- Historical Data and Forecast of Hong Kong Tamarind Extract Market Revenues & Volume By Paste for the Period 2022 - 2032F
- Historical Data and Forecast of Hong Kong Tamarind Extract Market Revenues & Volume By Active Component for the Period 2022 - 2032F
- Historical Data and Forecast of Hong Kong Tamarind Extract Market Revenues & Volume By Tartaric Acid for the Period 2022 - 2032F
- Historical Data and Forecast of Hong Kong Tamarind Extract Market Revenues & Volume By Polyphenols for the Period 2022 - 2032F
- Historical Data and Forecast of Hong Kong Tamarind Extract Market Revenues & Volume By Antioxidants for the Period 2022 - 2032F
- Historical Data and Forecast of Hong Kong Tamarind Extract Market Revenues & Volume By End Use for the Period 2022 - 2032F
- Historical Data and Forecast of Hong Kong Tamarind Extract Market Revenues & Volume By Soft Drinks for the Period 2022 - 2032F
- Historical Data and Forecast of Hong Kong Tamarind Extract Market Revenues & Volume By Confectionery for the Period 2022 - 2032F
- Historical Data and Forecast of Hong Kong Tamarind Extract Market Revenues & Volume By Herbal Medicine for the Period 2022 - 2032F
- Hong Kong Tamarind Extract Import Export Trade Statistics
- Market Opportunity Assessment By Product Type
- Market Opportunity Assessment By Application
- Market Opportunity Assessment By Form
- Market Opportunity Assessment By Active Component
- Market Opportunity Assessment By End Use
- Hong Kong Tamarind Extract Top Companies Market Share
- Hong Kong Tamarind Extract Competitive Benchmarking By Technical and Operational Parameters
- Hong Kong Tamarind Extract Company Profiles
- Hong Kong Tamarind Extract Key Strategic Recommendations
Frequently Asked Questions About the Market Study (FAQs):
6Wresearch actively monitors the Hong Kong Tamarind Extract Market and publishes its comprehensive annual report, highlighting emerging trends, growth drivers, revenue analysis, and forecast outlook. Our insights help businesses to make data-backed strategic decisions with ongoing market dynamics. Our analysts track relevent industries related to the Hong Kong Tamarind Extract Market, allowing our clients with actionable intelligence and reliable forecasts tailored to emerging regional needs.
Yes, we provide customisation as per your requirements. To learn more, feel free to contact us on sales@6wresearch.com
1 Executive Summary |
2 Introduction |
2.1 Key Highlights of the Report |
2.2 Report Description |
2.3 Market Scope & Segmentation |
2.4 Research Methodology |
2.5 Assumptions |
3 Hong Kong Tamarind Extract Market Overview |
3.1 Hong Kong Country Macro Economic Indicators |
3.2 Hong Kong Tamarind Extract Market Revenues & Volume, 2022 & 2032F |
3.3 Hong Kong Tamarind Extract Market - Industry Life Cycle |
3.4 Hong Kong Tamarind Extract Market - Porter's Five Forces |
3.5 Hong Kong Tamarind Extract Market Revenues & Volume Share, By Product Type, 2022 & 2032F |
3.6 Hong Kong Tamarind Extract Market Revenues & Volume Share, By Application, 2022 & 2032F |
3.7 Hong Kong Tamarind Extract Market Revenues & Volume Share, By Form, 2022 & 2032F |
3.8 Hong Kong Tamarind Extract Market Revenues & Volume Share, By Active Component, 2022 & 2032F |
3.9 Hong Kong Tamarind Extract Market Revenues & Volume Share, By End Use, 2022 & 2032F |
4 Hong Kong Tamarind Extract Market Dynamics |
4.1 Impact Analysis |
4.2 Market Drivers |
4.2.1 Increasing consumer awareness about the health benefits of tamarind extract |
4.2.2 Growing demand for natural and organic ingredients in food and beverage industry |
4.2.3 Rising prevalence of lifestyle diseases driving the demand for functional food ingredients |
4.3 Market Restraints |
4.3.1 Limited availability and sourcing challenges of tamarind in certain regions |
4.3.2 Fluctuating prices of tamarind due to seasonal variations and global supply chain disruptions |
5 Hong Kong Tamarind Extract Market Trends |
6 Hong Kong Tamarind Extract Market, By Types |
6.1 Hong Kong Tamarind Extract Market, By Product Type |
6.1.1 Overview and Analysis |
6.1.2 Hong Kong Tamarind Extract Market Revenues & Volume, By Product Type, 2022 - 2032F |
6.1.3 Hong Kong Tamarind Extract Market Revenues & Volume, By Liquid Extract, 2022 - 2032F |
6.1.4 Hong Kong Tamarind Extract Market Revenues & Volume, By Powder Extract, 2022 - 2032F |
6.1.5 Hong Kong Tamarind Extract Market Revenues & Volume, By Paste Extract, 2022 - 2032F |
6.2 Hong Kong Tamarind Extract Market, By Application |
6.2.1 Overview and Analysis |
6.2.2 Hong Kong Tamarind Extract Market Revenues & Volume, By Beverages, 2022 - 2032F |
6.2.3 Hong Kong Tamarind Extract Market Revenues & Volume, By Food Processing, 2022 - 2032F |
6.2.4 Hong Kong Tamarind Extract Market Revenues & Volume, By Pharmaceuticals, 2022 - 2032F |
6.3 Hong Kong Tamarind Extract Market, By Form |
6.3.1 Overview and Analysis |
6.3.2 Hong Kong Tamarind Extract Market Revenues & Volume, By Liquid, 2022 - 2032F |
6.3.3 Hong Kong Tamarind Extract Market Revenues & Volume, By Powder, 2022 - 2032F |
6.3.4 Hong Kong Tamarind Extract Market Revenues & Volume, By Paste, 2022 - 2032F |
6.4 Hong Kong Tamarind Extract Market, By Active Component |
6.4.1 Overview and Analysis |
6.4.2 Hong Kong Tamarind Extract Market Revenues & Volume, By Tartaric Acid, 2022 - 2032F |
6.4.3 Hong Kong Tamarind Extract Market Revenues & Volume, By Polyphenols, 2022 - 2032F |
6.4.4 Hong Kong Tamarind Extract Market Revenues & Volume, By Antioxidants, 2022 - 2032F |
6.5 Hong Kong Tamarind Extract Market, By End Use |
6.5.1 Overview and Analysis |
6.5.2 Hong Kong Tamarind Extract Market Revenues & Volume, By Soft Drinks, 2022 - 2032F |
6.5.3 Hong Kong Tamarind Extract Market Revenues & Volume, By Confectionery, 2022 - 2032F |
6.5.4 Hong Kong Tamarind Extract Market Revenues & Volume, By Herbal Medicine, 2022 - 2032F |
7 Hong Kong Tamarind Extract Market Import-Export Trade Statistics |
7.1 Hong Kong Tamarind Extract Market Export to Major Countries |
7.2 Hong Kong Tamarind Extract Market Imports from Major Countries |
8 Hong Kong Tamarind Extract Market Key Performance Indicators |
8.1 Average selling price of tamarind extract products |
8.2 Number of new product launches containing tamarind extract |
8.3 Percentage of market share held by tamarind extract products |
8.4 Consumer sentiment and perception towards tamarind extract as a functional ingredient |
8.5 Number of research studies highlighting the health benefits of tamarind extract |
9 Hong Kong Tamarind Extract Market - Opportunity Assessment |
9.1 Hong Kong Tamarind Extract Market Opportunity Assessment, By Product Type, 2022 & 2032F |
9.2 Hong Kong Tamarind Extract Market Opportunity Assessment, By Application, 2022 & 2032F |
9.3 Hong Kong Tamarind Extract Market Opportunity Assessment, By Form, 2022 & 2032F |
9.4 Hong Kong Tamarind Extract Market Opportunity Assessment, By Active Component, 2022 & 2032F |
9.5 Hong Kong Tamarind Extract Market Opportunity Assessment, By End Use, 2022 & 2032F |
10 Hong Kong Tamarind Extract Market - Competitive Landscape |
10.1 Hong Kong Tamarind Extract Market Revenue Share, By Companies, 2025 |
10.2 Hong Kong Tamarind Extract Market Competitive Benchmarking, By Operating and Technical Parameters |
11 Company Profiles |
12 Recommendations |
13 Disclaimer |
Export potential assessment - trade Analytics for 2030
Export potential enables firms to identify high-growth global markets with greater confidence by combining advanced trade intelligence with a structured quantitative methodology. The framework analyzes emerging demand trends and country-level import patterns while integrating macroeconomic and trade datasets such as GDP and population forecasts, bilateral import–export flows, tariff structures, elasticity differentials between developed and developing economies, geographic distance, and import demand projections. Using weighted trade values from 2020–2024 as the base period to project country-to-country export potential for 2030, these inputs are operationalized through calculated drivers such as gravity model parameters, tariff impact factors, and projected GDP per-capita growth. Through an analysis of hidden potentials, demand hotspots, and market conditions that are most favorable to success, this method enables firms to focus on target countries, maximize returns, and global expansion with data, backed by accuracy.
By factoring in the projected importer demand gap that is currently unmet and could be potential opportunity, it identifies the potential for the Exporter (Country) among 190 countries, against the general trade analysis, which identifies the biggest importer or exporter.
To discover high-growth global markets and optimize your business strategy:
Click Here
Pricing
- Single User License$ 1,995
- Department License$ 2,400
- Site License$ 3,120
- Global License$ 3,795

Search
Thought Leadership and Analyst Meet


Our Clients
Latest Reports
- China Electric Appliance Rental Market (2026-2032) | Trends, Revenue, Growth, Challenges, Size, Value, Outlook, Pricing, Strategy, Insights, Restraints, segmentation, Companies, Investment Opportunities, Analysis, Demand, Drivers, Competition, Forecast, Share
- Chile Electric Appliance Rental Market (2026-2032) | Outlook, Competition, Drivers, Strategy, Revenue, Analysis, Value, Pricing, Restraints, Size, Demand, Share, Growth, Forecast, Challenges, Insights, Investment Opportunities, Companies, Trends, segmentation
- Cambodia Electric Appliance Rental Market (2026-2032) | Companies, Analysis, Restraints, Pricing, Insights, Challenges, Outlook, Strategy, Forecast, Trends, Competition, Value, Revenue, Investment Opportunities, segmentation, Drivers, Size, Demand, Growth, Share
- Brazil Electric Appliance Rental Market (2026-2032) | Revenue, Strategy, Forecast, Companies, segmentation, Competition, Size, Investment Opportunities, Pricing, Restraints, Outlook, Challenges, Analysis, Drivers, Value, Demand, Insights, Trends, Growth, Share
- Bangladesh Electric Appliance Rental Market (2026-2032) | Drivers, Forecast, Investment Opportunities, Strategy, Insights, Demand, Challenges, Outlook, Trends, Competition, Value, Revenue, Size, Pricing, Analysis, Companies, Restraints, segmentation, Share, Growth
- Bahrain Electric Appliance Rental Market (2026-2032) | Outlook, Size, Competition, Restraints, Drivers, Value, Trends, Investment Opportunities, Insights, Forecast, Revenue, Strategy, Growth, Share, Demand, Analysis, Challenges, Companies, segmentation, Pricing
- Azerbaijan Electric Appliance Rental Market (2026-2032) | Trends, Investment Opportunities, Restraints, Insights, Strategy, Competition, Value, Growth, Demand, Drivers, Analysis, Forecast, Size, Share, Outlook, segmentation, Pricing, Challenges, Revenue, Companies
- Australia Electric Appliance Rental Market (2026-2032) | Challenges, Restraints, Forecast, Demand, Size, Competition, Pricing, Investment Opportunities, Revenue, Trends, Drivers, Growth, Outlook, Analysis, Strategy, Value, segmentation, Insights, Companies, Share
- Argentina Electric Appliance Rental Market (2026-2032) | Growth, Trends, Insights, Outlook, Forecast, Size, Drivers, Analysis, Restraints, Challenges, Share, Revenue, Investment Opportunities, Strategy, Demand, Value, Companies, segmentation, Competition, Pricing
- Algeria Electric Appliance Rental Market (2026-2032) | Share, Size, Value, Strategy, Competition, Outlook, Challenges, Companies, Trends, Pricing, Insights, Forecast, Investment Opportunities, Revenue, Growth, Restraints, segmentation, Analysis, Demand, Drivers
Industry Events and Analyst Meet

HIMTEX 2026

India Refining Summit 2026

India EV Show 2026

EV tech India Expo 2026

Auto Tech Asia 2026
Whitepaper
- Middle East & Africa Commercial Security Market Click here to view more.
- Middle East & Africa Fire Safety Systems & Equipment Market Click here to view more.
- GCC Drone Market Click here to view more.
- Middle East Lighting Fixture Market Click here to view more.
- GCC Physical & Perimeter Security Market Click here to view more.
6WResearch In News
- Doha a strategic location for EV manufacturing hub: IPA Qatar
- Demand for luxury TVs surging in the GCC, says Samsung
- Empowering Growth: The Thriving Journey of Bangladesh’s Cable Industry
- Demand for luxury TVs surging in the GCC, says Samsung
- Video call with a traditional healer? Once unthinkable, it’s now common in South Africa
- Intelligent Buildings To Smooth GCC’s Path To Net Zero