Hungary Bioactive Ingredients & Product Market (2025-2031) Outlook | Companies, Value, Share, Trends, Size, Growth, Revenue, Industry, Analysis & Forecast
Market Forecast By Ingredient (Probiotics, Proteins, Plant Extracts, Minerals, Vitamins, Fibers, Carotenoids), By Type (Prebiotics, Probiotics, Amino acids, peptides & proteins, Omega 3 & structured lipids, Phytochemicals & plant extracts, Minerals, Vitamins, Fibers & specialty carbohydrates), By Application (Functional food, Functional beverages, Dietary supplements, Animal nutrition, Personal care) And Competitive Landscape
| Product Code: ETC4600640 | Publication Date: Jul 2023 | Updated Date: Mar 2026 | Product Type: Report | |
| Publisher: 6Wresearch | Author: Ravi Bhandari | No. of Pages: 85 | No. of Figures: 45 | No. of Tables: 25 |
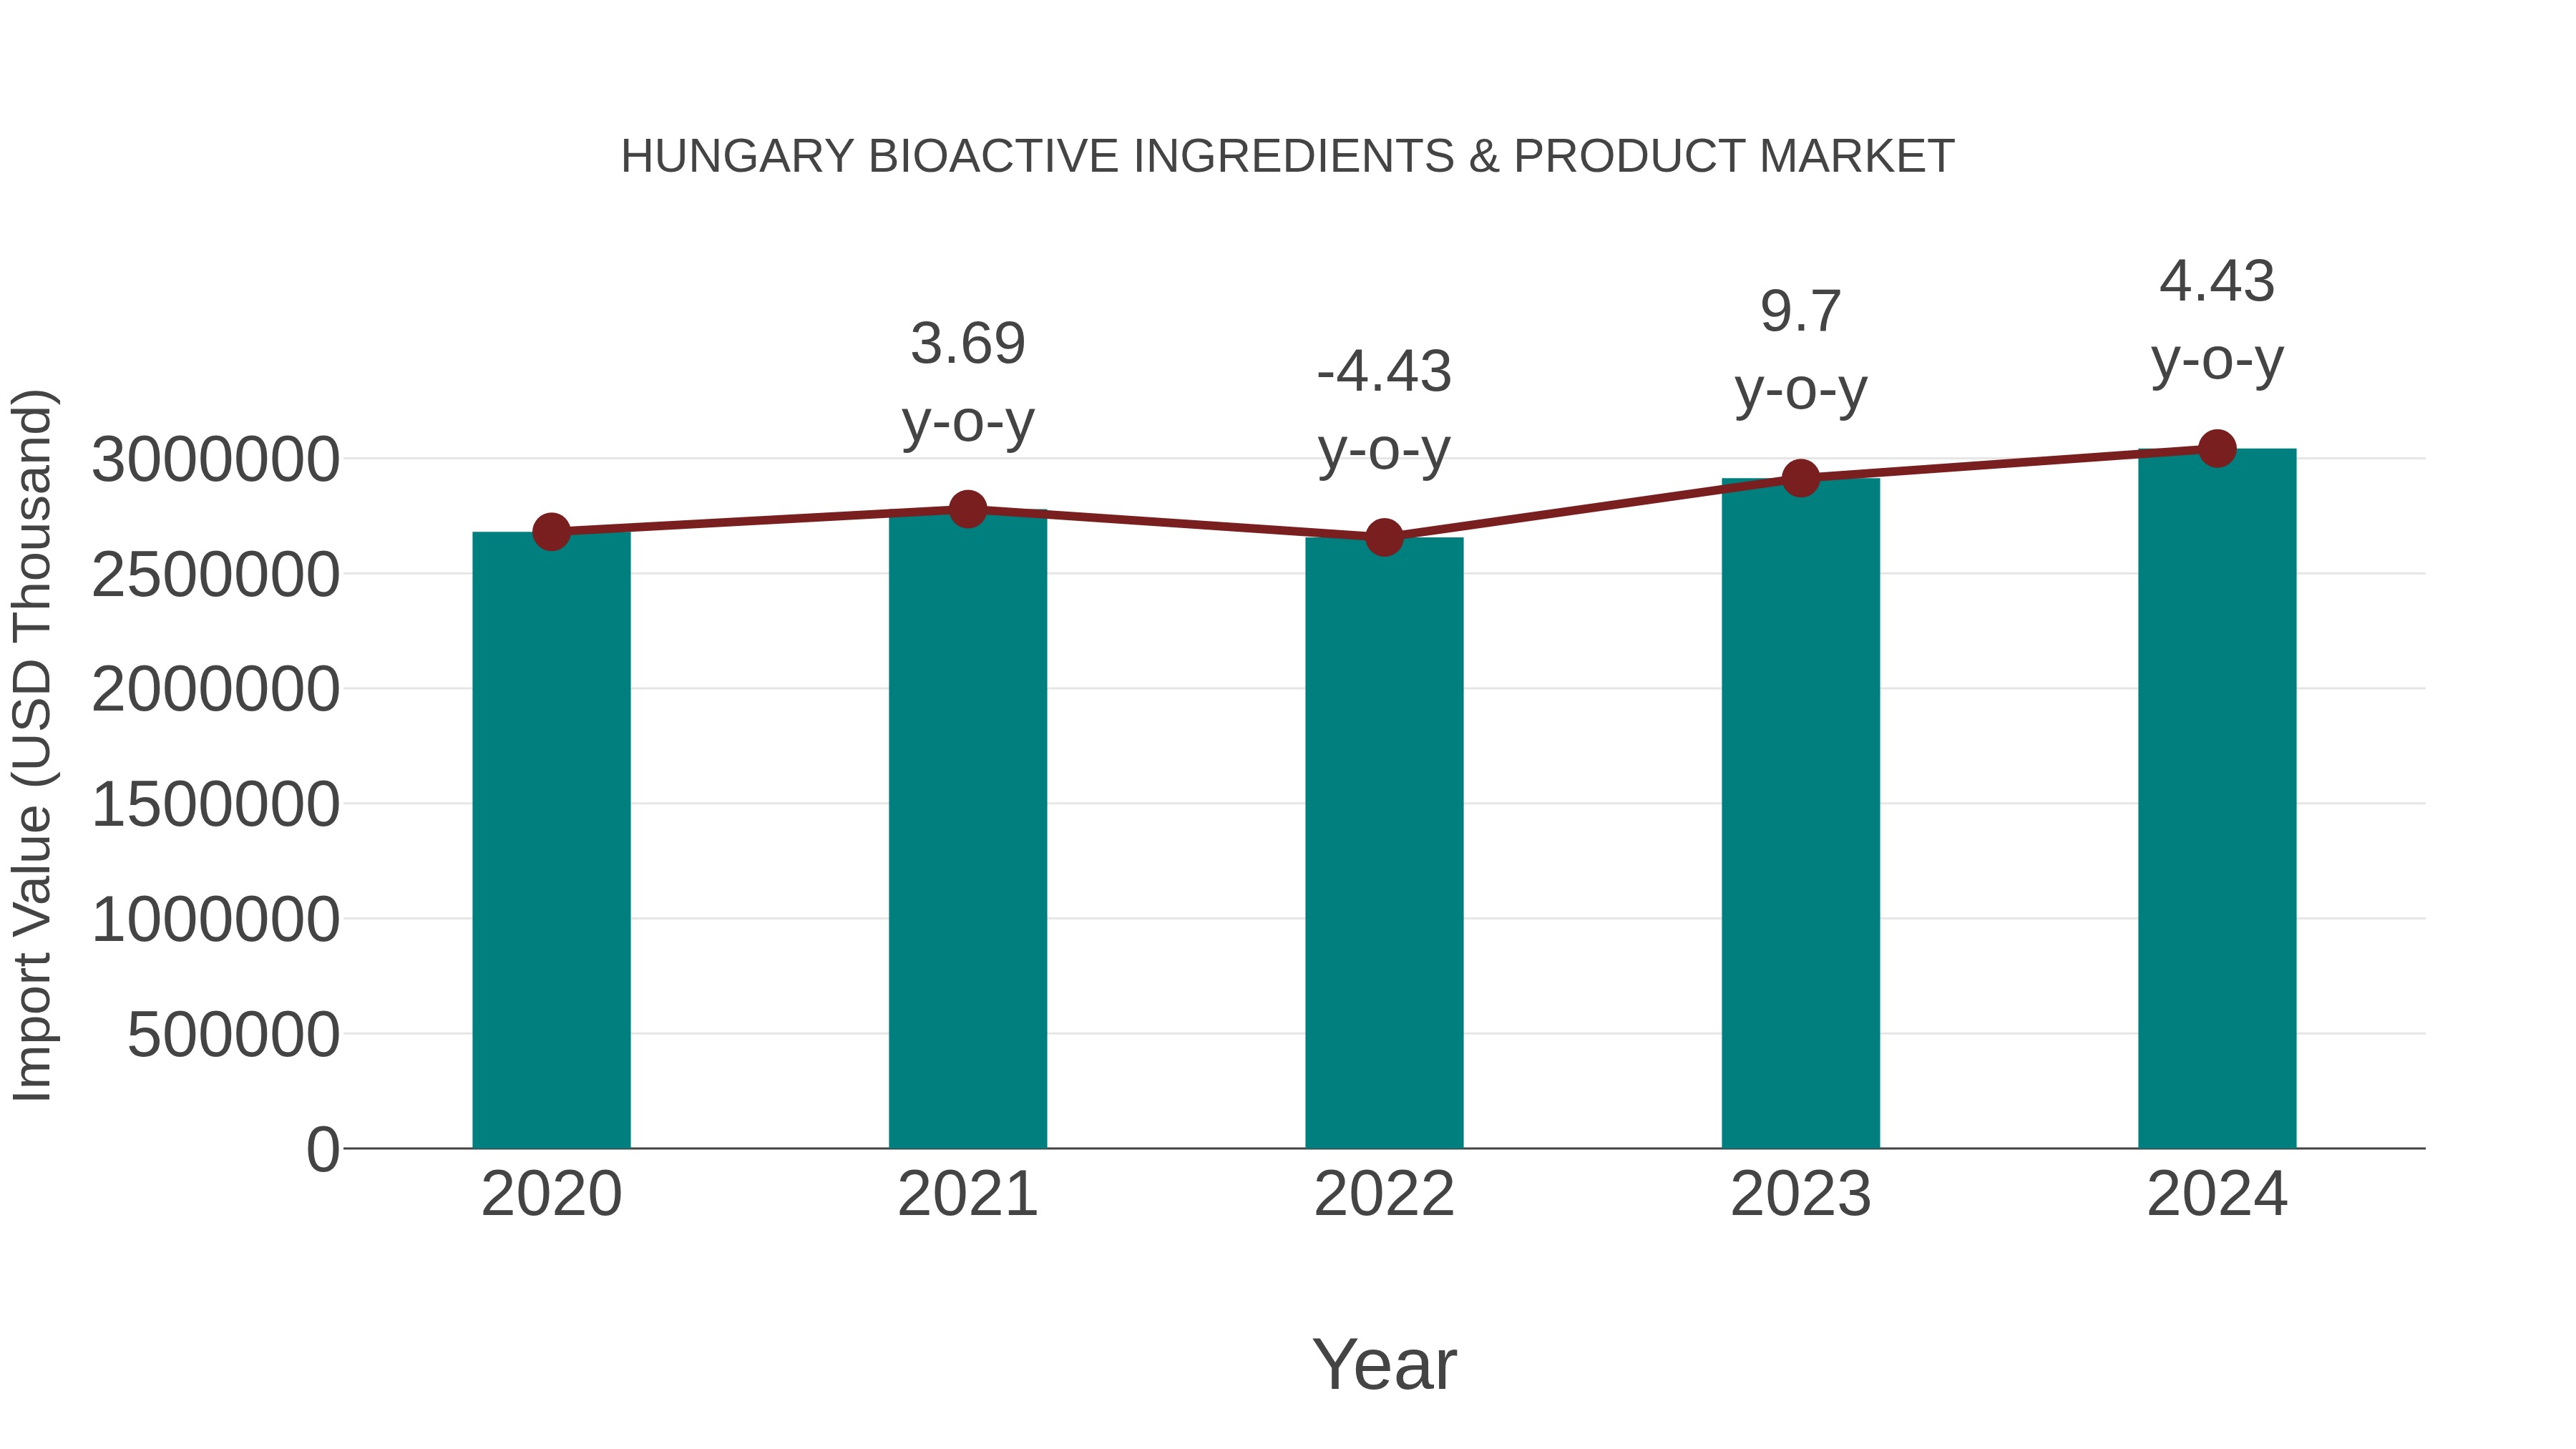
Hungary Bioactive Ingredients & Product Market: Import Trend Analysis
Hungary`s import trend for bioactive ingredients and products in 2024 showed a growth rate of 4.43%, with a compound annual growth rate (CAGR) of 3.22% from 2020 to 2024. This increase in import momentum can be attributed to a rising demand for innovative and health-focused products in the market.
Key Highlights of the Report:
- Hungary Bioactive Ingredients & Product Market Outlook
- Market Size of Hungary Bioactive Ingredients & Product Market, 2024
- Forecast of Hungary Bioactive Ingredients & Product Market, 2031
- Historical Data and Forecast of Hungary Bioactive Ingredients & Product Revenues & Volume for the Period 2021 - 2031
- Hungary Bioactive Ingredients & Product Market Trend Evolution
- Hungary Bioactive Ingredients & Product Market Drivers and Challenges
- Hungary Bioactive Ingredients & Product Price Trends
- Hungary Bioactive Ingredients & Product Porter's Five Forces
- Hungary Bioactive Ingredients & Product Industry Life Cycle
- Historical Data and Forecast of Hungary Bioactive Ingredients & Product Market Revenues & Volume By Ingredient for the Period 2021 - 2031
- Historical Data and Forecast of Hungary Bioactive Ingredients & Product Market Revenues & Volume By Probiotics for the Period 2021 - 2031
- Historical Data and Forecast of Hungary Bioactive Ingredients & Product Market Revenues & Volume By Proteins for the Period 2021 - 2031
- Historical Data and Forecast of Hungary Bioactive Ingredients & Product Market Revenues & Volume By Plant Extracts for the Period 2021 - 2031
- Historical Data and Forecast of Hungary Bioactive Ingredients & Product Market Revenues & Volume By Minerals for the Period 2021 - 2031
- Historical Data and Forecast of Hungary Bioactive Ingredients & Product Market Revenues & Volume By Vitamins for the Period 2021 - 2031
- Historical Data and Forecast of Hungary Bioactive Ingredients & Product Market Revenues & Volume By Fibers for the Period 2021 - 2031
- Historical Data and Forecast of Hungary Bioactive Ingredients & Product Market Revenues & Volume By Carotenoids for the Period 2021 - 2031
- Historical Data and Forecast of Hungary Bioactive Ingredients & Product Market Revenues & Volume By Type for the Period 2021 - 2031
- Historical Data and Forecast of Hungary Bioactive Ingredients & Product Market Revenues & Volume By Prebiotics for the Period 2021 - 2031
- Historical Data and Forecast of Hungary Bioactive Ingredients & Product Market Revenues & Volume By Probiotics for the Period 2021 - 2031
- Historical Data and Forecast of Hungary Bioactive Ingredients & Product Market Revenues & Volume By Amino acids, peptides & proteins for the Period 2021 - 2031
- Historical Data and Forecast of Hungary Bioactive Ingredients & Product Market Revenues & Volume By Omega 3 & structured lipids for the Period 2021 - 2031
- Historical Data and Forecast of Hungary Bioactive Ingredients & Product Market Revenues & Volume By Phytochemicals & plant extracts for the Period 2021 - 2031
- Historical Data and Forecast of Hungary Bioactive Ingredients & Product Market Revenues & Volume By Minerals for the Period 2021 - 2031
- Historical Data and Forecast of Hungary Bioactive Ingredients & Product Market Revenues & Volume By Vitamins for the Period 2021 - 2031
- Historical Data and Forecast of Hungary Bioactive Ingredients & Product Market Revenues & Volume By Fibers & specialty carbohydrates for the Period 2021 - 2031
- Historical Data and Forecast of Hungary Bioactive Ingredients & Product Market Revenues & Volume By Application for the Period 2021 - 2031
- Historical Data and Forecast of Hungary Bioactive Ingredients & Product Market Revenues & Volume By Functional food for the Period 2021 - 2031
- Historical Data and Forecast of Hungary Bioactive Ingredients & Product Market Revenues & Volume By Functional beverages for the Period 2021 - 2031
- Historical Data and Forecast of Hungary Bioactive Ingredients & Product Market Revenues & Volume By Dietary supplements for the Period 2021 - 2031
- Historical Data and Forecast of Hungary Bioactive Ingredients & Product Market Revenues & Volume By Animal nutrition for the Period 2021 - 2031
- Historical Data and Forecast of Hungary Bioactive Ingredients & Product Market Revenues & Volume By Personal care for the Period 2021 - 2031
- Hungary Bioactive Ingredients & Product Import Export Trade Statistics
- Market Opportunity Assessment By Ingredient
- Market Opportunity Assessment By Type
- Market Opportunity Assessment By Application
- Hungary Bioactive Ingredients & Product Top Companies Market Share
- Hungary Bioactive Ingredients & Product Competitive Benchmarking By Technical and Operational Parameters
- Hungary Bioactive Ingredients & Product Company Profiles
- Hungary Bioactive Ingredients & Product Key Strategic Recommendations
Hungary Bioactive Ingredients & Product Market (2025-2031): FAQs
The Hungary bioactive ingredients & product market is expected to witness significant growth in the coming years driven by increasing consumer awareness about health and wellness, the rising demand for natural and functional ingredients in food and beverages, and the growing number of companies like Biogran, Nutrilo, and Pharmavit focusing on developing innovative bioactive products for various applications.
The growing consumer demand for natural and organic products, coupled with the rising awareness of health benefits associated with bioactive ingredients, is driving the market growth. Companies like BioTech USA, a prominent player in the Hungarian market, have been introducing innovative products enriched with bioactive ingredients to cater to this increasing demand. Additionally, collaborations between research institutions and industry players to develop novel bioactive ingredients are further fueling the market expansion.
In Hungary's bioactive market, there is a noticeable shift towards natural and organic products driven by increasing consumer awareness about health benefits. Companies like Hungarian brand "NaturAqua" have seen success with their range of bioactive mineral water products, capitalizing on the trend of customers seeking functional and health-focused beverages. Consumers are also showing a preference for transparent labeling and ethical sourcing practices, as seen with the popularity of "BioTechUSA," which emphasizes sustainability and quality in its bioactive supplements.
The Hungary bioactive ingredients & product market is primarily driven by the growing consumer demand for natural and functional products. Companies like Bionov, a leading player in the bioactive ingredients industry, are innovating to meet this demand by developing bioactive compounds for various applications. However, challenges such as regulatory hurdles and the high cost of research and development can hinder market growth. Additionally, the market dynamics are influenced by shifting consumer preferences towards healthier lifestyles, which creates opportunities for companies like Naturex to introduce new bioactive products that cater to this trend.
The long-term outlook for the Hungary bioactive ingredients & product market appears promising, driven by the growing consumer preference for natural and functional products. Companies like Biogena and Béres are investing heavily in research and innovation to develop new bioactive ingredients that cater to health-conscious consumers. Additionally, advancements in technologies such as extraction processes and microencapsulation are enhancing the efficacy and stability of bioactive ingredients, further fueling market growth. The demand for bioactive ingredients in products like functional foods, dietary supplements, and skincare is expected to rise, indicating a positive future direction for the market.
6Wresearch actively monitors the Hungary Bioactive Ingredients & Product Market and publishes its comprehensive annual report, highlighting emerging trends, growth drivers, revenue analysis, and forecast outlook. Our insights help businesses to make data-backed strategic decisions with ongoing market dynamics. Our analysts track relevent industries related to the Hungary Bioactive Ingredients & Product Market, allowing our clients with actionable intelligence and reliable forecasts tailored to emerging regional needs.
Yes, we provide customisation as per your requirements. To learn more, feel free to contact us on sales@6wresearch.com
1 Executive Summary |
2 Introduction |
2.1 Key Highlights of the Report |
2.2 Report Description |
2.3 Market Scope & Segmentation |
2.4 Research Methodology |
2.5 Assumptions |
3 Hungary Bioactive Ingredients & Product Market Overview |
3.1 Hungary Country Macro Economic Indicators |
3.2 Hungary Bioactive Ingredients & Product Market Revenues & Volume, 2021 & 2031F |
3.3 Hungary Bioactive Ingredients & Product Market - Industry Life Cycle |
3.4 Hungary Bioactive Ingredients & Product Market - Porter's Five Forces |
3.5 Hungary Bioactive Ingredients & Product Market Revenues & Volume Share, By Ingredient, 2021 & 2031F |
3.6 Hungary Bioactive Ingredients & Product Market Revenues & Volume Share, By Type, 2021 & 2031F |
3.7 Hungary Bioactive Ingredients & Product Market Revenues & Volume Share, By Application, 2021 & 2031F |
4 Hungary Bioactive Ingredients & Product Market Dynamics |
4.1 Impact Analysis |
4.2 Market Drivers |
4.2.1 Growing consumer awareness and interest in health and wellness trends |
4.2.2 Increasing demand for natural and organic products |
4.2.3 Government support and initiatives promoting the use of bioactive ingredients in products |
4.3 Market Restraints |
4.3.1 High production costs associated with sourcing and processing bioactive ingredients |
4.3.2 Stringent regulations and compliance requirements for bioactive ingredients |
4.3.3 Limited availability of raw materials and skilled labor in Hungary |
5 Hungary Bioactive Ingredients & Product Market Trends |
6 Hungary Bioactive Ingredients & Product Market, By Types |
6.1 Hungary Bioactive Ingredients & Product Market, By Ingredient |
6.1.1 Overview and Analysis |
6.1.2 Hungary Bioactive Ingredients & Product Market Revenues & Volume, By Ingredient, 2021 - 2031F |
6.1.3 Hungary Bioactive Ingredients & Product Market Revenues & Volume, By Probiotics, 2021 - 2031F |
6.1.4 Hungary Bioactive Ingredients & Product Market Revenues & Volume, By Proteins, 2021 - 2031F |
6.1.5 Hungary Bioactive Ingredients & Product Market Revenues & Volume, By Plant Extracts, 2021 - 2031F |
6.1.6 Hungary Bioactive Ingredients & Product Market Revenues & Volume, By Minerals, 2021 - 2031F |
6.1.7 Hungary Bioactive Ingredients & Product Market Revenues & Volume, By Vitamins, 2021 - 2031F |
6.1.8 Hungary Bioactive Ingredients & Product Market Revenues & Volume, By Fibers, 2021 - 2031F |
6.2 Hungary Bioactive Ingredients & Product Market, By Type |
6.2.1 Overview and Analysis |
6.2.2 Hungary Bioactive Ingredients & Product Market Revenues & Volume, By Prebiotics, 2021 - 2031F |
6.2.3 Hungary Bioactive Ingredients & Product Market Revenues & Volume, By Probiotics, 2021 - 2031F |
6.2.4 Hungary Bioactive Ingredients & Product Market Revenues & Volume, By Amino acids, peptides & proteins, 2021 - 2031F |
6.2.5 Hungary Bioactive Ingredients & Product Market Revenues & Volume, By Omega 3 & structured lipids, 2021 - 2031F |
6.2.6 Hungary Bioactive Ingredients & Product Market Revenues & Volume, By Phytochemicals & plant extracts, 2021 - 2031F |
6.2.7 Hungary Bioactive Ingredients & Product Market Revenues & Volume, By Minerals, 2021 - 2031F |
6.2.8 Hungary Bioactive Ingredients & Product Market Revenues & Volume, By Fibers & specialty carbohydrates, 2021 - 2031F |
6.2.9 Hungary Bioactive Ingredients & Product Market Revenues & Volume, By Fibers & specialty carbohydrates, 2021 - 2031F |
6.3 Hungary Bioactive Ingredients & Product Market, By Application |
6.3.1 Overview and Analysis |
6.3.2 Hungary Bioactive Ingredients & Product Market Revenues & Volume, By Functional food, 2021 - 2031F |
6.3.3 Hungary Bioactive Ingredients & Product Market Revenues & Volume, By Functional beverages, 2021 - 2031F |
6.3.4 Hungary Bioactive Ingredients & Product Market Revenues & Volume, By Dietary supplements, 2021 - 2031F |
6.3.5 Hungary Bioactive Ingredients & Product Market Revenues & Volume, By Animal nutrition, 2021 - 2031F |
6.3.6 Hungary Bioactive Ingredients & Product Market Revenues & Volume, By Personal care, 2021 - 2031F |
7 Hungary Bioactive Ingredients & Product Market Import-Export Trade Statistics |
7.1 Hungary Bioactive Ingredients & Product Market Export to Major Countries |
7.2 Hungary Bioactive Ingredients & Product Market Imports from Major Countries |
8 Hungary Bioactive Ingredients & Product Market Key Performance Indicators |
8.1 Research and development investment in new bioactive ingredients and products |
8.2 Number of partnerships and collaborations with local suppliers and manufacturers |
8.3 Adoption rate of bioactive ingredients in mainstream consumer products |
8.4 Consumer perception and acceptance of bioactive ingredients in the market |
8.5 Sustainability practices and certifications within the bioactive ingredients supply chain |
9 Hungary Bioactive Ingredients & Product Market - Opportunity Assessment |
9.1 Hungary Bioactive Ingredients & Product Market Opportunity Assessment, By Ingredient, 2021 & 2031F |
9.2 Hungary Bioactive Ingredients & Product Market Opportunity Assessment, By Type, 2021 & 2031F |
9.3 Hungary Bioactive Ingredients & Product Market Opportunity Assessment, By Application, 2021 & 2031F |
10 Hungary Bioactive Ingredients & Product Market - Competitive Landscape |
10.1 Hungary Bioactive Ingredients & Product Market Revenue Share, By Companies, 2024 |
10.2 Hungary Bioactive Ingredients & Product Market Competitive Benchmarking, By Operating and Technical Parameters |
11 Company Profiles |
12 Recommendations |
13 Disclaimer |
Global Go To Market Strategy - 2030
Export potential enables firms to identify high-growth global markets with greater confidence by combining advanced trade intelligence with a structured quantitative methodology. The framework analyzes emerging demand trends and country-level import patterns while integrating macroeconomic and trade datasets such as GDP and population forecasts, bilateral import–export flows, tariff structures, elasticity differentials between developed and developing economies, geographic distance, and import demand projections. Using weighted trade values from 2020–2024 as the base period to project country-to-country export potential for 2030, these inputs are operationalized through calculated drivers such as gravity model parameters, tariff impact factors, and projected GDP per-capita growth. Through an analysis of hidden potentials, demand hotspots, and market conditions that are most favorable to success, this method enables firms to focus on target countries, maximize returns, and global expansion with data, backed by accuracy.
By factoring in the projected importer demand gap that is currently unmet and could be potential opportunity, it identifies the potential for the Exporter (Country) among 190 countries, against the general trade analysis, which identifies the biggest importer or exporter.
To discover high-growth global markets and optimize your business strategy:
Click Here
Pricing
- Single User License$ 1,995
- Department License$ 2,400
- Site License$ 3,120
- Global License$ 3,795

Leadership Perspectives from Industry Events
Search
Thought Leadership and Analyst Meet


Our Clients
6WResearch In News
- India Export Attractiveness Tracker 2026
- India Air Conditioner Market Set for Strong Rebound in 2026 After Weather-Led Correction and GST-Driven Recovery: 6Wresearch
- ADAS in India: How Automatic Emergency Braking, Blind Spot Detection & Driver Monitoring are Transforming Road Safety
- Doha a strategic location for EV manufacturing hub: IPA Qatar
- Demand for luxury TVs surging in the GCC, says Samsung
- Empowering Growth: The Thriving Journey of Bangladesh’s Cable Industry
Latest Reports
- Nicaragua RPG Gaming Market (2026-2032)
- New Zealand RPG Gaming Market (2026-2032)
- Netherlands RPG Gaming Market (2026-2032)
- Nauru RPG Gaming Market (2026-2032)
- Namibia RPG Gaming Market (2026-2032)
- Mozambique RPG Gaming Market (2026-2032)
- Montenegro RPG Gaming Market (2026-2032)
- Mongolia RPG Gaming Market (2026-2032)
- Monaco RPG Gaming Market (2026-2032)
- Micronesia RPG Gaming Market (2026-2032)
Industry Events and Analyst Meet

EV India Expo 2026

HIMTEX 2026

India Refining Summit 2026

India EV Show 2026

EV tech India Expo 2026
Whitepaper
- Middle East & Africa Commercial Security Market Click here to view more.
- Middle East & Africa Fire Safety Systems & Equipment Market Click here to view more.
- GCC Drone Market Click here to view more.
- Middle East Lighting Fixture Market Click here to view more.
- GCC Physical & Perimeter Security Market Click here to view more.