Hungary Copper Sulfate Market (2026-2032) | Demand, Consumer Insights, Challenges, Restraints, Companies, Value, Opportunities, Growth, Outlook, Competition, Size, Investment Trends, Segments, Strategy, Revenue, Pricing Analysis, Analysis, Trends, Segmentation, Drivers, Share, Strategic Insights, Supply, Industry, Forecast, Competitive
Market Forecast By Form (Powder, Liquid, Crystals, Others), By Grade (Technical Grade, Industrial Grade, Feed Grade, Others), By Application (Fungicide, Electroplating, Feed Additive, Others), By End-Use (Agriculture, Electronics, Animal Nutrition, Others), By Distribution Channel (Direct Sales, Distributors, Online Sales, Others) And Competitive Landscape
| Product Code: ETC11761613 | Publication Date: Apr 2025 | Updated Date: Apr 2026 | Product Type: Market Research Report | |
| Publisher: 6Wresearch | No. of Pages: 65 | No. of Figures: 34 | No. of Tables: 19 | |
Hungary Copper Sulfate Market Size (2020-2030)
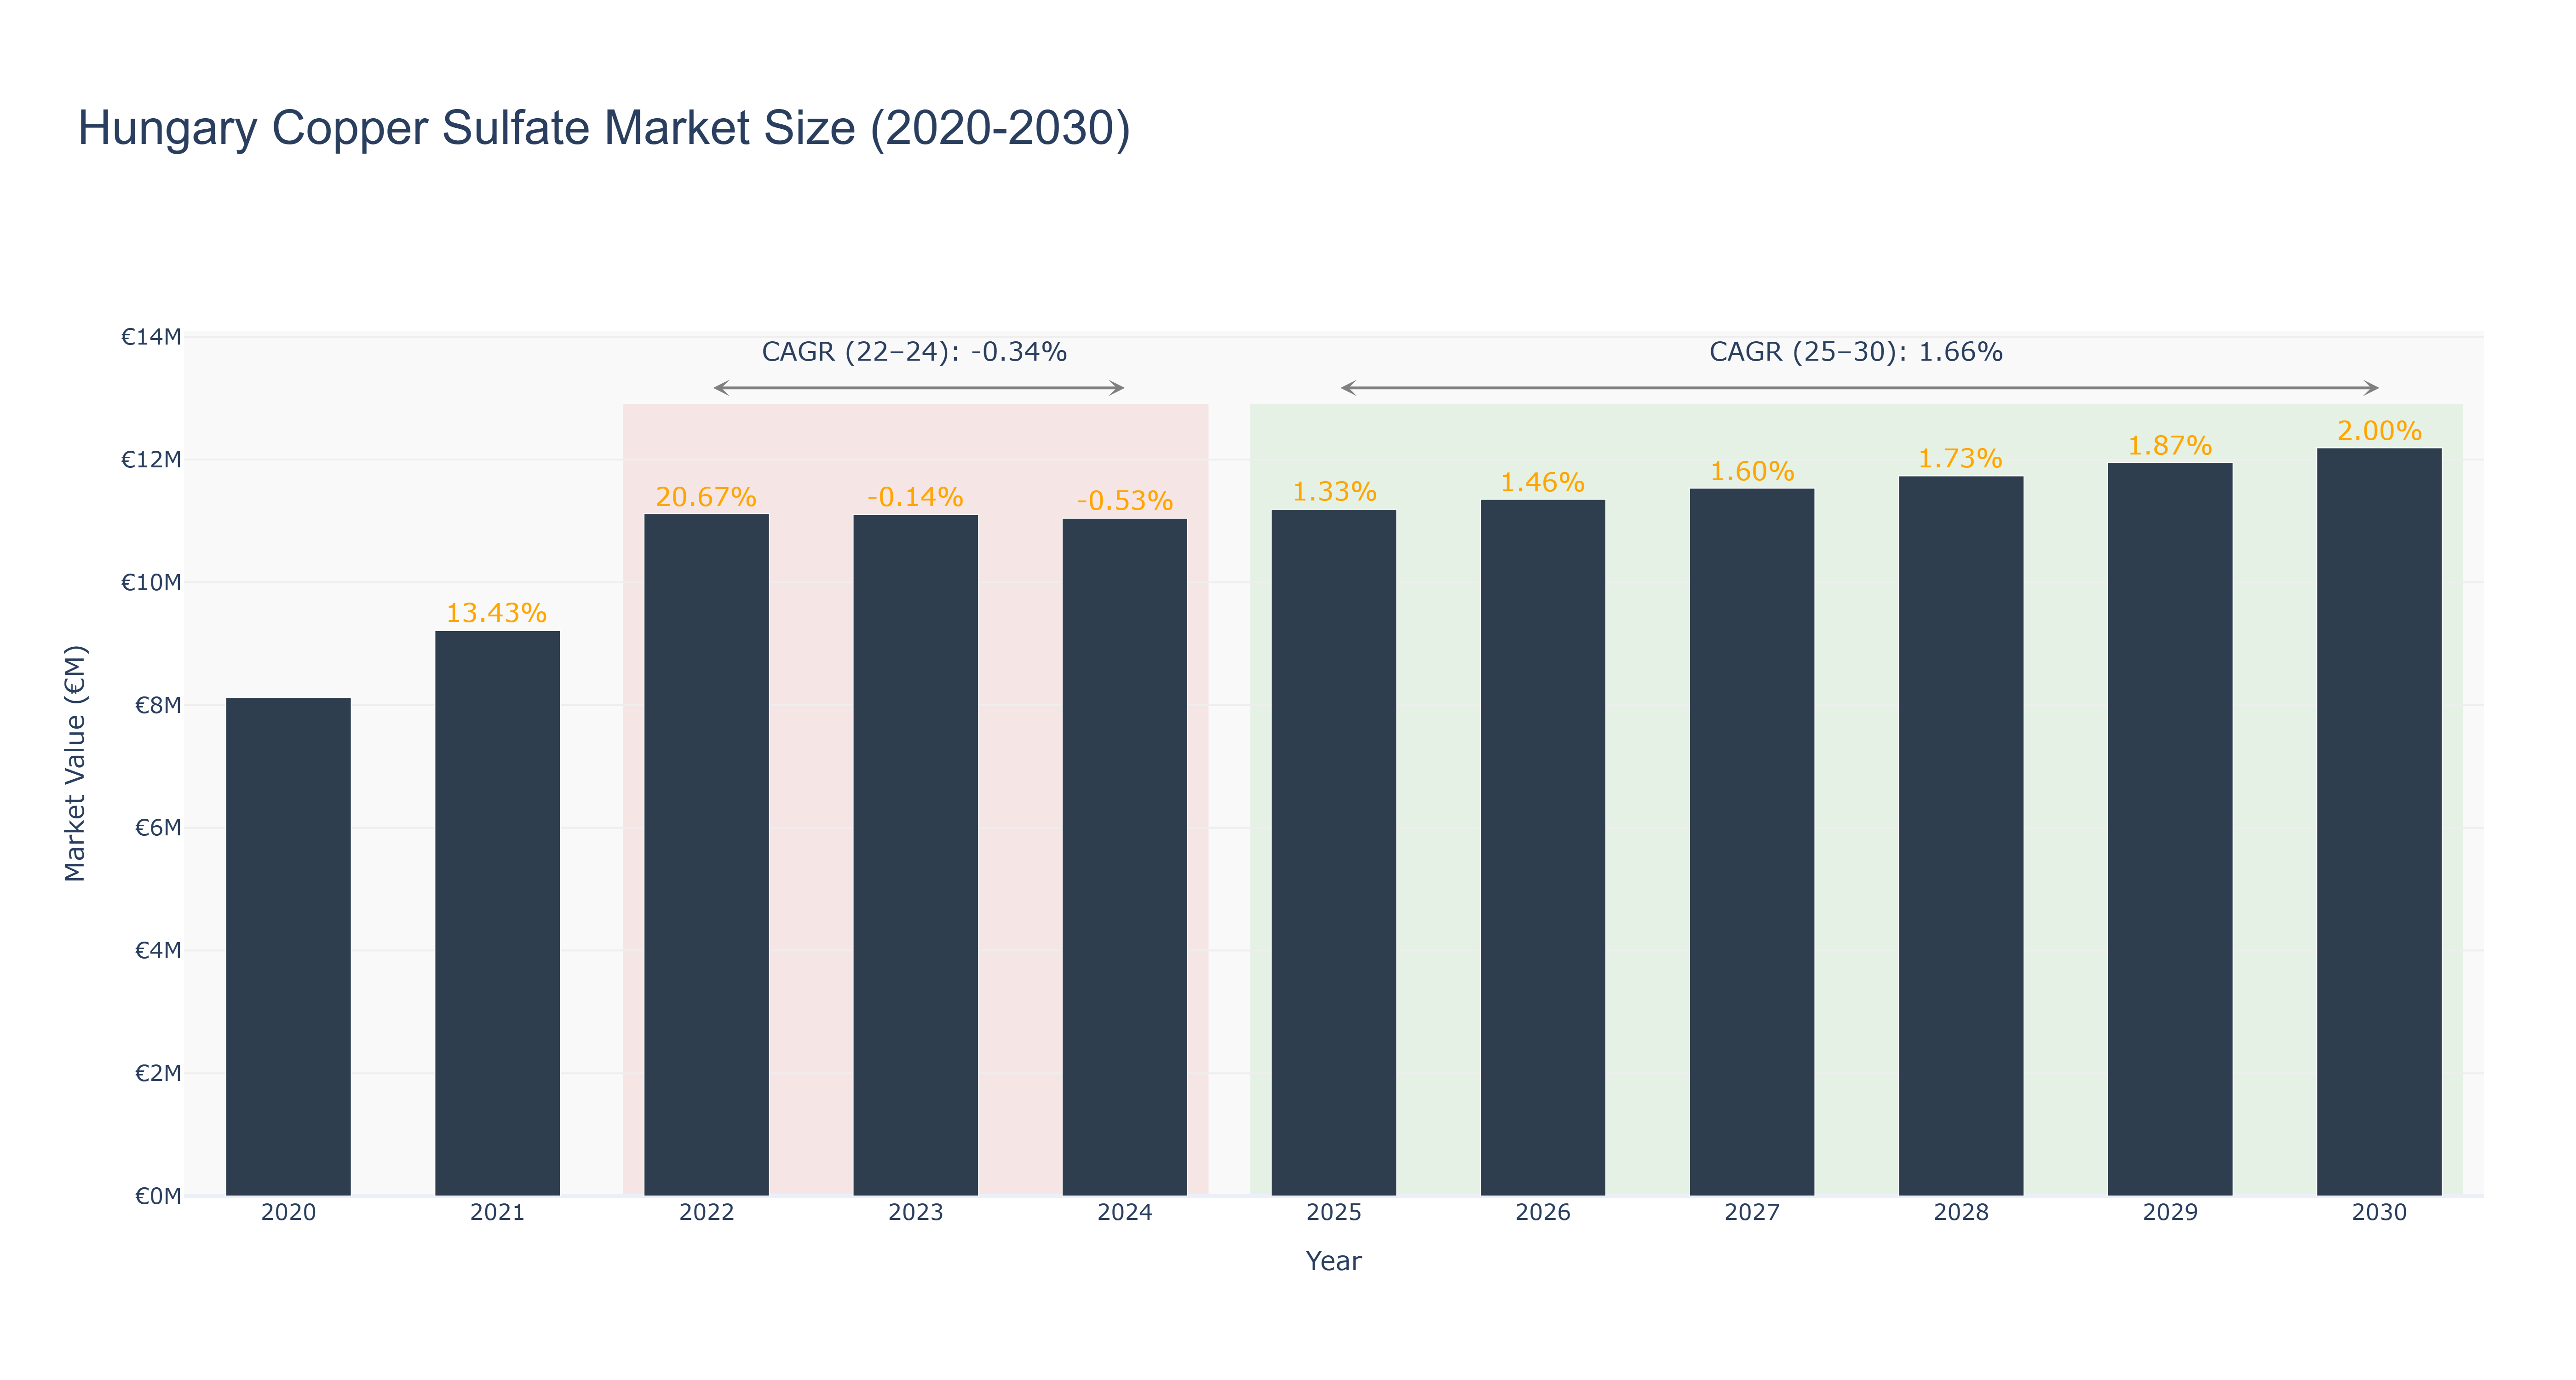
Hungary Copper Sulfate Market has shown a fluctuating trend in recent years. The market peaked at €11.19 million in 2025, with a forecasted growth to reach €12.19 million by 2030. The CAGR for the period 2022-2024 was -0.34%, indicating a slight decline, while the CAGR for 2025-2030 is projected at 1.66%, suggesting a steady upward trajectory. The market experienced a slight dip in 2023 and 2024, attributed to global economic uncertainties affecting demand. However, the subsequent growth from 2025 onwards can be linked to increased agricultural activities and the rising adoption of copper sulfate in various industrial applications. Looking ahead, Hungary is set to implement new environmental regulations promoting sustainable farming practices, which is expected to further drive the demand for copper sulfate in the country.
Hungary Copper Sulfate Market: Production & Trade Performance (2019-2025)
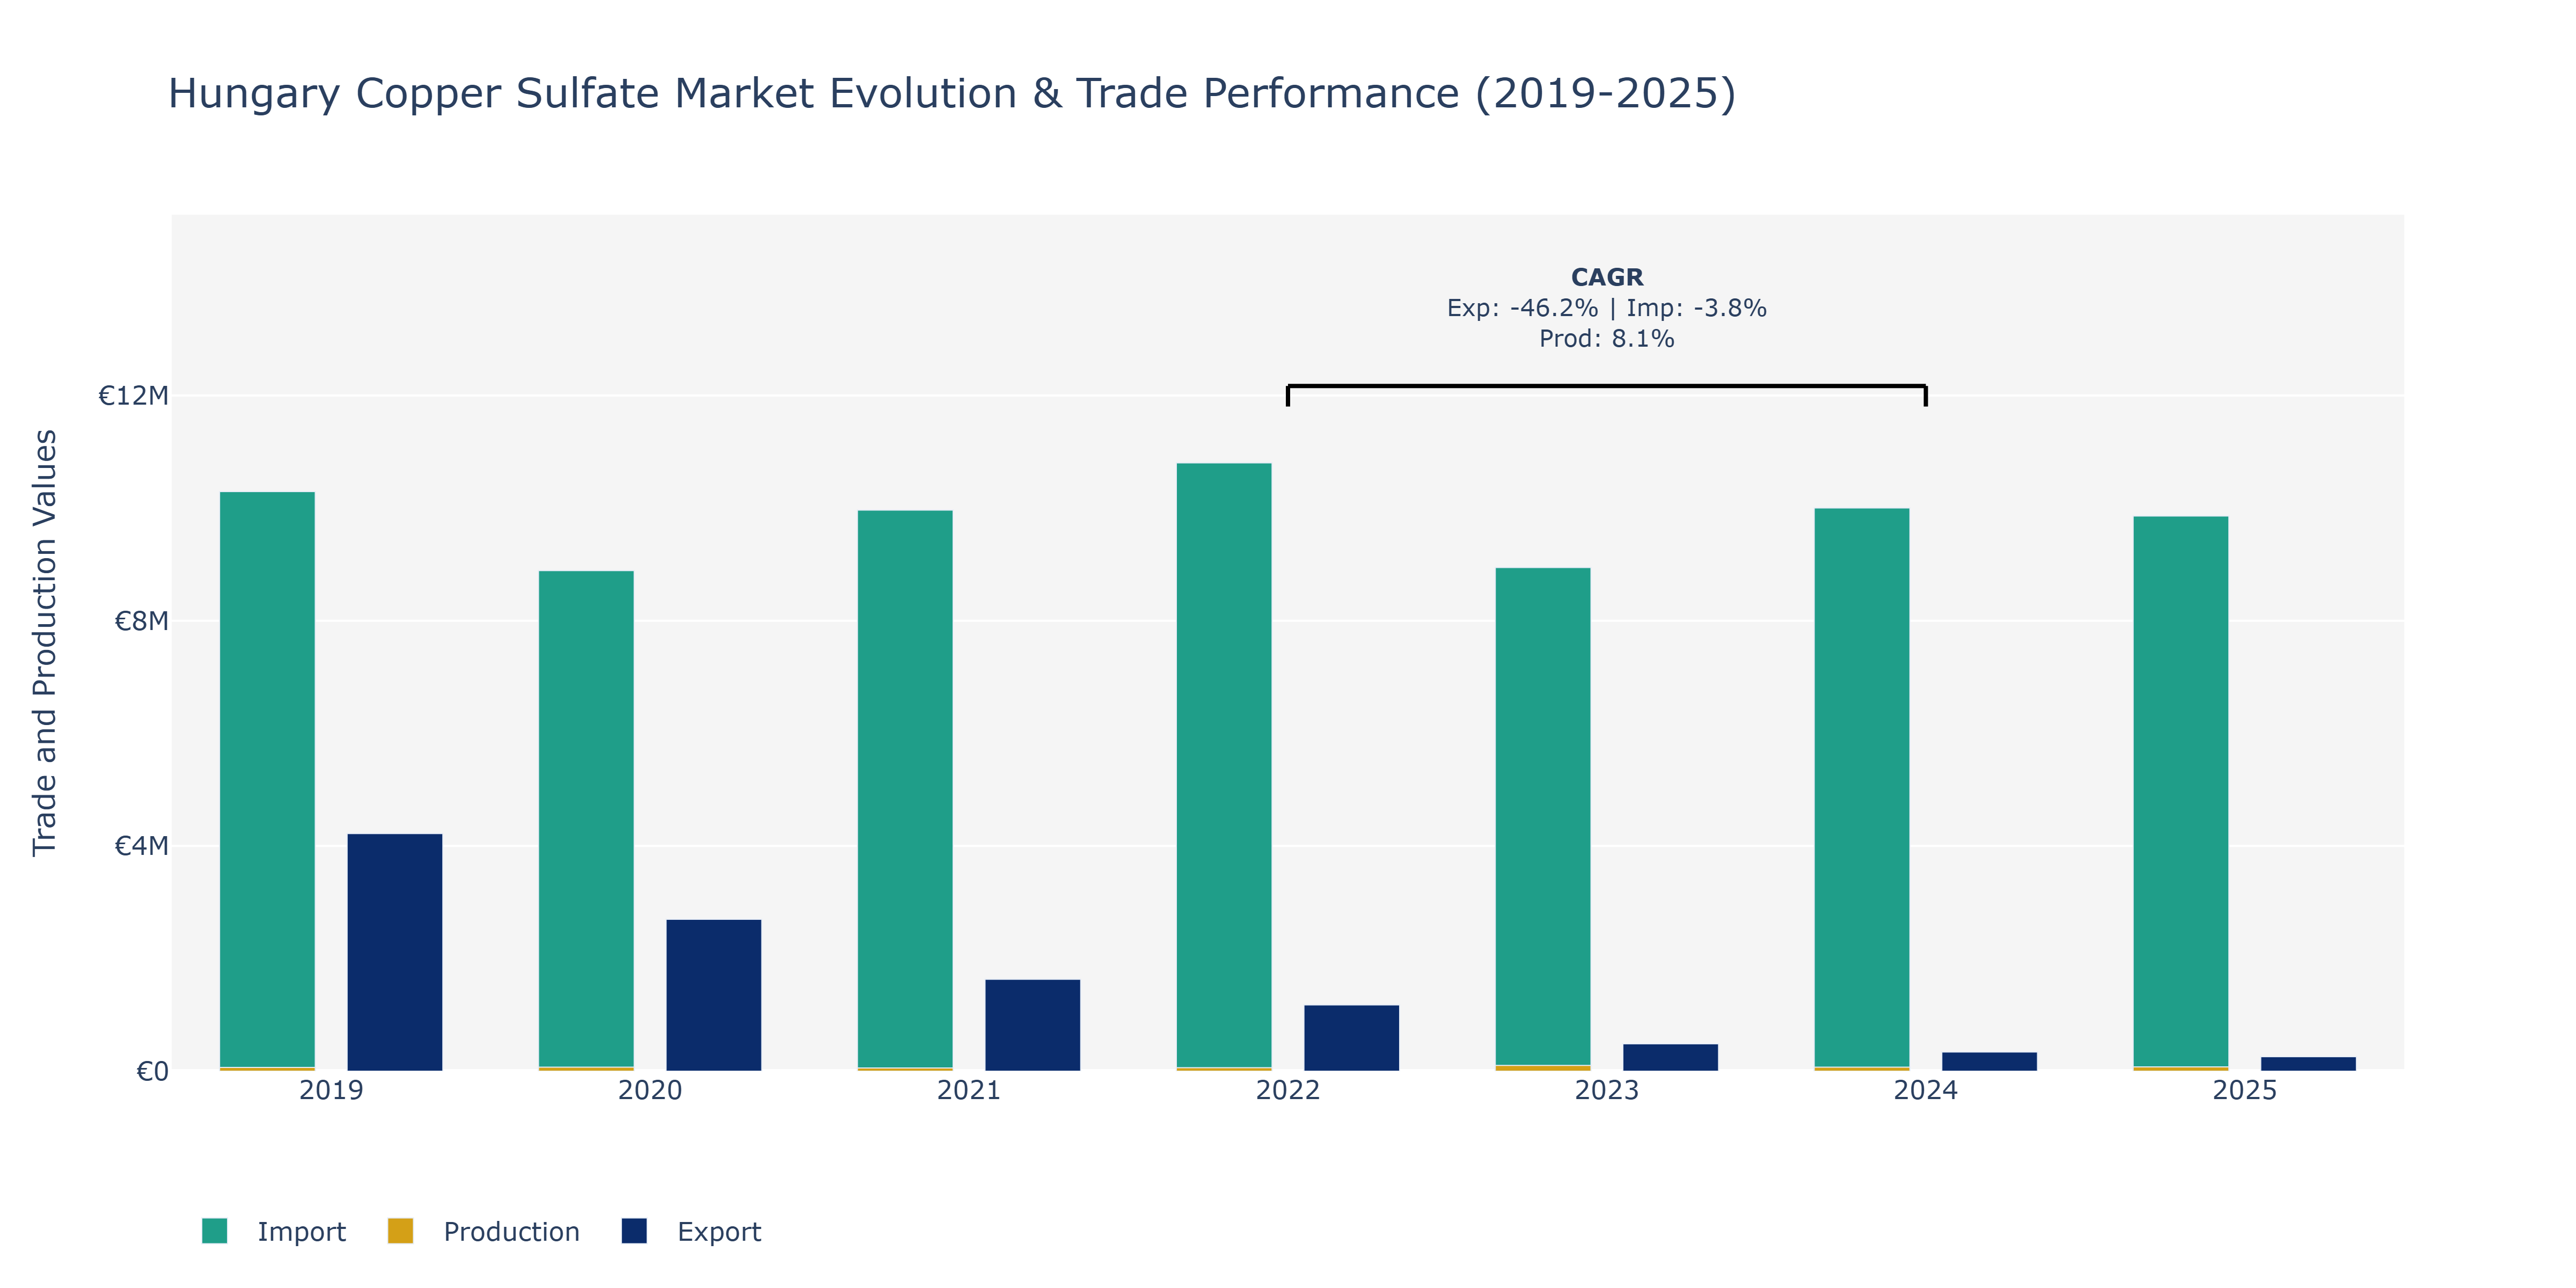
Between 2019 and 2025, Hungary's Copper Sulfate Market witnessed dynamic shifts in key metrics. Exports experienced a consistent decline from €4.22 million in 2019 to around €0.26 million in 2025. This substantial drop could be attributed to global economic fluctuations, impacting demand for copper sulfate products. In contrast, imports displayed more volatility, peaking at €10.81 million in 2022 before slightly decreasing to €9.86 million in 2025. This erratic pattern might be linked to changes in international trade agreements and sourcing strategies. Notably, production levels grew steadily over the period, reaching approximately €77.05 million in 2025, showcasing the market's capacity expansion and potentially increased domestic consumption. The positive production trend aligns with the reported 8.14% Compound Annual Growth Rate (CAGR) from 2022 to 2024, indicating a strengthening domestic manufacturing sector. The market's production growth could be underpinned by technological advancements, driving efficiency and output improvements within the sector.
Key Highlights of the Report:
- Hungary Copper Sulfate Market Outlook
- Market Size of Hungary Copper Sulfate Market, 2025
- Forecast of Hungary Copper Sulfate Market, 2032
- Historical Data and Forecast of Hungary Copper Sulfate Revenues & Volume for the Period 2022-2032F
- Hungary Copper Sulfate Market Trend Evolution
- Hungary Copper Sulfate Market Drivers and Challenges
- Hungary Copper Sulfate Price Trends
- Hungary Copper Sulfate Porter's Five Forces
- Hungary Copper Sulfate Industry Life Cycle
- Historical Data and Forecast of Hungary Copper Sulfate Market Revenues & Volume By Form for the Period 2022-2032F
- Historical Data and Forecast of Hungary Copper Sulfate Market Revenues & Volume By Powder for the Period 2022-2032F
- Historical Data and Forecast of Hungary Copper Sulfate Market Revenues & Volume By Liquid for the Period 2022-2032F
- Historical Data and Forecast of Hungary Copper Sulfate Market Revenues & Volume By Crystals for the Period 2022-2032F
- Historical Data and Forecast of Hungary Copper Sulfate Market Revenues & Volume By Others for the Period 2022-2032F
- Historical Data and Forecast of Hungary Copper Sulfate Market Revenues & Volume By Grade for the Period 2022-2032F
- Historical Data and Forecast of Hungary Copper Sulfate Market Revenues & Volume By Technical Grade for the Period 2022-2032F
- Historical Data and Forecast of Hungary Copper Sulfate Market Revenues & Volume By Industrial Grade for the Period 2022-2032F
- Historical Data and Forecast of Hungary Copper Sulfate Market Revenues & Volume By Feed Grade for the Period 2022-2032F
- Historical Data and Forecast of Hungary Copper Sulfate Market Revenues & Volume By Others for the Period 2022-2032F
- Historical Data and Forecast of Hungary Copper Sulfate Market Revenues & Volume By Application for the Period 2022-2032F
- Historical Data and Forecast of Hungary Copper Sulfate Market Revenues & Volume By Fungicide for the Period 2022-2032F
- Historical Data and Forecast of Hungary Copper Sulfate Market Revenues & Volume By Electroplating for the Period 2022-2032F
- Historical Data and Forecast of Hungary Copper Sulfate Market Revenues & Volume By Feed Additive for the Period 2022-2032F
- Historical Data and Forecast of Hungary Copper Sulfate Market Revenues & Volume By Others for the Period 2022-2032F
- Historical Data and Forecast of Hungary Copper Sulfate Market Revenues & Volume By End-Use for the Period 2022-2032F
- Historical Data and Forecast of Hungary Copper Sulfate Market Revenues & Volume By Agriculture for the Period 2022-2032F
- Historical Data and Forecast of Hungary Copper Sulfate Market Revenues & Volume By Electronics for the Period 2022-2032F
- Historical Data and Forecast of Hungary Copper Sulfate Market Revenues & Volume By Animal Nutrition for the Period 2022-2032F
- Historical Data and Forecast of Hungary Copper Sulfate Market Revenues & Volume By Others for the Period 2022-2032F
- Historical Data and Forecast of Hungary Copper Sulfate Market Revenues & Volume By Distribution Channel for the Period 2022-2032F
- Historical Data and Forecast of Hungary Copper Sulfate Market Revenues & Volume By Direct Sales for the Period 2022-2032F
- Historical Data and Forecast of Hungary Copper Sulfate Market Revenues & Volume By Distributors for the Period 2022-2032F
- Historical Data and Forecast of Hungary Copper Sulfate Market Revenues & Volume By Online Sales for the Period 2022-2032F
- Historical Data and Forecast of Hungary Copper Sulfate Market Revenues & Volume By Others for the Period 2022 - 2032F
- Hungary Copper Sulfate Import Export Trade Statistics
- Market Opportunity Assessment By Form
- Market Opportunity Assessment By Grade
- Market Opportunity Assessment By Application
- Market Opportunity Assessment By End-Use
- Market Opportunity Assessment By Distribution Channel
- Hungary Copper Sulfate Top Companies Market Share
- Hungary Copper Sulfate Competitive Benchmarking By Technical and Operational Parameters
- Hungary Copper Sulfate Company Profiles
- Hungary Copper Sulfate Key Strategic Recommendations
Frequently Asked Questions About the Market Study (FAQs):
6Wresearch actively monitors the Hungary Copper Sulfate Market and publishes its comprehensive annual report, highlighting emerging trends, growth drivers, revenue analysis, and forecast outlook. Our insights help businesses to make data-backed strategic decisions with ongoing market dynamics. Our analysts track relevent industries related to the Hungary Copper Sulfate Market, allowing our clients with actionable intelligence and reliable forecasts tailored to emerging regional needs.
Yes, we provide customisation as per your requirements. To learn more, feel free to contact us on sales@6wresearch.com
1 Executive Summary |
2 Introduction |
2.1 Key Highlights of the Report |
2.2 Report Description |
2.3 Market Scope & Segmentation |
2.4 Research Methodology |
2.5 Assumptions |
3 Hungary Copper Sulfate Market Overview |
3.1 Hungary Country Macro Economic Indicators |
3.2 Hungary Copper Sulfate Market Revenues & Volume, 2022 & 2032F |
3.3 Hungary Copper Sulfate Market - Industry Life Cycle |
3.4 Hungary Copper Sulfate Market - Porter's Five Forces |
3.5 Hungary Copper Sulfate Market Revenues & Volume Share, By Form, 2022 & 2032F |
3.6 Hungary Copper Sulfate Market Revenues & Volume Share, By Grade, 2022 & 2032F |
3.7 Hungary Copper Sulfate Market Revenues & Volume Share, By Application, 2022 & 2032F |
3.8 Hungary Copper Sulfate Market Revenues & Volume Share, By End-Use, 2022 & 2032F |
3.9 Hungary Copper Sulfate Market Revenues & Volume Share, By Distribution Channel, 2022 & 2032F |
4 Hungary Copper Sulfate Market Dynamics |
4.1 Impact Analysis |
4.2 Market Drivers |
4.2.1 Increasing demand for agricultural products, as copper sulfate is commonly used as a fungicide and pesticide in farming. |
4.2.2 Growth in the mining industry, as copper sulfate is a byproduct of copper mining. |
4.2.3 Rising awareness about the benefits of copper sulfate in various industries, such as healthcare and textiles. |
4.3 Market Restraints |
4.3.1 Fluctuating prices of copper, which directly impact the cost of producing copper sulfate. |
4.3.2 Environmental concerns related to the use of copper sulfate, leading to regulations and restrictions on its usage. |
5 Hungary Copper Sulfate Market Trends |
6 Hungary Copper Sulfate Market, By Types |
6.1 Hungary Copper Sulfate Market, By Form |
6.1.1 Overview and Analysis |
6.1.2 Hungary Copper Sulfate Market Revenues & Volume, By Form, 2022 - 2032F |
6.1.3 Hungary Copper Sulfate Market Revenues & Volume, By Powder, 2022 - 2032F |
6.1.4 Hungary Copper Sulfate Market Revenues & Volume, By Liquid, 2022 - 2032F |
6.1.5 Hungary Copper Sulfate Market Revenues & Volume, By Crystals, 2022 - 2032F |
6.1.6 Hungary Copper Sulfate Market Revenues & Volume, By Others, 2022 - 2032F |
6.2 Hungary Copper Sulfate Market, By Grade |
6.2.1 Overview and Analysis |
6.2.2 Hungary Copper Sulfate Market Revenues & Volume, By Technical Grade, 2022 - 2032F |
6.2.3 Hungary Copper Sulfate Market Revenues & Volume, By Industrial Grade, 2022 - 2032F |
6.2.4 Hungary Copper Sulfate Market Revenues & Volume, By Feed Grade, 2022 - 2032F |
6.2.5 Hungary Copper Sulfate Market Revenues & Volume, By Others, 2022 - 2032F |
6.3 Hungary Copper Sulfate Market, By Application |
6.3.1 Overview and Analysis |
6.3.2 Hungary Copper Sulfate Market Revenues & Volume, By Fungicide, 2022 - 2032F |
6.3.3 Hungary Copper Sulfate Market Revenues & Volume, By Electroplating, 2022 - 2032F |
6.3.4 Hungary Copper Sulfate Market Revenues & Volume, By Feed Additive, 2022 - 2032F |
6.3.5 Hungary Copper Sulfate Market Revenues & Volume, By Others, 2022 - 2032F |
6.4 Hungary Copper Sulfate Market, By End-Use |
6.4.1 Overview and Analysis |
6.4.2 Hungary Copper Sulfate Market Revenues & Volume, By Agriculture, 2022 - 2032F |
6.4.3 Hungary Copper Sulfate Market Revenues & Volume, By Electronics, 2022 - 2032F |
6.4.4 Hungary Copper Sulfate Market Revenues & Volume, By Animal Nutrition, 2022 - 2032F |
6.4.5 Hungary Copper Sulfate Market Revenues & Volume, By Others, 2022 - 2032F |
6.5 Hungary Copper Sulfate Market, By Distribution Channel |
6.5.1 Overview and Analysis |
6.5.2 Hungary Copper Sulfate Market Revenues & Volume, By Direct Sales, 2022 - 2032F |
6.5.3 Hungary Copper Sulfate Market Revenues & Volume, By Distributors, 2022 - 2032F |
6.5.4 Hungary Copper Sulfate Market Revenues & Volume, By Online Sales, 2022 - 2032F |
6.5.5 Hungary Copper Sulfate Market Revenues & Volume, By Others, 2022 - 2032F |
7 Hungary Copper Sulfate Market Import-Export Trade Statistics |
7.1 Hungary Copper Sulfate Market Export to Major Countries |
7.2 Hungary Copper Sulfate Market Imports from Major Countries |
8 Hungary Copper Sulfate Market Key Performance Indicators |
8.1 Price of copper in the global market. |
8.2 Number of new product innovations or applications using copper sulfate. |
8.3 Environmental impact assessments related to copper sulfate production and usage. |
9 Hungary Copper Sulfate Market - Opportunity Assessment |
9.1 Hungary Copper Sulfate Market Opportunity Assessment, By Form, 2022 & 2032F |
9.2 Hungary Copper Sulfate Market Opportunity Assessment, By Grade, 2022 & 2032F |
9.3 Hungary Copper Sulfate Market Opportunity Assessment, By Application, 2022 & 2032F |
9.4 Hungary Copper Sulfate Market Opportunity Assessment, By End-Use, 2022 & 2032F |
9.5 Hungary Copper Sulfate Market Opportunity Assessment, By Distribution Channel, 2022 & 2032F |
10 Hungary Copper Sulfate Market - Competitive Landscape |
10.1 Hungary Copper Sulfate Market Revenue Share, By Companies, 2025 |
10.2 Hungary Copper Sulfate Market Competitive Benchmarking, By Operating and Technical Parameters |
11 Company Profiles |
12 Recommendations |
13 Disclaimer |
Global Go To Market Strategy - 2030
Export potential enables firms to identify high-growth global markets with greater confidence by combining advanced trade intelligence with a structured quantitative methodology. The framework analyzes emerging demand trends and country-level import patterns while integrating macroeconomic and trade datasets such as GDP and population forecasts, bilateral import–export flows, tariff structures, elasticity differentials between developed and developing economies, geographic distance, and import demand projections. Using weighted trade values from 2020–2024 as the base period to project country-to-country export potential for 2030, these inputs are operationalized through calculated drivers such as gravity model parameters, tariff impact factors, and projected GDP per-capita growth. Through an analysis of hidden potentials, demand hotspots, and market conditions that are most favorable to success, this method enables firms to focus on target countries, maximize returns, and global expansion with data, backed by accuracy.
By factoring in the projected importer demand gap that is currently unmet and could be potential opportunity, it identifies the potential for the Exporter (Country) among 190 countries, against the general trade analysis, which identifies the biggest importer or exporter.
To discover high-growth global markets and optimize your business strategy:
Click Here
Pricing
- Single User License$ 1,995
- Department License$ 2,400
- Site License$ 3,120
- Global License$ 3,795

Leadership Perspectives from Industry Events
Search
Thought Leadership and Analyst Meet


Our Clients
6WResearch In News
- Doha a strategic location for EV manufacturing hub: IPA Qatar
- Demand for luxury TVs surging in the GCC, says Samsung
- Empowering Growth: The Thriving Journey of Bangladesh’s Cable Industry
- Demand for luxury TVs surging in the GCC, says Samsung
- Video call with a traditional healer? Once unthinkable, it’s now common in South Africa
- Intelligent Buildings To Smooth GCC’s Path To Net Zero
Latest Reports
- Taiwan Airport Wireless Infrastructure Market (2026-2032)
- Vietnam Airport Wireless Infrastructure Market (2026-2032)
- Thailand Airport Wireless Infrastructure Market (2026-2032)
- South Korea Airport Wireless Infrastructure Market (2026-2032)
- Romania Airport Wireless Infrastructure Market (2026-2032)
- Qatar Airport Wireless Infrastructure Market (2026-2032)
- Philippines Airport Wireless Infrastructure Market (2026-2032)
- Japan Airport Wireless Infrastructure Market (2026-2032)
- Taiwan Airport Winter Services Market (2026-2032)
- Vietnam Airport Winter Services Market (2026-2032)
Industry Events and Analyst Meet

HIMTEX 2026

India Refining Summit 2026

India EV Show 2026

EV tech India Expo 2026

Auto Tech Asia 2026
Whitepaper
- Middle East & Africa Commercial Security Market Click here to view more.
- Middle East & Africa Fire Safety Systems & Equipment Market Click here to view more.
- GCC Drone Market Click here to view more.
- Middle East Lighting Fixture Market Click here to view more.
- GCC Physical & Perimeter Security Market Click here to view more.