Hungary Desktop Virtualization Market Size, Share & Growth Rate
The Hungary Desktop Virtualization Market was estimated at USD 1269 Million in 2025 and is projected to reach USD 1806 Million by 2032, growing at a CAGR of 5.2% from 2026 to 2032. This upward trajectory is significantly driven by the increasing demand for flexible IT solutions, particularly as remote work becomes a standard practice across sectors. Organizations are embracing desktop virtualization to streamline IT management, enhance data security, and reduce costs, all essential components in today's dynamic business environment.
Hungary Desktop Virtualization Market Year-wise Growth Rate and Key Drivers
This graph highlights how the Hungary Desktop Virtualization Market has steadily grown over the years, supported by major growth factors.
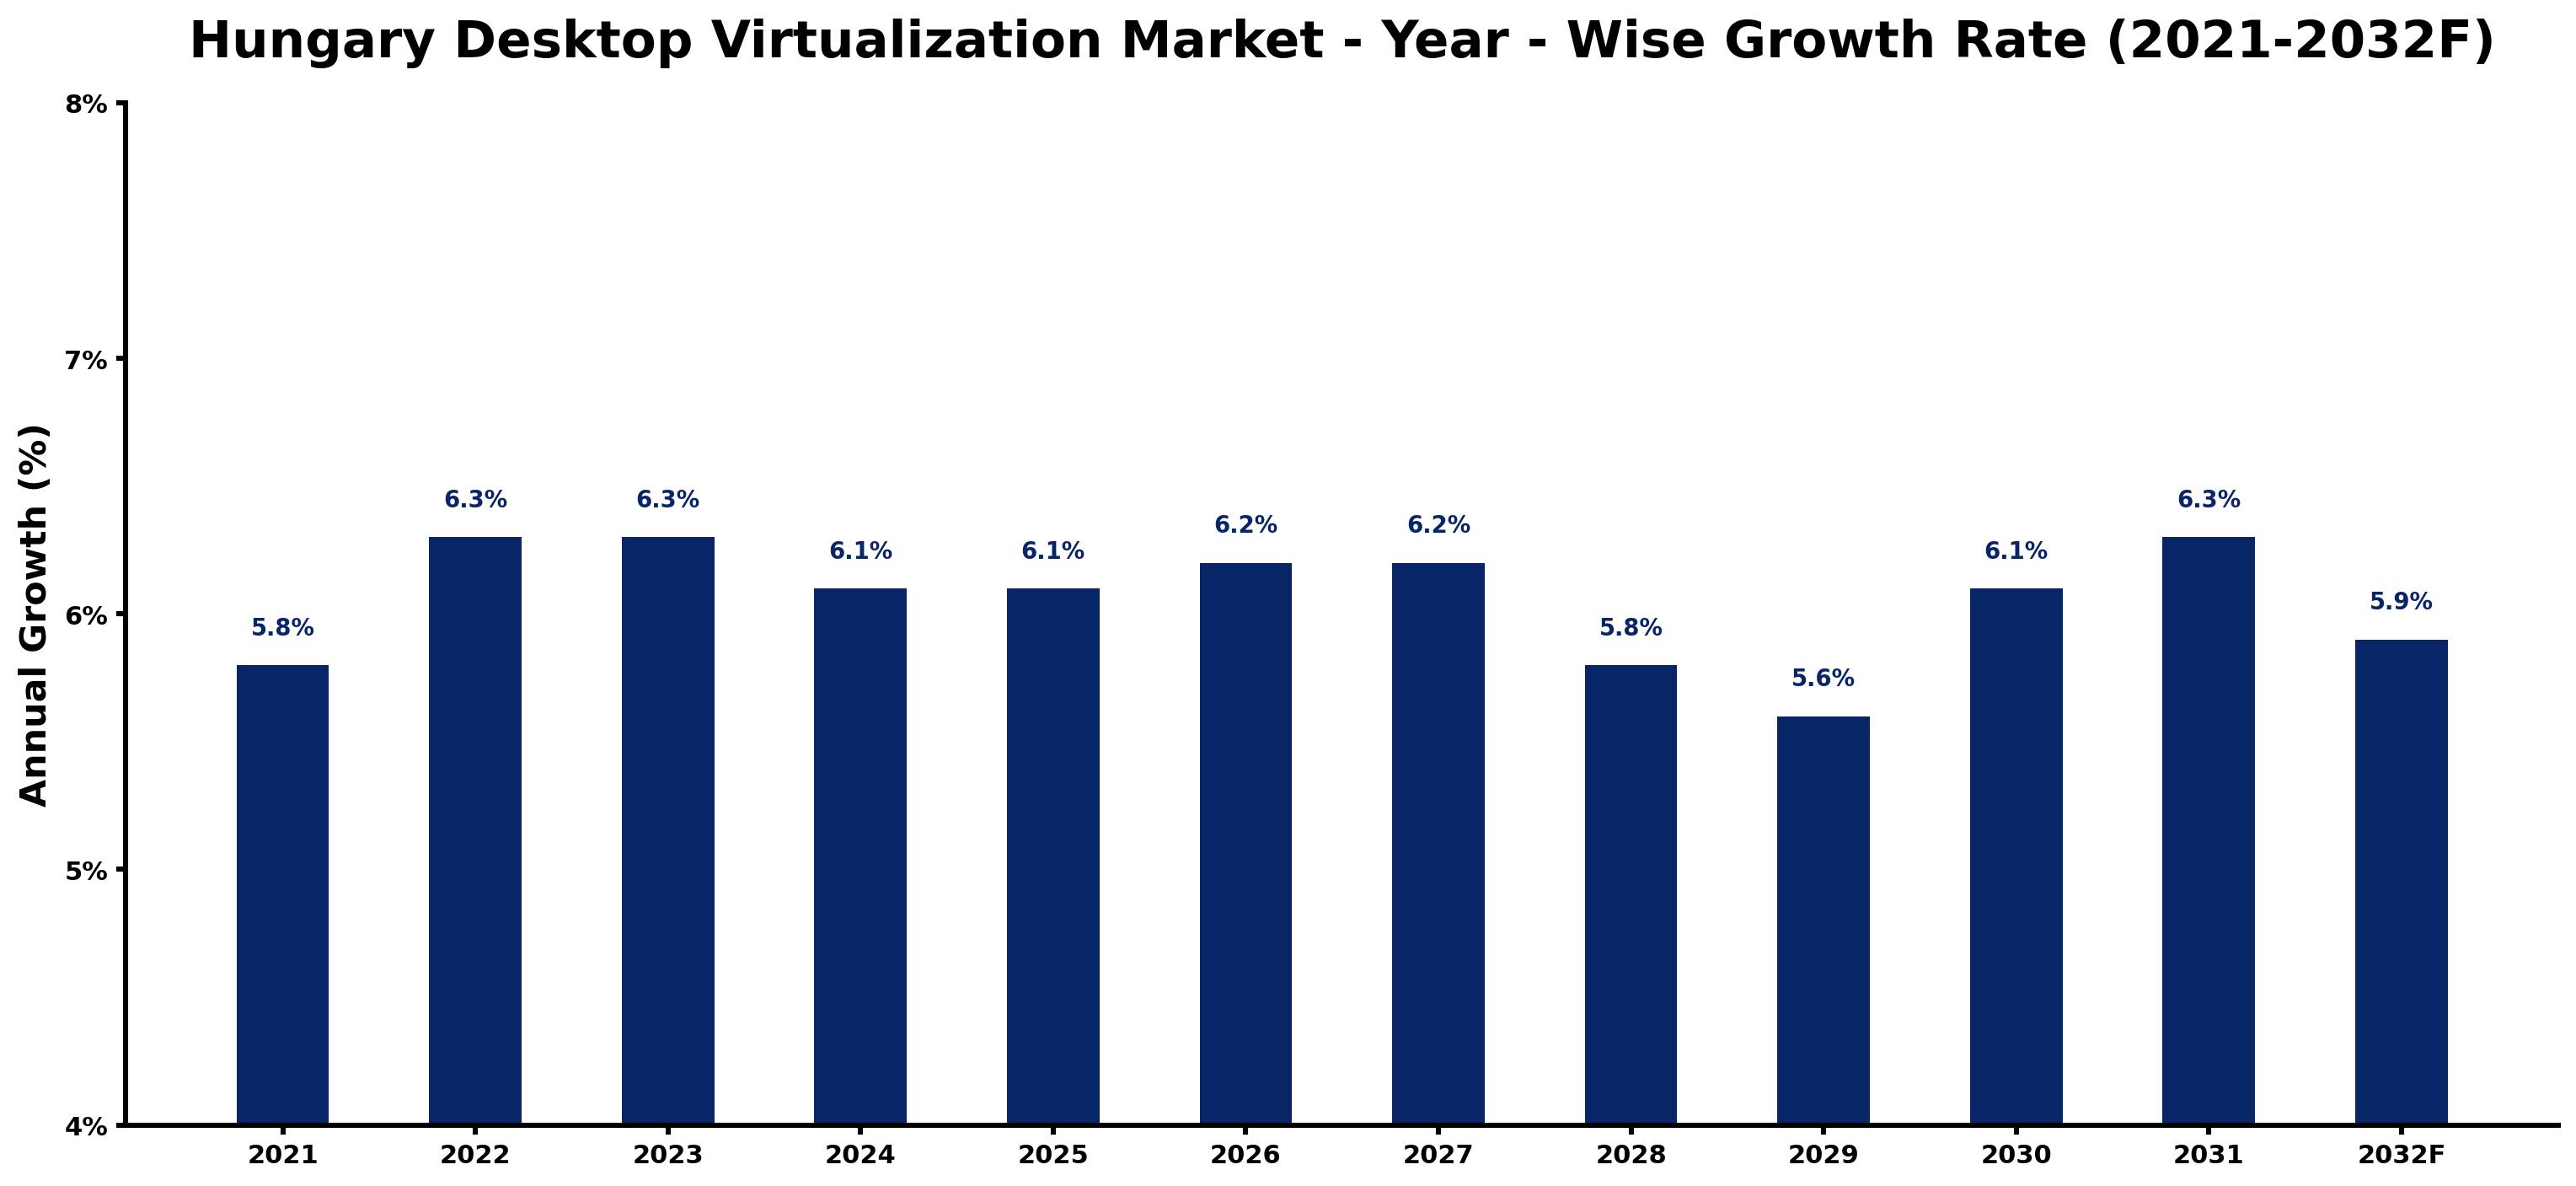
The table below presents the year‑wise growth rates along with the key drivers influencing the market
| Year | Growth Rate | Major Drivers |
| 2021 | 5.8% | Increasing adoption of advanced technologies |
| 2022 | 6.3% | Increasing smart city development projects |
| 2023 | 6.3% | Government infrastructure modernization initiatives |
| 2024 | 6.1% | Increasing adoption of advanced technologies |
| 2025 | 6.1% | Expansion of transportation and logistics networks |
| 2026 | 6.2% | Rising electricity demand across industries |
| 2027 | 6.2% | Rapid growth in telecom and data center sectors |
| 2028 | 5.8% | Growing renewable energy integration projects |
| 2029 | 5.6% | Expansion of manufacturing activities |
| 2030 | 6.1% | Rising electricity demand across industries |
| 2031 | 6.3% | Growing urbanization and commercial development |
| 2032 | 5.9% | Growing urbanization and commercial development |
Note - Market size estimations and growth projections presented in this report are based on 6Wresearch's advanced forecasting approach, validated with industry datasets as of June 2026.
Hungary Desktop Virtualization Market Synopsis
As remote work trends solidify in Hungary, organizations are rapidly shifting towards desktop virtualization to meet evolving workforce needs. This change enables seamless access to critical applications and data from various devices, thereby improving overall productivity.
In educational institutions, desktop virtualization is gaining traction as schools adapt to hybrid learning models. By centralizing desktop management, institutions can offer students and staff secure access to resources while optimizing IT expenditure, driving further market adoption.
Hungary Desktop Virtualization Market Key Takeaways
- The market is set for consistent growth, influenced by remote work dynamics and increasing need for flexible solutions.
- Centralized management features of desktop virtualization are enhancing operational efficiency across various sectors.
- Educational institutions are among the fastest adopters, leveraging virtualization for improved access to resources.
- Government initiatives play a vital role in shaping the infrastructure and policies supporting desktop virtualization technologies.
- Security concerns and integration challenges remain critical issues that providers must address to ensure market penetration.
Evaluation of Restraints in Hungary Desktop Virtualization Market
While the Hungary Desktop Virtualization Market is on an upward trajectory, several restraints limit its potential. Resistance to change within organizations often hampers the adoption of new technologies. Additionally, concerns regarding data security in virtualized environments create apprehension among businesses. Many organizations are also faced with the challenge of integrating these solutions with their existing IT frameworks, which can complicate the transition to desktop virtualization. Addressing these hurdles will be crucial for the market's sustained growth.
Hungary Desktop Virtualization Market Trends
Several trends are shaping the landscape of desktop virtualization in Hungary. The increasing integration of Artificial Intelligence (AI) and Machine Learning (ML) into virtualization solutions is enhancing user experience and optimizing resource allocation. Additionally, the rise of Bring Your Own Device (BYOD) policies is compelling organizations to invest in virtualization technologies that support diverse device ecosystems. Cloud-based solutions are becoming increasingly popular, providing companies with the flexibility to scale their infrastructure rapidly.
Hungary Desktop Virtualization Market Opportunities
There are notable opportunities for growth in the Hungary Desktop Virtualization Market. As businesses seek to enhance operational efficiency and reduce costs, investing in virtualization technologies becomes increasingly attractive. Educational institutions represent a significant opportunity; their transition to online learning is prompting the need for robust desktop solutions. Furthermore, the government's focus on digital transformation initiatives is likely to drive investments in infrastructure modernization, creating a conducive environment for virtualization solutions.
Government Initiatives in the Hungary Desktop Virtualization Market
Government policies in Hungary are fostering a supportive environment for the desktop virtualization market. Initiatives aimed at modernizing IT infrastructure, enhancing cybersecurity measures, and establishing stringent data privacy standards are crucial. Incentives for technology adoption and investments in digital transformation further stimulate demand for virtualization solutions. Such policies not only enhance organizational capabilities but also align with the broader economic objectives of fostering innovation and competitiveness.
Future Insights of the Hungary Desktop Virtualization Market
Looking ahead to 2026-2032, the Hungary Desktop Virtualization Market is poised for robust growth driven by the ongoing digital transformation across sectors. The rising emphasis on hybrid work models will continue to spur investments in virtualization technologies. As organizations increasingly prioritize security and flexibility, the demand for innovative desktop solutions will escalate. Moreover, advancements in technology will likely simplify integration processes, further enhancing the appeal of desktop virtualization.
Hungary Desktop Virtualization Market Latest Developments (May 2025 - June 2026)
The desktop virtualization landscape in Hungary is evolving with ongoing developments in technology and policy. Recent updates reflect a growing interest among organizations to adopt hybrid solutions that combine both on-premise and cloud-based services. Additionally, there has been an increase in collaborations between tech firms and educational institutions, aimed at advancing virtual learning environments. These trends suggest a dynamic shift towards embracing modern, scalable solutions to meet the needs of a changing workforce.
Hungary Desktop Virtualization Market - Key Attractiveness of the Report
- 10 Years of Market Numbers
- Historical Data Starting from 2022 to 2025
- Base Year: 2025
- Forecast Data until 2032
- Key Performance Indicators Impacting the Market
- Major Upcoming Developments and Projects
Key Highlights of the Report:
- Hungary Desktop Virtualization Market Outlook
- Market Size of Hungary Desktop Virtualization Market, 2025
- Forecast of Hungary Desktop Virtualization Market, 2032
- Historical Data and Forecast of Hungary Desktop Virtualization Revenues & Volume for the Period 2022-2032F
- Hungary Desktop Virtualization Market Trend Evolution
- Hungary Desktop Virtualization Market Drivers and Challenges
- Hungary Desktop Virtualization Price Trends
- Hungary Desktop Virtualization Porter's Five Forces
- Hungary Desktop Virtualization Industry Life Cycle
- Historical Data and Forecast of Hungary Desktop Virtualization Market Revenues & Volume By Desktop Delivery Platform for the Period 2022-2032F
- Historical Data and Forecast of Hungary Desktop Virtualization Market Revenues & Volume By Hosted Virtual Desktop (HVD) for the Period 2022-2032F
- Historical Data and Forecast of Hungary Desktop Virtualization Market Revenues & Volume By Hosted Shared Desktop (HSD) for the Period 2022-2032F
- Historical Data and Forecast of Hungary Desktop Virtualization Market Revenues & Volume By Other Desktop Delivery Platforms for the Period 2022-2032F
- Historical Data and Forecast of Hungary Desktop Virtualization Market Revenues & Volume By Deployment Mode for the Period 2022-2032F
- Historical Data and Forecast of Hungary Desktop Virtualization Market Revenues & Volume By On-premise for the Period 2022-2032F
- Historical Data and Forecast of Hungary Desktop Virtualization Market Revenues & Volume By Cloud-Based for the Period 2022-2032F
- Historical Data and Forecast of Hungary Desktop Virtualization Market Revenues & Volume By End-users for the Period 2022-2032F
- Historical Data and Forecast of Hungary Desktop Virtualization Market Revenues & Volume By Financial Services for the Period 2022-2032F
- Historical Data and Forecast of Hungary Desktop Virtualization Market Revenues & Volume By Healthcare for the Period 2022-2032F
- Historical Data and Forecast of Hungary Desktop Virtualization Market Revenues & Volume By Manufacturing for the Period 2022-2032F
- Historical Data and Forecast of Hungary Desktop Virtualization Market Revenues & Volume By IT and Telecommunications for the Period 2022-2032F
- Historical Data and Forecast of Hungary Desktop Virtualization Market Revenues & Volume By Other End-user Verticals for the Period 2022-2032F
- Hungary Desktop Virtualization Import Export Trade Statistics
- Market Opportunity Assessment By Desktop Delivery Platform
- Market Opportunity Assessment By Deployment Mode
- Market Opportunity Assessment By End-users
- Hungary Desktop Virtualization Top Companies Market Share
- Hungary Desktop Virtualization Competitive Benchmarking By Technical and Operational Parameters
- Hungary Desktop Virtualization Company Profiles
- Hungary Desktop Virtualization Key Strategic Recommendations






































