Hungary Electrical and Electronics Ceramics Market (2026-2032) | Share, Industry, Outlook, Size & Revenue, Forecast, Competitive Landscape, Companies, Trends, Value, Growth, Analysis, Segmentation
Market Forecast By Material Type (Alumina Ceramics, Titanate Ceramics, Zirconia Ceramics, Silica Ceramics), By Product Type (Monolithic Ceramics, Ceramics Matrix Composites, Ceramics Coatings), By End- User Industry (Home Appliances, Power Grids, Medical Devices, Mobile Phones) And Competitive Landscape
| Product Code: ETC7499205 | Publication Date: Sep 2024 | Updated Date: Apr 2026 | Product Type: Market Research Report | |
| Publisher: 6Wresearch | Author: Vasudha | No. of Pages: 75 | No. of Figures: 35 | No. of Tables: 20 |
Hungary Electrical And Electronics Ceramics Market Size (2020-2030)
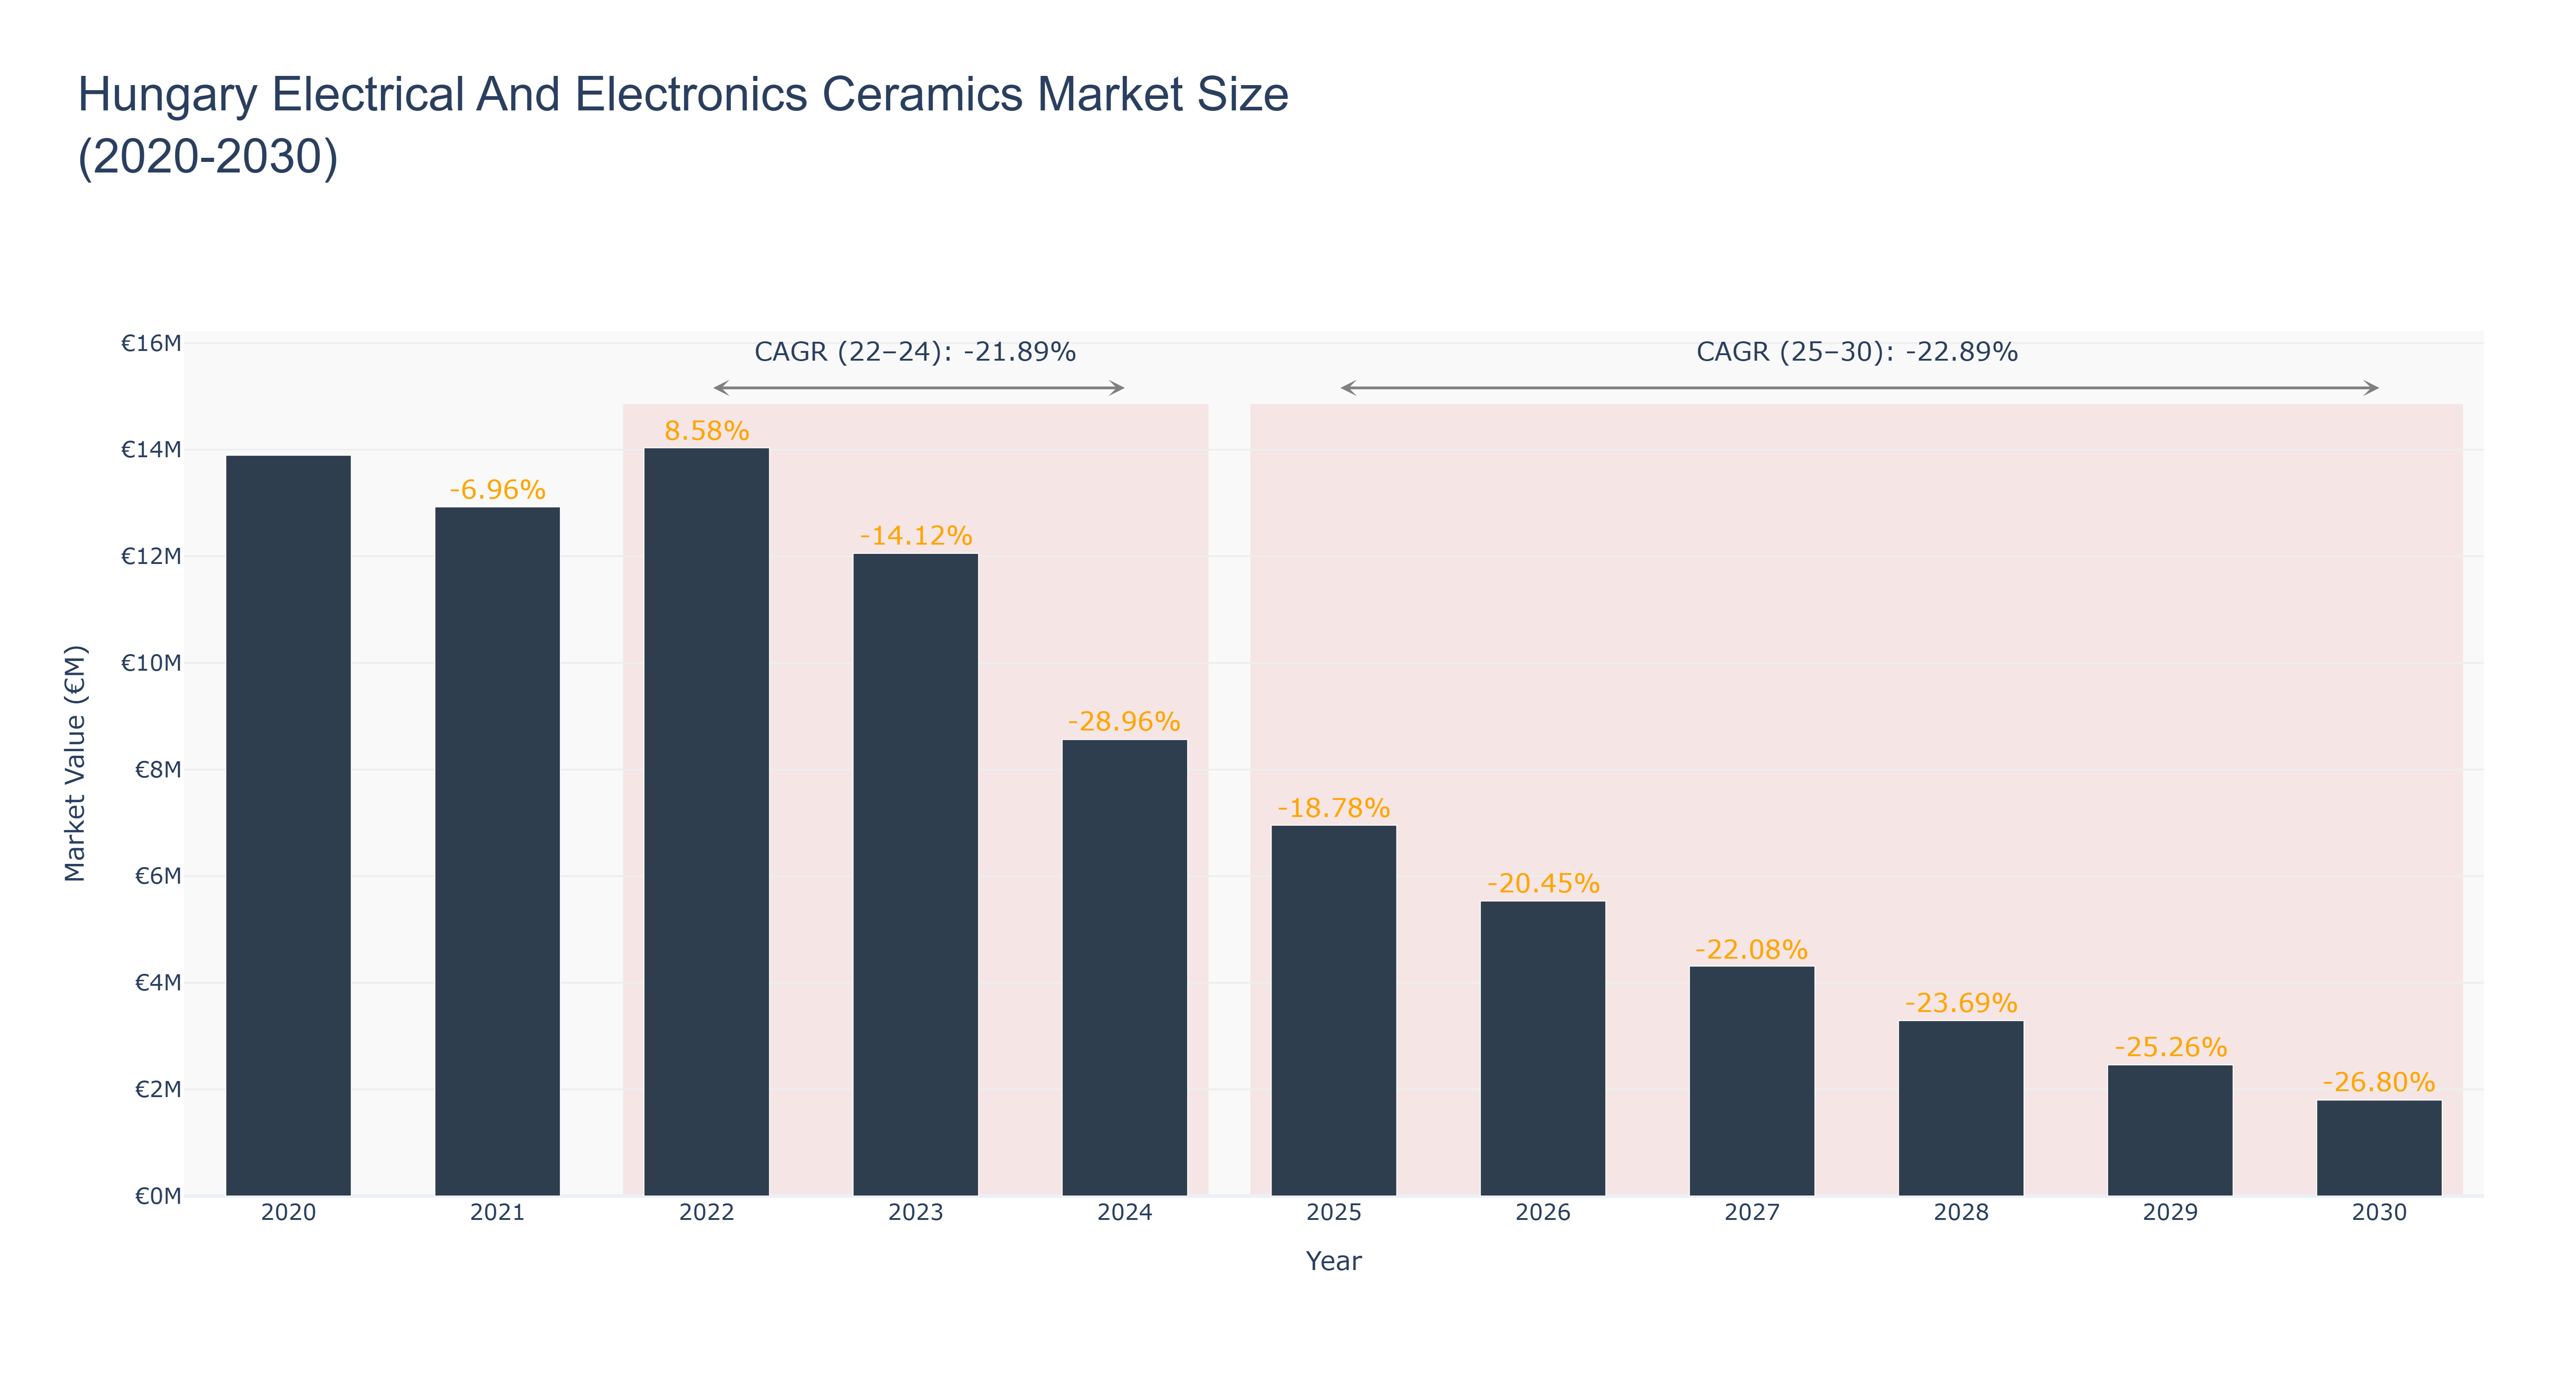
The Hungary Electrical and Electronics Ceramics Market experienced its peak in 2020, with a market size of €13.89 million. Following this, actual data from 2021 to 2023 revealed fluctuations in market performance, with a decline to €12.93 million in 2021, a recovery to €14.04 million in 2022, and a significant drop to €12.05 million in 2023, culminating in a projected market size of €8.56 million by 2024. The compound annual growth rate (CAGR) for the actual period (2022-2024) stands at -21.89%. Looking beyond, the forecasted period from 2025 to 2030 indicates a continuous decline, with the market projected to shrink to €1.80 million, reflecting a CAGR of -22.89%. Factors driving this downturn include increased competition from alternative materials, reduced domestic demand, and broader economic challenges. As the market evolves, a focus on innovation and sustainable practices will be crucial for potential recovery.
Hungary Electrical And Electronics Ceramics Market: Production & Trade Performance (2019-2025)
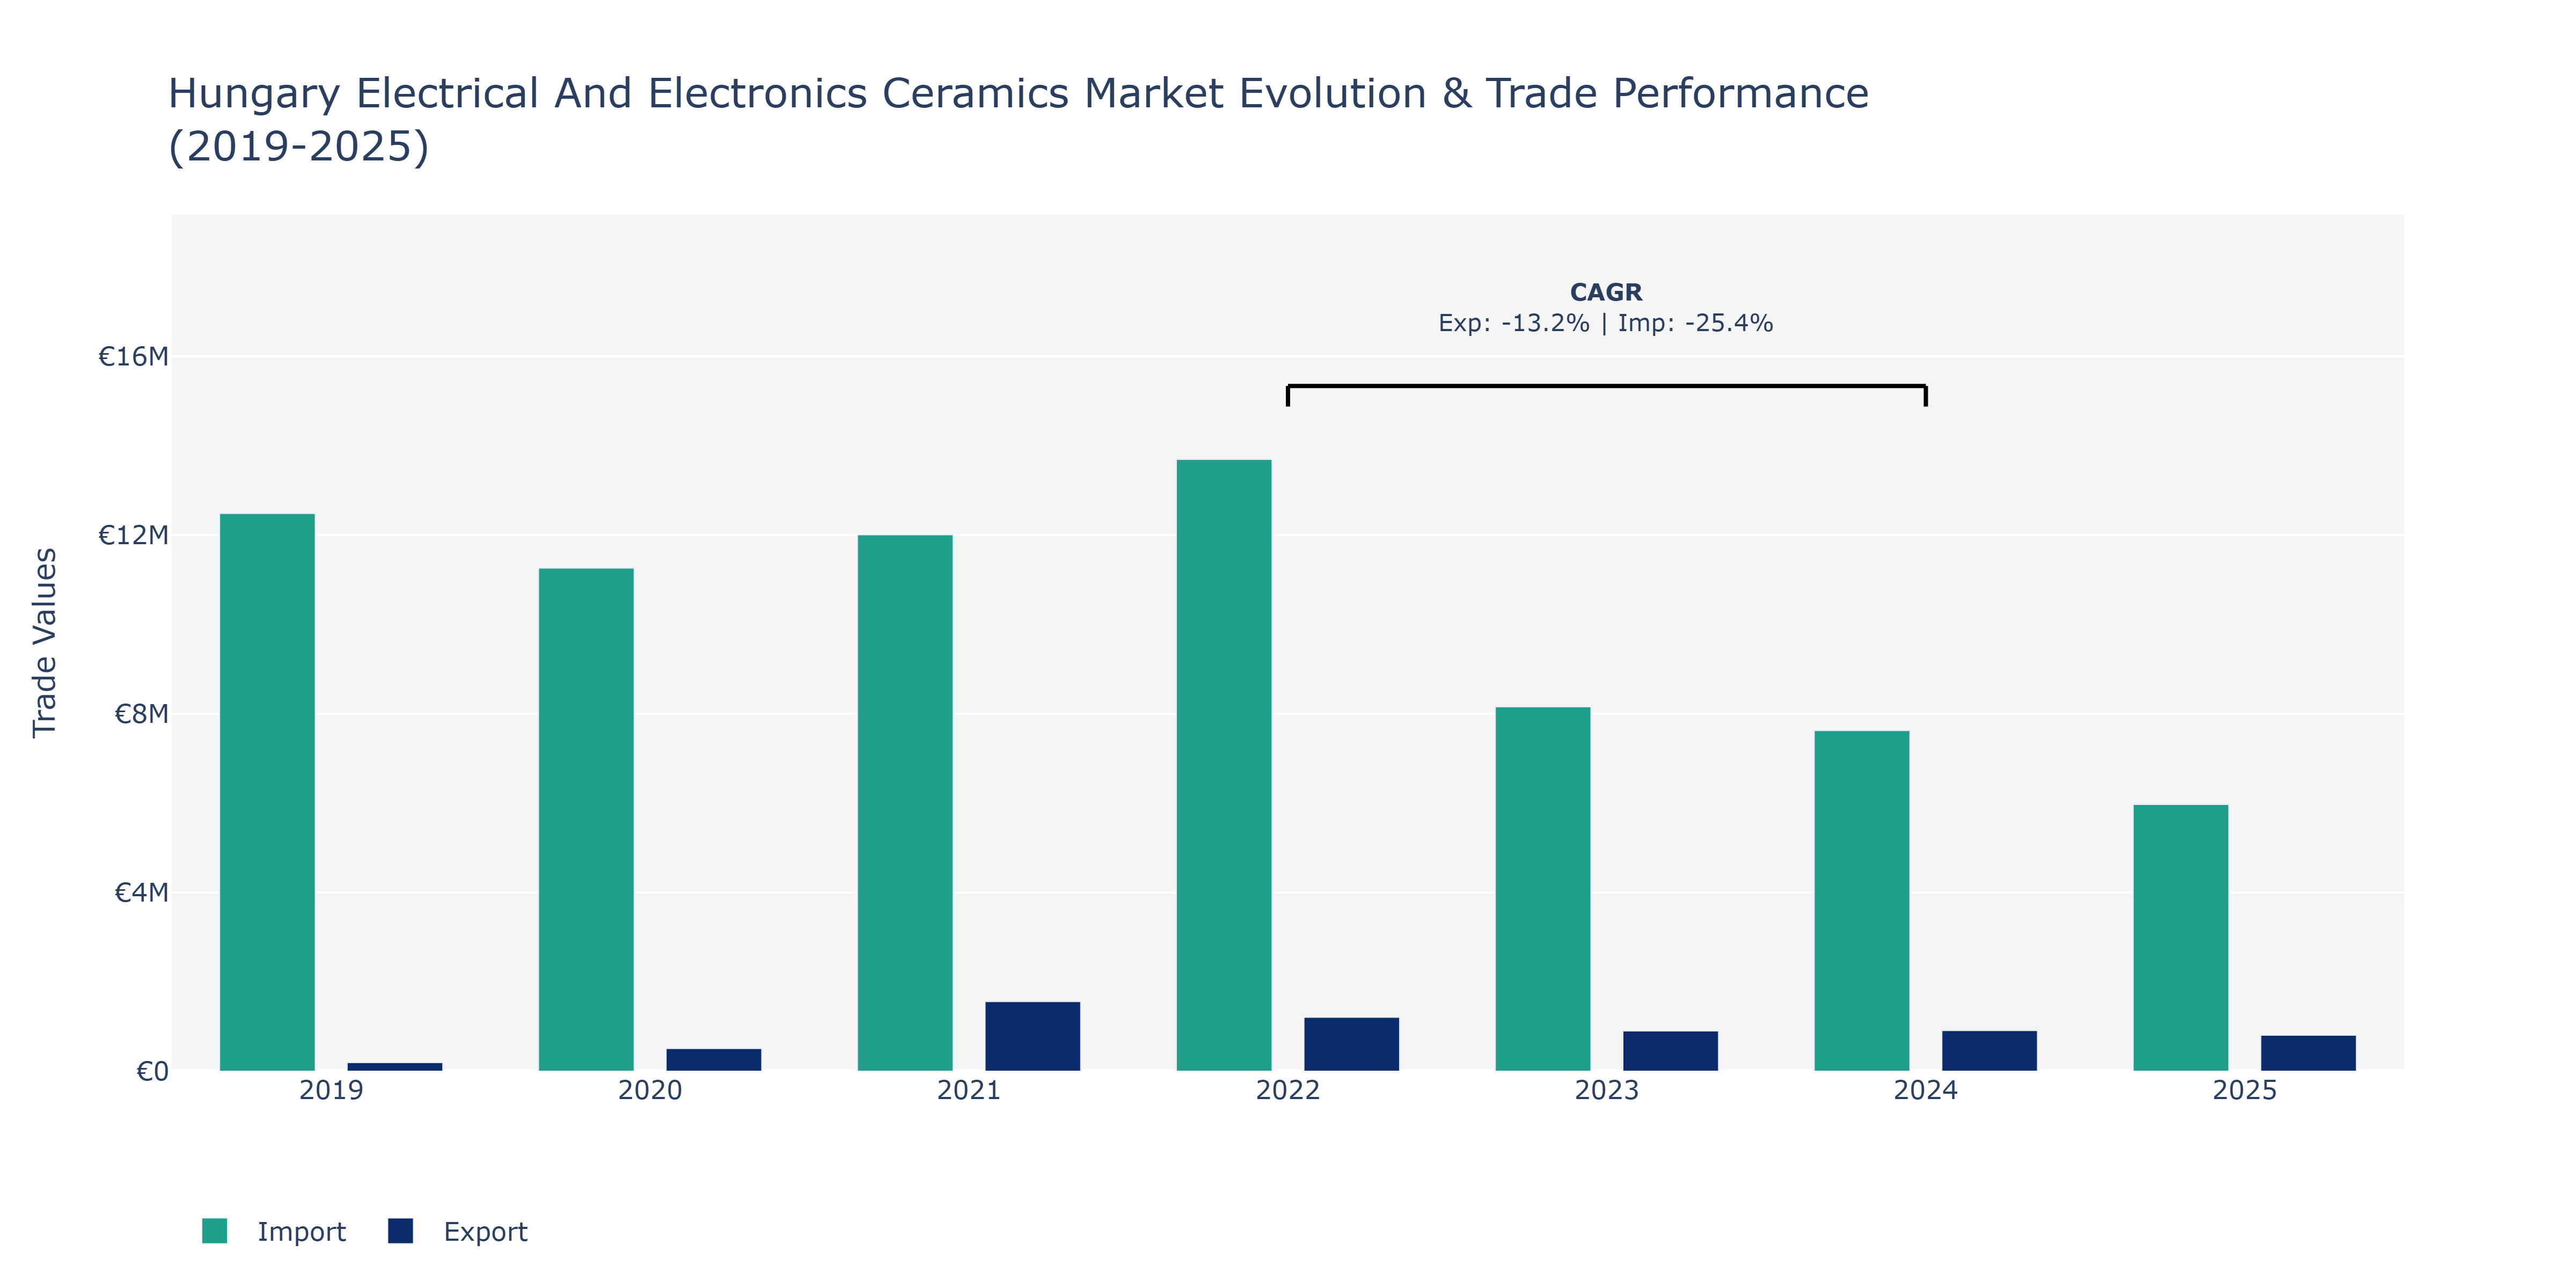
In the Hungary Electrical And Electronics Ceramics Market, exports experienced fluctuations over the years, starting at €193.73 thousand in 2019 and reaching a peak of €1.56 million in 2021 before declining to €803.30 thousand in 2025. This decline could be attributed to global supply chain disruptions and market saturation in certain product segments. On the other hand, imports also fluctuated, with a peak of €13.69 million in 2022 after starting at €12.48 million in 2019. The subsequent decrease to €5.97 million in 2025 may be influenced by shifting trade policies and a focus on domestic manufacturing to reduce dependence on imports. These trends align with the broader global shifts towards sustainable and localized production methods in the electronics industry.
Key Highlights of the Report:
- Hungary Electrical and Electronics Ceramics Market Outlook
- Market Size of Hungary Electrical and Electronics Ceramics Market, 2025
- Forecast of Hungary Electrical and Electronics Ceramics Market, 2032
- Historical Data and Forecast of Hungary Electrical and Electronics Ceramics Revenues & Volume for the Period 2022-2032F
- Hungary Electrical and Electronics Ceramics Market Trend Evolution
- Hungary Electrical and Electronics Ceramics Market Drivers and Challenges
- Hungary Electrical and Electronics Ceramics Price Trends
- Hungary Electrical and Electronics Ceramics Porter's Five Forces
- Hungary Electrical and Electronics Ceramics Industry Life Cycle
- Historical Data and Forecast of Hungary Electrical and Electronics Ceramics Market Revenues & Volume By Material Type for the Period 2022-2032F
- Historical Data and Forecast of Hungary Electrical and Electronics Ceramics Market Revenues & Volume By Alumina Ceramics for the Period 2022-2032F
- Historical Data and Forecast of Hungary Electrical and Electronics Ceramics Market Revenues & Volume By Titanate Ceramics for the Period 2022-2032F
- Historical Data and Forecast of Hungary Electrical and Electronics Ceramics Market Revenues & Volume By Zirconia Ceramics for the Period 2022-2032F
- Historical Data and Forecast of Hungary Electrical and Electronics Ceramics Market Revenues & Volume By Silica Ceramics for the Period 2022-2032F
- Historical Data and Forecast of Hungary Electrical and Electronics Ceramics Market Revenues & Volume By Product Type for the Period 2022-2032F
- Historical Data and Forecast of Hungary Electrical and Electronics Ceramics Market Revenues & Volume By Monolithic Ceramics for the Period 2022-2032F
- Historical Data and Forecast of Hungary Electrical and Electronics Ceramics Market Revenues & Volume By Ceramics Matrix Composites for the Period 2022-2032F
- Historical Data and Forecast of Hungary Electrical and Electronics Ceramics Market Revenues & Volume By Ceramics Coatings for the Period 2022-2032F
- Historical Data and Forecast of Hungary Electrical and Electronics Ceramics Market Revenues & Volume By End- User Industry for the Period 2022-2032F
- Historical Data and Forecast of Hungary Electrical and Electronics Ceramics Market Revenues & Volume By Home Appliances for the Period 2022-2032F
- Historical Data and Forecast of Hungary Electrical and Electronics Ceramics Market Revenues & Volume By Power Grids for the Period 2022-2032F
- Historical Data and Forecast of Hungary Electrical and Electronics Ceramics Market Revenues & Volume By Medical Devices for the Period 2022-2032F
- Historical Data and Forecast of Hungary Electrical and Electronics Ceramics Market Revenues & Volume By Mobile Phones for the Period 2022-2032F
- Hungary Electrical and Electronics Ceramics Import Export Trade Statistics
- Market Opportunity Assessment By Material Type
- Market Opportunity Assessment By Product Type
- Market Opportunity Assessment By End- User Industry
- Hungary Electrical and Electronics Ceramics Top Companies Market Share
- Hungary Electrical and Electronics Ceramics Competitive Benchmarking By Technical and Operational Parameters
- Hungary Electrical and Electronics Ceramics Company Profiles
- Hungary Electrical and Electronics Ceramics Key Strategic Recommendations
Frequently Asked Questions About the Market Study (FAQs):
6Wresearch actively monitors the Hungary Electrical and Electronics Ceramics Market and publishes its comprehensive annual report, highlighting emerging trends, growth drivers, revenue analysis, and forecast outlook. Our insights help businesses to make data-backed strategic decisions with ongoing market dynamics. Our analysts track relevent industries related to the Hungary Electrical and Electronics Ceramics Market, allowing our clients with actionable intelligence and reliable forecasts tailored to emerging regional needs.
Yes, we provide customisation as per your requirements. To learn more, feel free to contact us on sales@6wresearch.com
1 Executive Summary |
2 Introduction |
2.1 Key Highlights of the Report |
2.2 Report Description |
2.3 Market Scope & Segmentation |
2.4 Research Methodology |
2.5 Assumptions |
3 Hungary Electrical and Electronics Ceramics Market Overview |
3.1 Hungary Country Macro Economic Indicators |
3.2 Hungary Electrical and Electronics Ceramics Market Revenues & Volume, 2022 & 2032F |
3.3 Hungary Electrical and Electronics Ceramics Market - Industry Life Cycle |
3.4 Hungary Electrical and Electronics Ceramics Market - Porter's Five Forces |
3.5 Hungary Electrical and Electronics Ceramics Market Revenues & Volume Share, By Material Type, 2022 & 2032F |
3.6 Hungary Electrical and Electronics Ceramics Market Revenues & Volume Share, By Product Type, 2022 & 2032F |
3.7 Hungary Electrical and Electronics Ceramics Market Revenues & Volume Share, By End- User Industry, 2022 & 2032F |
4 Hungary Electrical and Electronics Ceramics Market Dynamics |
4.1 Impact Analysis |
4.2 Market Drivers |
4.2.1 Increasing demand for electronic devices in various industries |
4.2.2 Technological advancements leading to the development of innovative ceramics for electrical applications |
4.2.3 Growing focus on energy efficiency and sustainability driving the adoption of ceramics in electrical components |
4.3 Market Restraints |
4.3.1 Fluctuations in raw material prices affecting the production cost of ceramics |
4.3.2 Intense competition from alternative materials like plastics and metals in the electrical and electronics industry |
5 Hungary Electrical and Electronics Ceramics Market Trends |
6 Hungary Electrical and Electronics Ceramics Market, By Types |
6.1 Hungary Electrical and Electronics Ceramics Market, By Material Type |
6.1.1 Overview and Analysis |
6.1.2 Hungary Electrical and Electronics Ceramics Market Revenues & Volume, By Material Type, 2022-2032F |
6.1.3 Hungary Electrical and Electronics Ceramics Market Revenues & Volume, By Alumina Ceramics, 2022-2032F |
6.1.4 Hungary Electrical and Electronics Ceramics Market Revenues & Volume, By Titanate Ceramics, 2022-2032F |
6.1.5 Hungary Electrical and Electronics Ceramics Market Revenues & Volume, By Zirconia Ceramics, 2022-2032F |
6.1.6 Hungary Electrical and Electronics Ceramics Market Revenues & Volume, By Silica Ceramics, 2022-2032F |
6.2 Hungary Electrical and Electronics Ceramics Market, By Product Type |
6.2.1 Overview and Analysis |
6.2.2 Hungary Electrical and Electronics Ceramics Market Revenues & Volume, By Monolithic Ceramics, 2022-2032F |
6.2.3 Hungary Electrical and Electronics Ceramics Market Revenues & Volume, By Ceramics Matrix Composites, 2022-2032F |
6.2.4 Hungary Electrical and Electronics Ceramics Market Revenues & Volume, By Ceramics Coatings, 2022-2032F |
6.3 Hungary Electrical and Electronics Ceramics Market, By End- User Industry |
6.3.1 Overview and Analysis |
6.3.2 Hungary Electrical and Electronics Ceramics Market Revenues & Volume, By Home Appliances, 2022-2032F |
6.3.3 Hungary Electrical and Electronics Ceramics Market Revenues & Volume, By Power Grids, 2022-2032F |
6.3.4 Hungary Electrical and Electronics Ceramics Market Revenues & Volume, By Medical Devices, 2022-2032F |
6.3.5 Hungary Electrical and Electronics Ceramics Market Revenues & Volume, By Mobile Phones, 2022-2032F |
7 Hungary Electrical and Electronics Ceramics Market Import-Export Trade Statistics |
7.1 Hungary Electrical and Electronics Ceramics Market Export to Major Countries |
7.2 Hungary Electrical and Electronics Ceramics Market Imports from Major Countries |
8 Hungary Electrical and Electronics Ceramics Market Key Performance Indicators |
8.1 Research and development investment in new ceramic materials for electrical and electronics applications |
8.2 Number of patents filed for innovative ceramic technologies in the market |
8.3 Adoption rate of ceramics in key electrical and electronics sectors |
8.4 Regulatory compliance and certifications obtained for electrical and electronics ceramics |
8.5 Rate of adoption of energy-efficient ceramic components in the market |
9 Hungary Electrical and Electronics Ceramics Market - Opportunity Assessment |
9.1 Hungary Electrical and Electronics Ceramics Market Opportunity Assessment, By Material Type, 2022 & 2032F |
9.2 Hungary Electrical and Electronics Ceramics Market Opportunity Assessment, By Product Type, 2022 & 2032F |
9.3 Hungary Electrical and Electronics Ceramics Market Opportunity Assessment, By End- User Industry, 2022 & 2032F |
10 Hungary Electrical and Electronics Ceramics Market - Competitive Landscape |
10.1 Hungary Electrical and Electronics Ceramics Market Revenue Share, By Companies, 2025 |
10.2 Hungary Electrical and Electronics Ceramics Market Competitive Benchmarking, By Operating and Technical Parameters |
11 Company Profiles |
12 Recommendations |
13 Disclaimer |
Export potential assessment - trade Analytics for 2030
Export potential enables firms to identify high-growth global markets with greater confidence by combining advanced trade intelligence with a structured quantitative methodology. The framework analyzes emerging demand trends and country-level import patterns while integrating macroeconomic and trade datasets such as GDP and population forecasts, bilateral import–export flows, tariff structures, elasticity differentials between developed and developing economies, geographic distance, and import demand projections. Using weighted trade values from 2020–2024 as the base period to project country-to-country export potential for 2030, these inputs are operationalized through calculated drivers such as gravity model parameters, tariff impact factors, and projected GDP per-capita growth. Through an analysis of hidden potentials, demand hotspots, and market conditions that are most favorable to success, this method enables firms to focus on target countries, maximize returns, and global expansion with data, backed by accuracy.
By factoring in the projected importer demand gap that is currently unmet and could be potential opportunity, it identifies the potential for the Exporter (Country) among 190 countries, against the general trade analysis, which identifies the biggest importer or exporter.
To discover high-growth global markets and optimize your business strategy:
Click Here
Pricing
- Single User License$ 1,995
- Department License$ 2,400
- Site License$ 3,120
- Global License$ 3,795

Thought Leadership
Search
Thought Leadership and Analyst Meet


Our Clients
Latest Reports
- New Zealand Aseptic Manufacturing Market (2026-2032)
- Netherlands Aseptic Manufacturing Market (2026-2032)
- Nauru Aseptic Manufacturing Market (2026-2032)
- Namibia Aseptic Manufacturing Market (2026-2032)
- Mozambique Aseptic Manufacturing Market (2026-2032)
- Montenegro Aseptic Manufacturing Market (2026-2032)
- Mongolia Aseptic Manufacturing Market (2026-2032)
- Monaco Aseptic Manufacturing Market (2026-2032)
- Micronesia Aseptic Manufacturing Market (2026-2032)
- Mauritius Aseptic Manufacturing Market (2026-2032)
Industry Events and Analyst Meet

HIMTEX 2026

India Refining Summit 2026

India EV Show 2026

EV tech India Expo 2026

Auto Tech Asia 2026
Whitepaper
- Middle East & Africa Commercial Security Market Click here to view more.
- Middle East & Africa Fire Safety Systems & Equipment Market Click here to view more.
- GCC Drone Market Click here to view more.
- Middle East Lighting Fixture Market Click here to view more.
- GCC Physical & Perimeter Security Market Click here to view more.
6WResearch In News
- Doha a strategic location for EV manufacturing hub: IPA Qatar
- Demand for luxury TVs surging in the GCC, says Samsung
- Empowering Growth: The Thriving Journey of Bangladesh’s Cable Industry
- Demand for luxury TVs surging in the GCC, says Samsung
- Video call with a traditional healer? Once unthinkable, it’s now common in South Africa
- Intelligent Buildings To Smooth GCC’s Path To Net Zero