Hungary Electromagnetic NDT Market (2025-2031) Outlook | Industry, Value, Analysis, Forecast, Revenue, Companies, Share, Size, Trends & Growth
Market Forecast By Method (Eddy Current Testing, Remote Field Testing, Magnetic Flux Leakage Testing), By Vertical (Oil & Gas, Power Generation, Automotive, Aerospace) And Competitive Landscape
| Product Code: ETC4591580 | Publication Date: Jul 2023 | Updated Date: Mar 2026 | Product Type: Report | |
| Publisher: 6Wresearch | Author: Ravi Bhandari | No. of Pages: 85 | No. of Figures: 45 | No. of Tables: 25 |
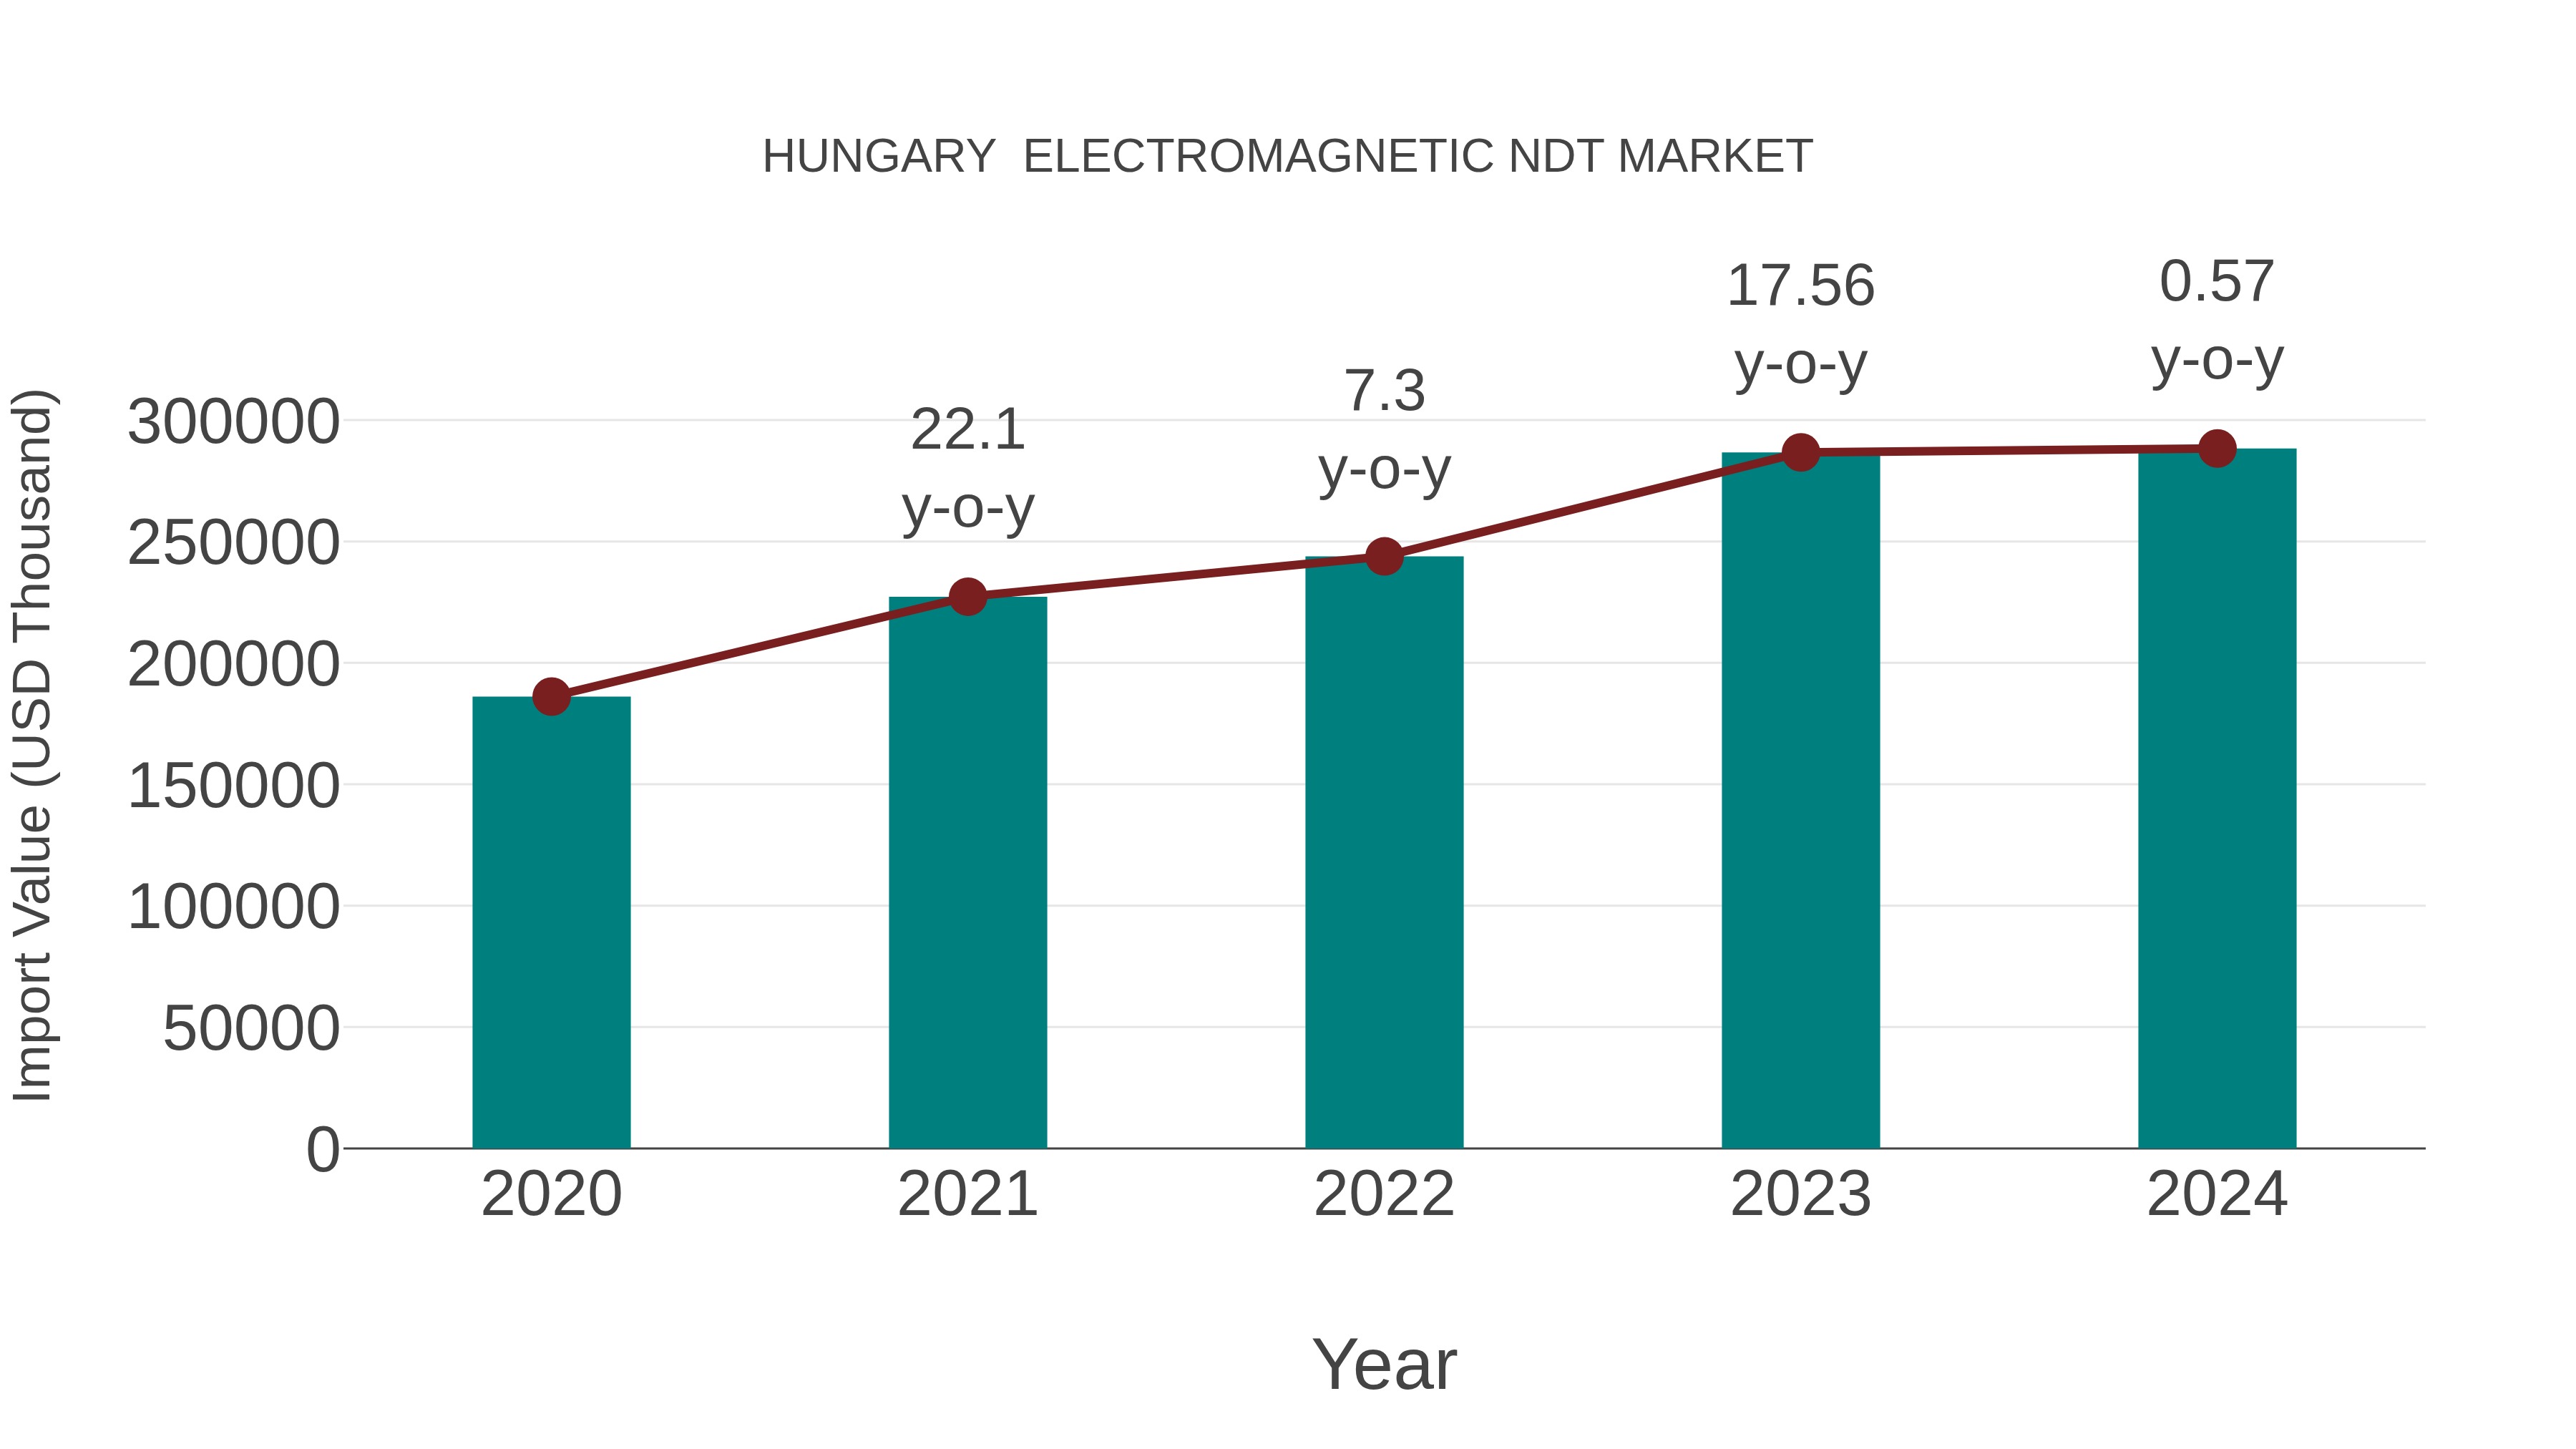
Hungary Electromagnetic Ndt Market: Import Trend Analysis
Hungary`s import trend for the electromagnetic NDT market showed a growth rate of 0.57% from 2023 to 2024, with a compound annual growth rate (CAGR) of 11.56% for the period 2020-2024. This steady but modest growth can be attributed to consistent demand for NDT equipment and technologies in various industries.
Key Highlights of the Report:
- Hungary Electromagnetic NDT Market Outlook
- Market Size of Hungary Electromagnetic NDT Market, 2024
- Forecast of Hungary Electromagnetic NDT Market, 2031
- Historical Data and Forecast of Hungary Electromagnetic NDT Revenues & Volume for the Period 2021 - 2031
- Hungary Electromagnetic NDT Market Trend Evolution
- Hungary Electromagnetic NDT Market Drivers and Challenges
- Hungary Electromagnetic NDT Price Trends
- Hungary Electromagnetic NDT Porter's Five Forces
- Hungary Electromagnetic NDT Industry Life Cycle
- Historical Data and Forecast of Hungary Electromagnetic NDT Market Revenues & Volume By Method for the Period 2021 - 2031
- Historical Data and Forecast of Hungary Electromagnetic NDT Market Revenues & Volume By Eddy Current Testing for the Period 2021 - 2031
- Historical Data and Forecast of Hungary Electromagnetic NDT Market Revenues & Volume By Remote Field Testing for the Period 2021 - 2031
- Historical Data and Forecast of Hungary Electromagnetic NDT Market Revenues & Volume By Magnetic Flux Leakage Testing for the Period 2021 - 2031
- Historical Data and Forecast of Hungary Electromagnetic NDT Market Revenues & Volume By Vertical for the Period 2021 - 2031
- Historical Data and Forecast of Hungary Electromagnetic NDT Market Revenues & Volume By Oil & Gas for the Period 2021 - 2031
- Historical Data and Forecast of Hungary Electromagnetic NDT Market Revenues & Volume By Power Generation for the Period 2021 - 2031
- Historical Data and Forecast of Hungary Electromagnetic NDT Market Revenues & Volume By Automotive for the Period 2021 - 2031
- Historical Data and Forecast of Hungary Electromagnetic NDT Market Revenues & Volume By Aerospace for the Period 2021 - 2031
- Hungary Electromagnetic NDT Import Export Trade Statistics
- Market Opportunity Assessment By Method
- Market Opportunity Assessment By Vertical
- Hungary Electromagnetic NDT Top Companies Market Share
- Hungary Electromagnetic NDT Competitive Benchmarking By Technical and Operational Parameters
- Hungary Electromagnetic NDT Company Profiles
- Hungary Electromagnetic NDT Key Strategic Recommendations
Hungary Electromagnetic NDT Market (2025-2031): FAQs
The Hungary electromagnetic NDT market encompasses the use of technologies such as eddy current testing and magnetic particle inspection to assess the integrity of materials without causing damage. Key players in this market include companies like GE Inspection Technologies and Zetec, offering a range of solutions for various industries such as aerospace, automotive, and manufacturing.
The future growth opportunities for the electromagnetic NDT market in Hungary are promising, driven by increasing adoption of advanced NDT technologies by key players such as GE Inspection Technologies, Olympus Corporation, and Zetec Inc. Additionally, the growing focus on improving infrastructure quality in industries like automotive, aerospace, and manufacturing will further propel the demand for electromagnetic NDT solutions in the Hungarian market.
The future outlook for the Hungary electromagnetic NDT market is promising, with advancements in technologies such as Eddy Current Testing (ECT) and Remote Field Testing (RFT) driving growth. Companies like GE Inspection Technologies and Olympus Corporation are investing in research and development to enhance inspection capabilities, catering to industries like automotive, aerospace, and manufacturing. The market is poised for expansion as demand for non-destructive testing solutions continues to rise, ensuring a positive long-term trajectory.
In Hungary's electromagnetic NDT market, customers are increasingly preferring advanced portable NDT devices like the Eddyfi Lyft system due to their ease of use, high accuracy, and portability. This reflects a growing trend towards on-site testing and inspection to reduce downtime and enhance operational efficiency in industries such as aerospace and automotive. Companies like GE Inspection Technologies and Olympus Corporation have adapted to these preferences by developing innovative solutions that cater to the evolving needs of customers in the region.
Some of the key competitors in Hungary's electromagnetic NDT market include GE Inspection Technologies, Olympus Corporation, and Eddyfi Technologies. GE Inspection Technologies is known for its advanced inspection solutions, particularly its Eddy Current Array technology. Olympus Corporation is a prominent player, offering a wide range of NDT equipment and solutions, including ultrasonic testing and phased array technology. Eddyfi Technologies specializes in advanced NDT inspection technologies, such as eddy current and electromagnetic testing solutions. These competitors position themselves as providers of high-quality, innovative NDT solutions tailored to meet the specific needs of industries in Hungary.
6Wresearch actively monitors the Hungary Electromagnetic NDT Market and publishes its comprehensive annual report, highlighting emerging trends, growth drivers, revenue analysis, and forecast outlook. Our insights help businesses to make data-backed strategic decisions with ongoing market dynamics. Our analysts track relevent industries related to the Hungary Electromagnetic NDT Market, allowing our clients with actionable intelligence and reliable forecasts tailored to emerging regional needs.
Yes, we provide customisation as per your requirements. To learn more, feel free to contact us on sales@6wresearch.com
1 Executive Summary |
2 Introduction |
2.1 Key Highlights of the Report |
2.2 Report Description |
2.3 Market Scope & Segmentation |
2.4 Research Methodology |
2.5 Assumptions |
3 Hungary Electromagnetic NDT Market Overview |
3.1 Hungary Country Macro Economic Indicators |
3.2 Hungary Electromagnetic NDT Market Revenues & Volume, 2021 & 2031F |
3.3 Hungary Electromagnetic NDT Market - Industry Life Cycle |
3.4 Hungary Electromagnetic NDT Market - Porter's Five Forces |
3.5 Hungary Electromagnetic NDT Market Revenues & Volume Share, By Method, 2021 & 2031F |
3.6 Hungary Electromagnetic NDT Market Revenues & Volume Share, By Vertical, 2021 & 2031F |
4 Hungary Electromagnetic NDT Market Dynamics |
4.1 Impact Analysis |
4.2 Market Drivers |
4.2.1 Increasing demand for non-destructive testing (NDT) solutions in industries such as aerospace, automotive, and manufacturing in Hungary. |
4.2.2 Technological advancements in electromagnetic NDT methods leading to more accurate and efficient testing processes. |
4.2.3 Stringent regulations and standards in Hungary promoting the adoption of electromagnetic NDT for quality control and safety purposes. |
4.3 Market Restraints |
4.3.1 High initial investment costs associated with acquiring electromagnetic NDT equipment and training personnel in Hungary. |
4.3.2 Limited awareness about the benefits of electromagnetic NDT among small and medium-sized enterprises in the country. |
5 Hungary Electromagnetic NDT Market Trends |
6 Hungary Electromagnetic NDT Market, By Types |
6.1 Hungary Electromagnetic NDT Market, By Method |
6.1.1 Overview and Analysis |
6.1.2 Hungary Electromagnetic NDT Market Revenues & Volume, By Method, 2021 - 2031F |
6.1.3 Hungary Electromagnetic NDT Market Revenues & Volume, By Eddy Current Testing, 2021 - 2031F |
6.1.4 Hungary Electromagnetic NDT Market Revenues & Volume, By Remote Field Testing, 2021 - 2031F |
6.1.5 Hungary Electromagnetic NDT Market Revenues & Volume, By Magnetic Flux Leakage Testing, 2021 - 2031F |
6.2 Hungary Electromagnetic NDT Market, By Vertical |
6.2.1 Overview and Analysis |
6.2.2 Hungary Electromagnetic NDT Market Revenues & Volume, By Oil & Gas, 2021 - 2031F |
6.2.3 Hungary Electromagnetic NDT Market Revenues & Volume, By Power Generation, 2021 - 2031F |
6.2.4 Hungary Electromagnetic NDT Market Revenues & Volume, By Automotive, 2021 - 2031F |
6.2.5 Hungary Electromagnetic NDT Market Revenues & Volume, By Aerospace, 2021 - 2031F |
7 Hungary Electromagnetic NDT Market Import-Export Trade Statistics |
7.1 Hungary Electromagnetic NDT Market Export to Major Countries |
7.2 Hungary Electromagnetic NDT Market Imports from Major Countries |
8 Hungary Electromagnetic NDT Market Key Performance Indicators |
8.1 Adoption rate of electromagnetic NDT technologies by key industries in Hungary. |
8.2 Number of training programs or certifications offered in electromagnetic NDT within the country. |
8.3 Percentage increase in government spending on infrastructure and industrial development, which may drive the demand for electromagnetic NDT services. |
9 Hungary Electromagnetic NDT Market - Opportunity Assessment |
9.1 Hungary Electromagnetic NDT Market Opportunity Assessment, By Method, 2021 & 2031F |
9.2 Hungary Electromagnetic NDT Market Opportunity Assessment, By Vertical, 2021 & 2031F |
10 Hungary Electromagnetic NDT Market - Competitive Landscape |
10.1 Hungary Electromagnetic NDT Market Revenue Share, By Companies, 2024 |
10.2 Hungary Electromagnetic NDT Market Competitive Benchmarking, By Operating and Technical Parameters |
11 Company Profiles |
12 Recommendations |
13 Disclaimer |
Export potential assessment - trade Analytics for 2030
Export potential enables firms to identify high-growth global markets with greater confidence by combining advanced trade intelligence with a structured quantitative methodology. The framework analyzes emerging demand trends and country-level import patterns while integrating macroeconomic and trade datasets such as GDP and population forecasts, bilateral import–export flows, tariff structures, elasticity differentials between developed and developing economies, geographic distance, and import demand projections. Using weighted trade values from 2020–2024 as the base period to project country-to-country export potential for 2030, these inputs are operationalized through calculated drivers such as gravity model parameters, tariff impact factors, and projected GDP per-capita growth. Through an analysis of hidden potentials, demand hotspots, and market conditions that are most favorable to success, this method enables firms to focus on target countries, maximize returns, and global expansion with data, backed by accuracy.
By factoring in the projected importer demand gap that is currently unmet and could be potential opportunity, it identifies the potential for the Exporter (Country) among 190 countries, against the general trade analysis, which identifies the biggest importer or exporter.
To discover high-growth global markets and optimize your business strategy:
Click Here
Pricing
- Single User License$ 1,995
- Department License$ 2,400
- Site License$ 3,120
- Global License$ 3,795

Search
Thought Leadership and Analyst Meet


Our Clients
Latest Reports
- Taiwan Food Delivery Platform Market (2026-2032) | Companies, Outlook, Analysis, Trends, Value, Revenue, Segmentation, Share, Forecast, Competitive Landscape, Growth, Size & Forecast
- United Kingdom (UK) Long-term Care Insurance Market (2026-2032) | Growth, Share, Consumer Insights, Drivers, Opportunities, Competition, Pricing Analysis, Segments, Restraints, Companies, Competitive, Value, Outlook, Size, Demand, Analysis, Challenges, Strategic Insights, Investment Trends, Revenue, Trends, Supply, Forecast
- United Kingdom (UK) Long Term Care Market (2026-2032) | Companies, Outlook, Analysis, Trends, Value, Revenue, Segmentation, Share, Forecast, Competitive Landscape, Growth, Size & Forecast
- Iraq Insulation and Waterproofing Market (2026-2032) | Outlook, Drivers, Growth, Size, Share, Industry, Revenue, Trends, Demand, Competitive, Strategic Insights, Opportunities, Segments, Companies, Challenges, Strategy, Consumer Insights, Analysis, Investment Trends, Value, Segmentation, Forecast, Restraints
- India Switchgear Market Outlook (2026-2032) | Size, Share, Trends, Growth, Revenue, Forecast, Analysis, Value, Outlook
- Pakistan Contraceptive Implants Market (2025-2031) | Demand, Growth, Size, Share, Industry, Pricing Analysis, Competitive, Strategic Insights, Strategy, Consumer Insights, Analysis, Investment Trends, Opportunities, Revenue, Segments, Value, Segmentation, Supply, Forecast, Restraints, Outlook, Competition, Drivers, Trends, Companies, Challenges
- Sri Lanka Packaging Market (2026-2032) | Outlook, Competition, Drivers, Trends, Demand, Pricing Analysis, Competitive, Strategic Insights, Companies, Challenges, Strategy, Consumer Insights, Analysis, Investment Trends, Opportunities, Growth, Size, Share, Industry, Revenue, Segments, Value, Segmentation, Supply, Forecast, Restraints
- India Kids Watches Market (2026-2032) | Strategy, Consumer Insights, Analysis, Investment Trends, Opportunities, Growth, Size, Share, Industry, Revenue, Segments, Value, Segmentation, Supply, Forecast, Restraints, Outlook, Competition, Drivers, Trends, Demand, Pricing Analysis, Competitive, Strategic Insights, Companies, Challenges
- Saudi Arabia Core Assurance Service Market (2025-2031) | Strategy, Consumer Insights, Analysis, Investment Trends, Opportunities, Growth, Size, Share, Industry, Revenue, Segments, Value, Segmentation, Supply, Forecast, Restraints, Outlook, Competition, Drivers, Trends, Demand, Pricing Analysis, Competitive, Strategic Insights, Companies, Challenges
- Romania Uninterruptible Power Supply (UPS) Market (2026-2032) | Industry, Analysis, Revenue, Size, Forecast, Outlook, Value, Trends, Share, Growth & Companies
Industry Events and Analyst Meet

India EV Show 2026

EV tech India Expo 2026

Auto Tech Asia 2026

Battery Tech India 2026

Smart Production Solutions Guangzhou 2026
Whitepaper
- Middle East & Africa Commercial Security Market Click here to view more.
- Middle East & Africa Fire Safety Systems & Equipment Market Click here to view more.
- GCC Drone Market Click here to view more.
- Middle East Lighting Fixture Market Click here to view more.
- GCC Physical & Perimeter Security Market Click here to view more.
6WResearch In News
- Doha a strategic location for EV manufacturing hub: IPA Qatar
- Demand for luxury TVs surging in the GCC, says Samsung
- Empowering Growth: The Thriving Journey of Bangladesh’s Cable Industry
- Demand for luxury TVs surging in the GCC, says Samsung
- Video call with a traditional healer? Once unthinkable, it’s now common in South Africa
- Intelligent Buildings To Smooth GCC’s Path To Net Zero