Hungary Graphene Market (2026-2032) | Competitive Landscape, Industry, Companies, Value, Outlook, Size & Revenue, Share, Forecast, Growth, Segmentation, Trends, Analysis
Market Forecast By Type (Bulk Graphene, Monolayer Graphene), By Application (Composites, Paints, Coatings, and Inks, Energy Storage & Harvesting, Electronics, Catalyst, Tires, Others), By End-use Industry (Automotive & Transportation, Aerospace, Electronics, Military & Defense, Others) And Competitive Landscape
| Product Code: ETC7501316 | Publication Date: Sep 2024 | Updated Date: Apr 2026 | Product Type: Market Research Report | |
| Publisher: 6Wresearch | Author: Shubham Padhi | No. of Pages: 75 | No. of Figures: 35 | No. of Tables: 20 |
Hungary Graphene Market Size (2020-2030)
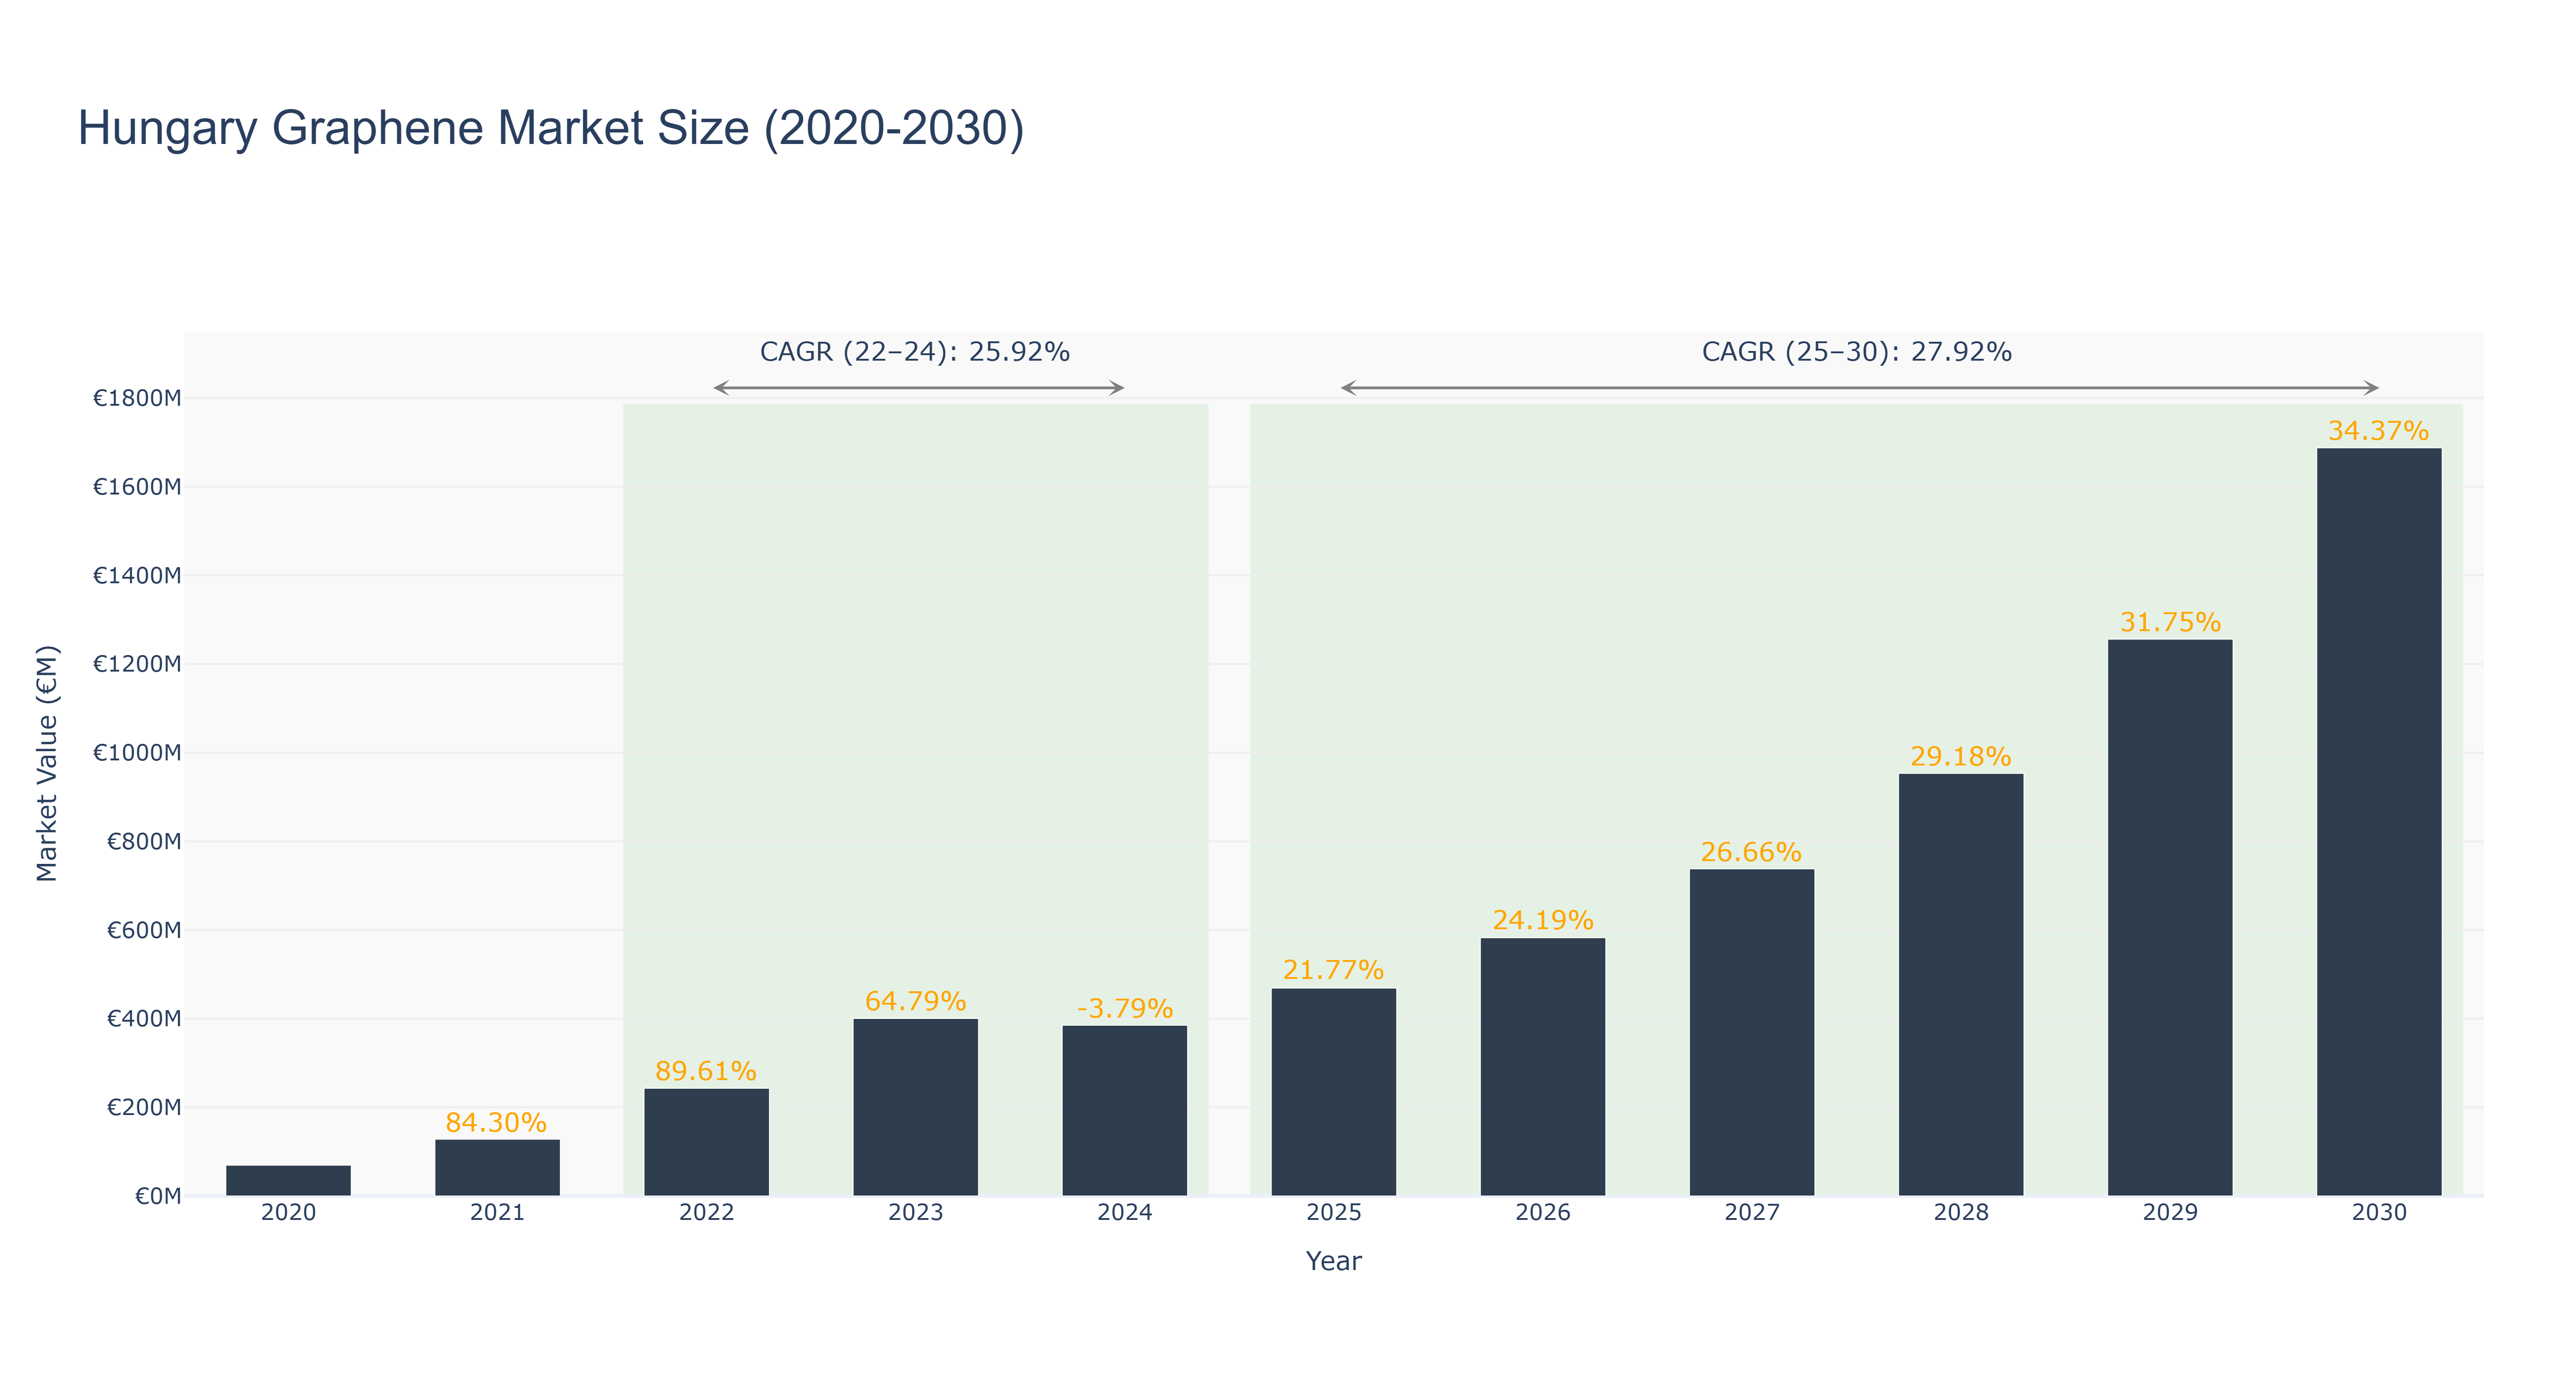
The Hungary Graphene Market has exhibited significant growth, peaking in 2023 with a market size of €400.45 million, following a remarkable increase from €243.00 million in 2022. The actual data from 2022 to 2024 reflects a compound annual growth rate (CAGR) of 25.92%, despite a slight decline of 3.79% in 2024, attributed to market stabilization and potential overcapacity in production. Looking ahead, the forecasted period from 2025 to 2030 is projected to witness a robust CAGR of 27.92%, as the market size is anticipated to reach €1.69 billion by 2030. This growth is driven by increasing applications of graphene in electronics, energy storage, and advanced materials. Upcoming innovations and investments in research and development will further bolster market expansion, positioning Hungary as a pivotal player in the global graphene landscape.
Hungary Graphene Market: Production & Trade Performance (2019-2025)
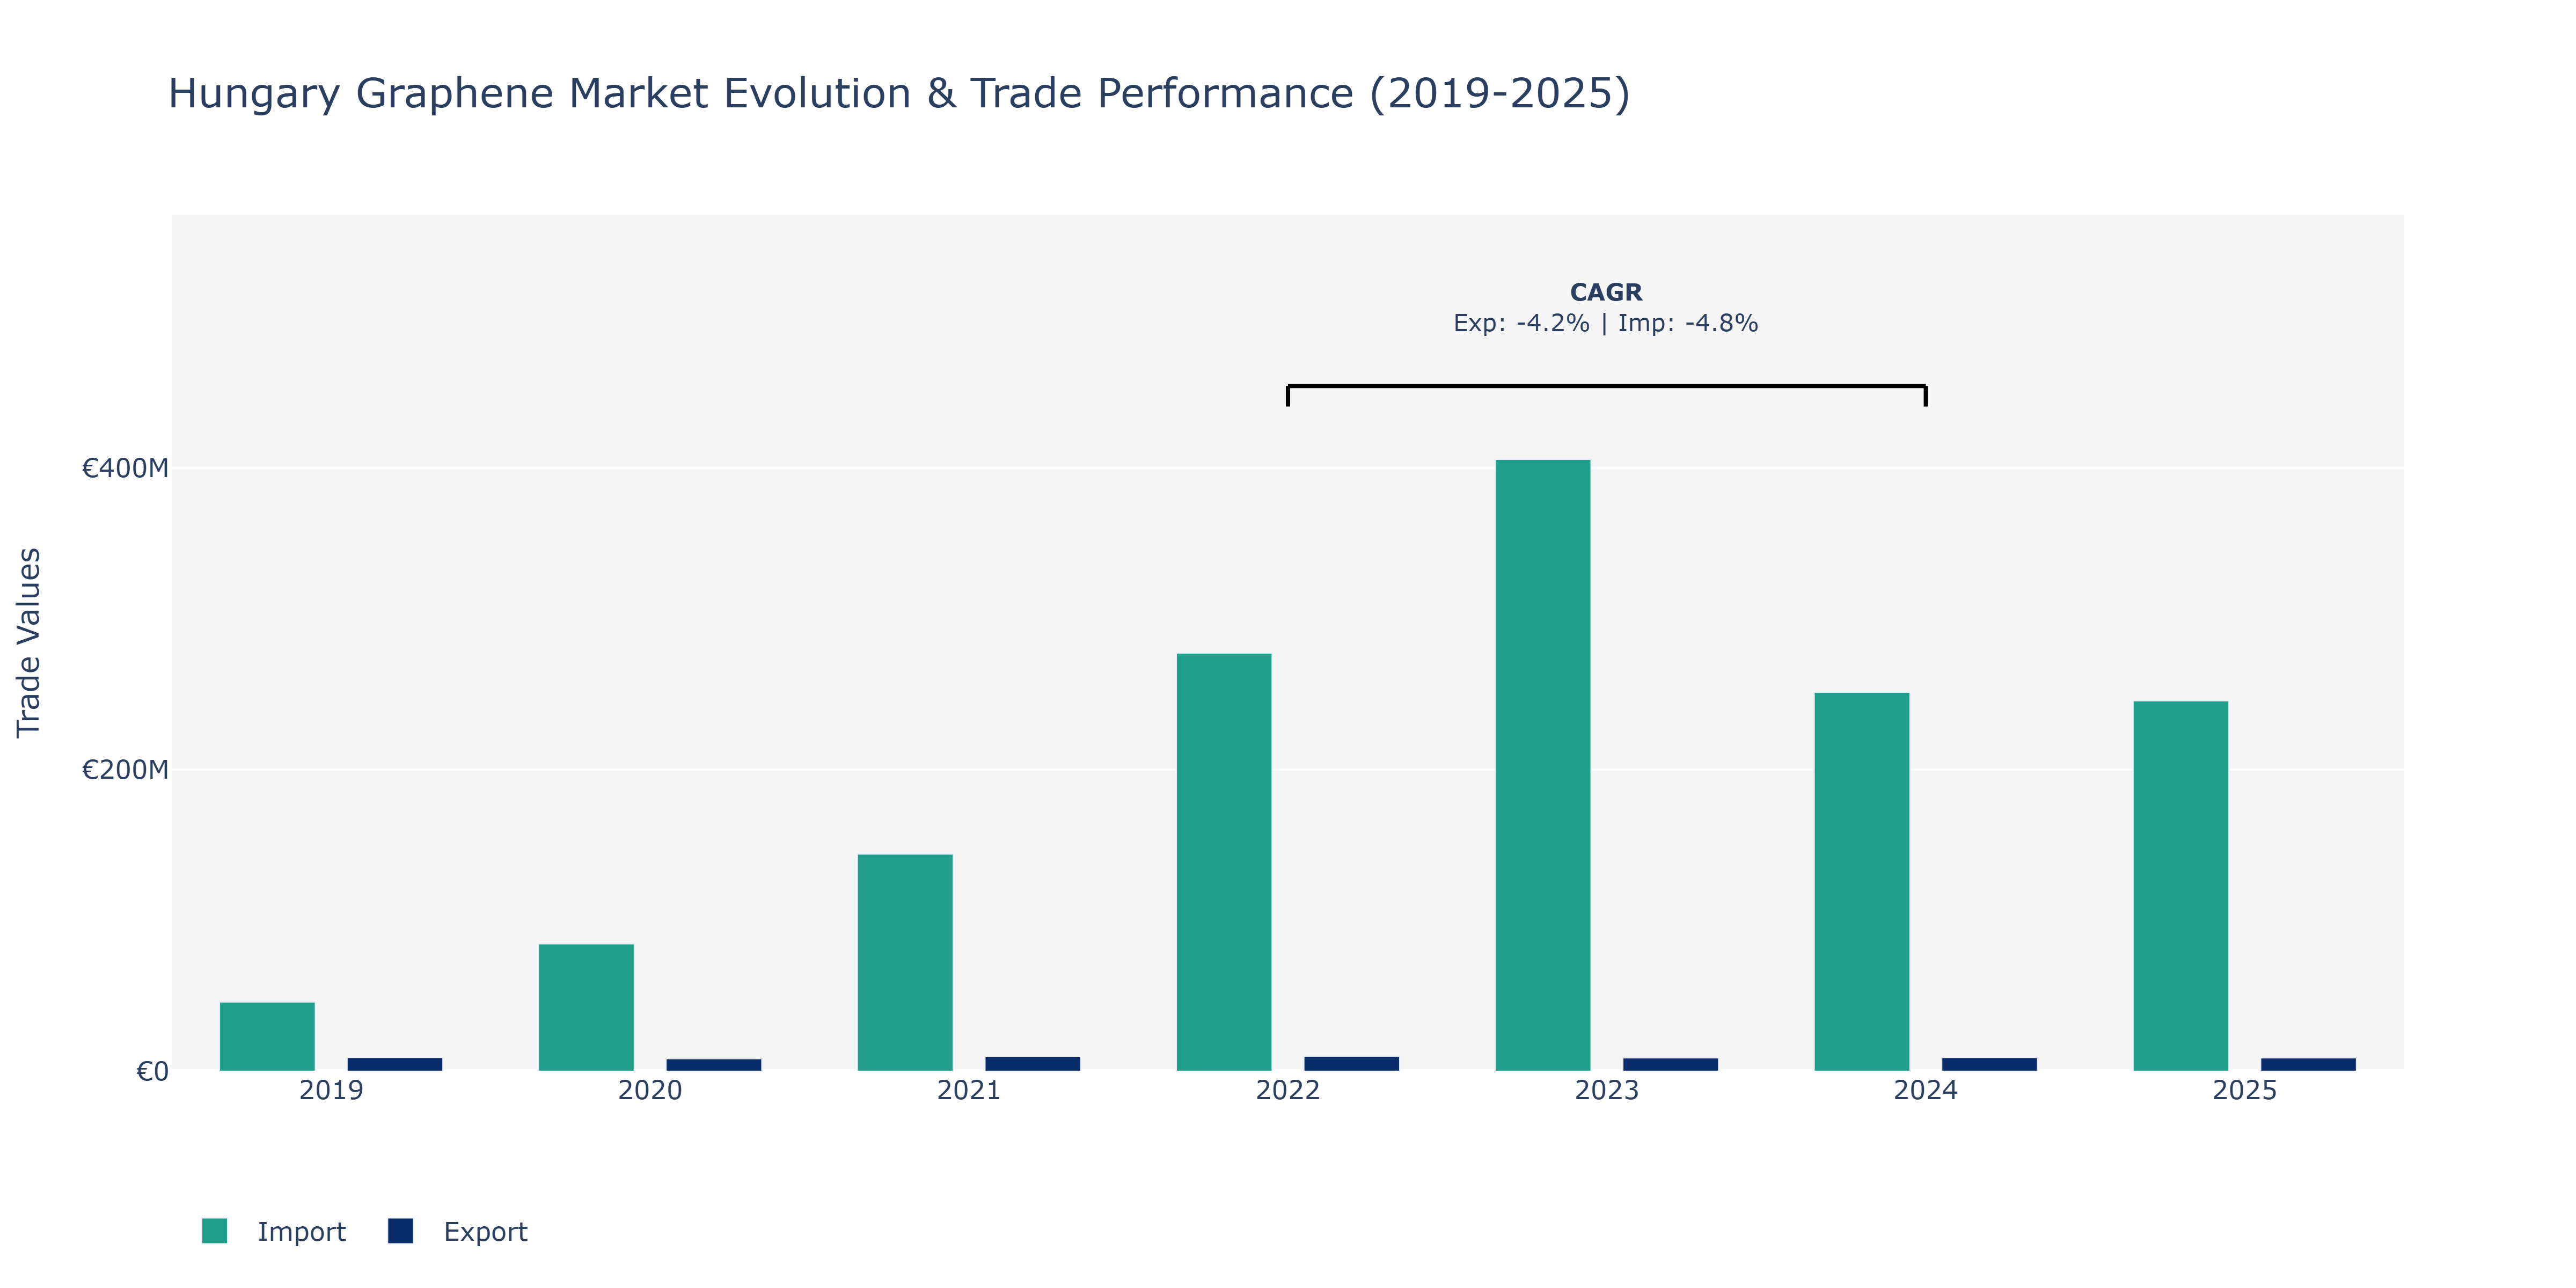
In the Hungary Graphene Market, exports experienced fluctuations over the years, starting at €9.01 million in 2019 and reaching a peak of €9.81 million in 2022 before slightly declining to €8.80 million in 2023 and then rebounding to €8.84 million in 2025. Conversely, imports showed a consistent upward trend, more than doubling from €45.78 million in 2019 to €143.95 million in 2021, and peaking at €405.73 million in 2023. Following this peak, imports decreased to €251.24 million in 2024 and further to €245.59 million in 2025. The rise in imports can be attributed to Hungary's increasing demand for graphene-related products and technologies for various industries, while export fluctuations may reflect global market dynamics and competition. The expanding applications of graphene in sectors such as electronics, automotive, and healthcare could have contributed to these trends, aligning with the global trend of graphene adoption in advanced technologies.
Key Highlights of the Report:
- Hungary Graphene Market Outlook
- Market Size of Hungary Graphene Market, 2025
- Forecast of Hungary Graphene Market, 2032
- Historical Data and Forecast of Hungary Graphene Revenues & Volume for the Period 2022-2032F
- Hungary Graphene Market Trend Evolution
- Hungary Graphene Market Drivers and Challenges
- Hungary Graphene Price Trends
- Hungary Graphene Porter's Five Forces
- Hungary Graphene Industry Life Cycle
- Historical Data and Forecast of Hungary Graphene Market Revenues & Volume By Type for the Period 2022-2032F
- Historical Data and Forecast of Hungary Graphene Market Revenues & Volume By Bulk Graphene for the Period 2022-2032F
- Historical Data and Forecast of Hungary Graphene Market Revenues & Volume By Monolayer Graphene for the Period 2022-2032F
- Historical Data and Forecast of Hungary Graphene Market Revenues & Volume By Application for the Period 2022-2032F
- Historical Data and Forecast of Hungary Graphene Market Revenues & Volume By Composites for the Period 2022-2032F
- Historical Data and Forecast of Hungary Graphene Market Revenues & Volume By Paints, Coatings, and Inks for the Period 2022-2032F
- Historical Data and Forecast of Hungary Graphene Market Revenues & Volume By Energy Storage & Harvesting for the Period 2022-2032F
- Historical Data and Forecast of Hungary Graphene Market Revenues & Volume By Electronics for the Period 2022-2032F
- Historical Data and Forecast of Hungary Graphene Market Revenues & Volume By Catalyst for the Period 2022-2032F
- Historical Data and Forecast of Hungary Graphene Market Revenues & Volume By Tires for the Period 2022-2032F
- Historical Data and Forecast of Hungary Graphene Market Revenues & Volume By Others for the Period 2022-2032F
- Historical Data and Forecast of Hungary Graphene Market Revenues & Volume By End-use Industry for the Period 2022-2032F
- Historical Data and Forecast of Hungary Graphene Market Revenues & Volume By Automotive & Transportation for the Period 2022-2032F
- Historical Data and Forecast of Hungary Graphene Market Revenues & Volume By Aerospace for the Period 2022-2032F
- Historical Data and Forecast of Hungary Graphene Market Revenues & Volume By Electronics for the Period 2022-2032F
- Historical Data and Forecast of Hungary Graphene Market Revenues & Volume By Military & Defense for the Period 2022-2032F
- Historical Data and Forecast of Hungary Graphene Market Revenues & Volume By Others for the Period 2022-2032F
- Hungary Graphene Import Export Trade Statistics
- Market Opportunity Assessment By Type
- Market Opportunity Assessment By Application
- Market Opportunity Assessment By End-use Industry
- Hungary Graphene Top Companies Market Share
- Hungary Graphene Competitive Benchmarking By Technical and Operational Parameters
- Hungary Graphene Company Profiles
- Hungary Graphene Key Strategic Recommendations
Frequently Asked Questions About the Market Study (FAQs):
6Wresearch actively monitors the Hungary Graphene Market and publishes its comprehensive annual report, highlighting emerging trends, growth drivers, revenue analysis, and forecast outlook. Our insights help businesses to make data-backed strategic decisions with ongoing market dynamics. Our analysts track relevent industries related to the Hungary Graphene Market, allowing our clients with actionable intelligence and reliable forecasts tailored to emerging regional needs.
Yes, we provide customisation as per your requirements. To learn more, feel free to contact us on sales@6wresearch.com
1 Executive Summary |
2 Introduction |
2.1 Key Highlights of the Report |
2.2 Report Description |
2.3 Market Scope & Segmentation |
2.4 Research Methodology |
2.5 Assumptions |
3 Hungary Graphene Market Overview |
3.1 Hungary Country Macro Economic Indicators |
3.2 Hungary Graphene Market Revenues & Volume, 2022 & 2032F |
3.3 Hungary Graphene Market - Industry Life Cycle |
3.4 Hungary Graphene Market - Porter's Five Forces |
3.5 Hungary Graphene Market Revenues & Volume Share, By Type, 2022 & 2032F |
3.6 Hungary Graphene Market Revenues & Volume Share, By Application, 2022 & 2032F |
3.7 Hungary Graphene Market Revenues & Volume Share, By End-use Industry, 2022 & 2032F |
4 Hungary Graphene Market Dynamics |
4.1 Impact Analysis |
4.2 Market Drivers |
4.2.1 Increasing demand for lightweight and strong materials in various industries |
4.2.2 Growing investments in research and development of graphene-based products |
4.2.3 Technological advancements leading to the development of new graphene applications |
4.3 Market Restraints |
4.3.1 High production costs associated with graphene manufacturing |
4.3.2 Lack of standardized manufacturing processes for consistent quality |
4.3.3 Limited awareness and understanding of graphene's potential among end-users |
5 Hungary Graphene Market Trends |
6 Hungary Graphene Market, By Types |
6.1 Hungary Graphene Market, By Type |
6.1.1 Overview and Analysis |
6.1.2 Hungary Graphene Market Revenues & Volume, By Type, 2022-2032F |
6.1.3 Hungary Graphene Market Revenues & Volume, By Bulk Graphene, 2022-2032F |
6.1.4 Hungary Graphene Market Revenues & Volume, By Monolayer Graphene, 2022-2032F |
6.2 Hungary Graphene Market, By Application |
6.2.1 Overview and Analysis |
6.2.2 Hungary Graphene Market Revenues & Volume, By Composites, 2022-2032F |
6.2.3 Hungary Graphene Market Revenues & Volume, By Paints, Coatings, and Inks, 2022-2032F |
6.2.4 Hungary Graphene Market Revenues & Volume, By Energy Storage & Harvesting, 2022-2032F |
6.2.5 Hungary Graphene Market Revenues & Volume, By Electronics, 2022-2032F |
6.2.6 Hungary Graphene Market Revenues & Volume, By Catalyst, 2022-2032F |
6.2.7 Hungary Graphene Market Revenues & Volume, By Tires, 2022-2032F |
6.3 Hungary Graphene Market, By End-use Industry |
6.3.1 Overview and Analysis |
6.3.2 Hungary Graphene Market Revenues & Volume, By Automotive & Transportation, 2022-2032F |
6.3.3 Hungary Graphene Market Revenues & Volume, By Aerospace, 2022-2032F |
6.3.4 Hungary Graphene Market Revenues & Volume, By Electronics, 2022-2032F |
6.3.5 Hungary Graphene Market Revenues & Volume, By Military & Defense, 2022-2032F |
6.3.6 Hungary Graphene Market Revenues & Volume, By Others, 2022-2032F |
7 Hungary Graphene Market Import-Export Trade Statistics |
7.1 Hungary Graphene Market Export to Major Countries |
7.2 Hungary Graphene Market Imports from Major Countries |
8 Hungary Graphene Market Key Performance Indicators |
8.1 Research and development investment in graphene technologies |
8.2 Number of patents filed for graphene-based innovations |
8.3 Adoption rate of graphene in key industries |
8.4 Percentage of companies incorporating graphene into their product offerings |
8.5 Number of collaborative projects between research institutions and industry players in Hungary. |
9 Hungary Graphene Market - Opportunity Assessment |
9.1 Hungary Graphene Market Opportunity Assessment, By Type, 2022 & 2032F |
9.2 Hungary Graphene Market Opportunity Assessment, By Application, 2022 & 2032F |
9.3 Hungary Graphene Market Opportunity Assessment, By End-use Industry, 2022 & 2032F |
10 Hungary Graphene Market - Competitive Landscape |
10.1 Hungary Graphene Market Revenue Share, By Companies, 2025 |
10.2 Hungary Graphene Market Competitive Benchmarking, By Operating and Technical Parameters |
11 Company Profiles |
12 Recommendations |
13 Disclaimer |
Global Go To Market Strategy - 2030
Export potential enables firms to identify high-growth global markets with greater confidence by combining advanced trade intelligence with a structured quantitative methodology. The framework analyzes emerging demand trends and country-level import patterns while integrating macroeconomic and trade datasets such as GDP and population forecasts, bilateral import–export flows, tariff structures, elasticity differentials between developed and developing economies, geographic distance, and import demand projections. Using weighted trade values from 2020–2024 as the base period to project country-to-country export potential for 2030, these inputs are operationalized through calculated drivers such as gravity model parameters, tariff impact factors, and projected GDP per-capita growth. Through an analysis of hidden potentials, demand hotspots, and market conditions that are most favorable to success, this method enables firms to focus on target countries, maximize returns, and global expansion with data, backed by accuracy.
By factoring in the projected importer demand gap that is currently unmet and could be potential opportunity, it identifies the potential for the Exporter (Country) among 190 countries, against the general trade analysis, which identifies the biggest importer or exporter.
To discover high-growth global markets and optimize your business strategy:
Click Here
Pricing
- Single User License$ 1,995
- Department License$ 2,400
- Site License$ 3,120
- Global License$ 3,795

Leadership Perspectives from Industry Events
Search
Thought Leadership and Analyst Meet


Our Clients
6WResearch In News
- Doha a strategic location for EV manufacturing hub: IPA Qatar
- Demand for luxury TVs surging in the GCC, says Samsung
- Empowering Growth: The Thriving Journey of Bangladesh’s Cable Industry
- Demand for luxury TVs surging in the GCC, says Samsung
- Video call with a traditional healer? Once unthinkable, it’s now common in South Africa
- Intelligent Buildings To Smooth GCC’s Path To Net Zero
Latest Reports
- Cape Verde Portable Hand-Thrown Extinguisher Market (2026-2032)
- Canada Portable Hand-Thrown Extinguisher Market (2026-2032)
- Cameroon Portable Hand-Thrown Extinguisher Market (2026-2032)
- Burundi Portable Hand-Thrown Extinguisher Market (2026-2032)
- Burkina Faso Portable Hand-Thrown Extinguisher Market (2026-2032)
- Bulgaria Portable Hand-Thrown Extinguisher Market (2026-2032)
- Brunei Portable Hand-Thrown Extinguisher Market (2026-2032)
- Botswana Portable Hand-Thrown Extinguisher Market (2026-2032)
- Bosnia and Herzegovina Portable Hand-Thrown Extinguisher Market (2026-2032)
- Bolivia Portable Hand-Thrown Extinguisher Market (2026-2032)
Industry Events and Analyst Meet

HIMTEX 2026

India Refining Summit 2026

India EV Show 2026

EV tech India Expo 2026

Auto Tech Asia 2026
Whitepaper
- Middle East & Africa Commercial Security Market Click here to view more.
- Middle East & Africa Fire Safety Systems & Equipment Market Click here to view more.
- GCC Drone Market Click here to view more.
- Middle East Lighting Fixture Market Click here to view more.
- GCC Physical & Perimeter Security Market Click here to view more.