Hungary Motorcycle Drive Chain Market (2026-2032) | Share, Value, Companies, Competitive Landscape, Outlook, Growth, Forecast, Size & Revenue, Industry, Trends, Analysis, Segmentation
Market Forecast By Types (Standard, Cruiser, Sports, Off-Road), By Chain type (Standard Rolling Chain, O Ring Chain, X Ring Chain), By Engine Capacity (Up to 150 CC, 151-300 CC, 301-500 CC, Above 500 CC), By Material Type (Mild Steel, Cast Steel, Cast Iron), By Distribution Channel (Online, Offline) And Competitive Landscape
| Product Code: ETC7505046 | Publication Date: Sep 2024 | Updated Date: Apr 2026 | Product Type: Market Research Report | |
| Publisher: 6Wresearch | Author: Dhaval Chaurasia | No. of Pages: 75 | No. of Figures: 35 | No. of Tables: 20 |
Hungary Motorcycle Drive Chain Market Size (2020-2030)
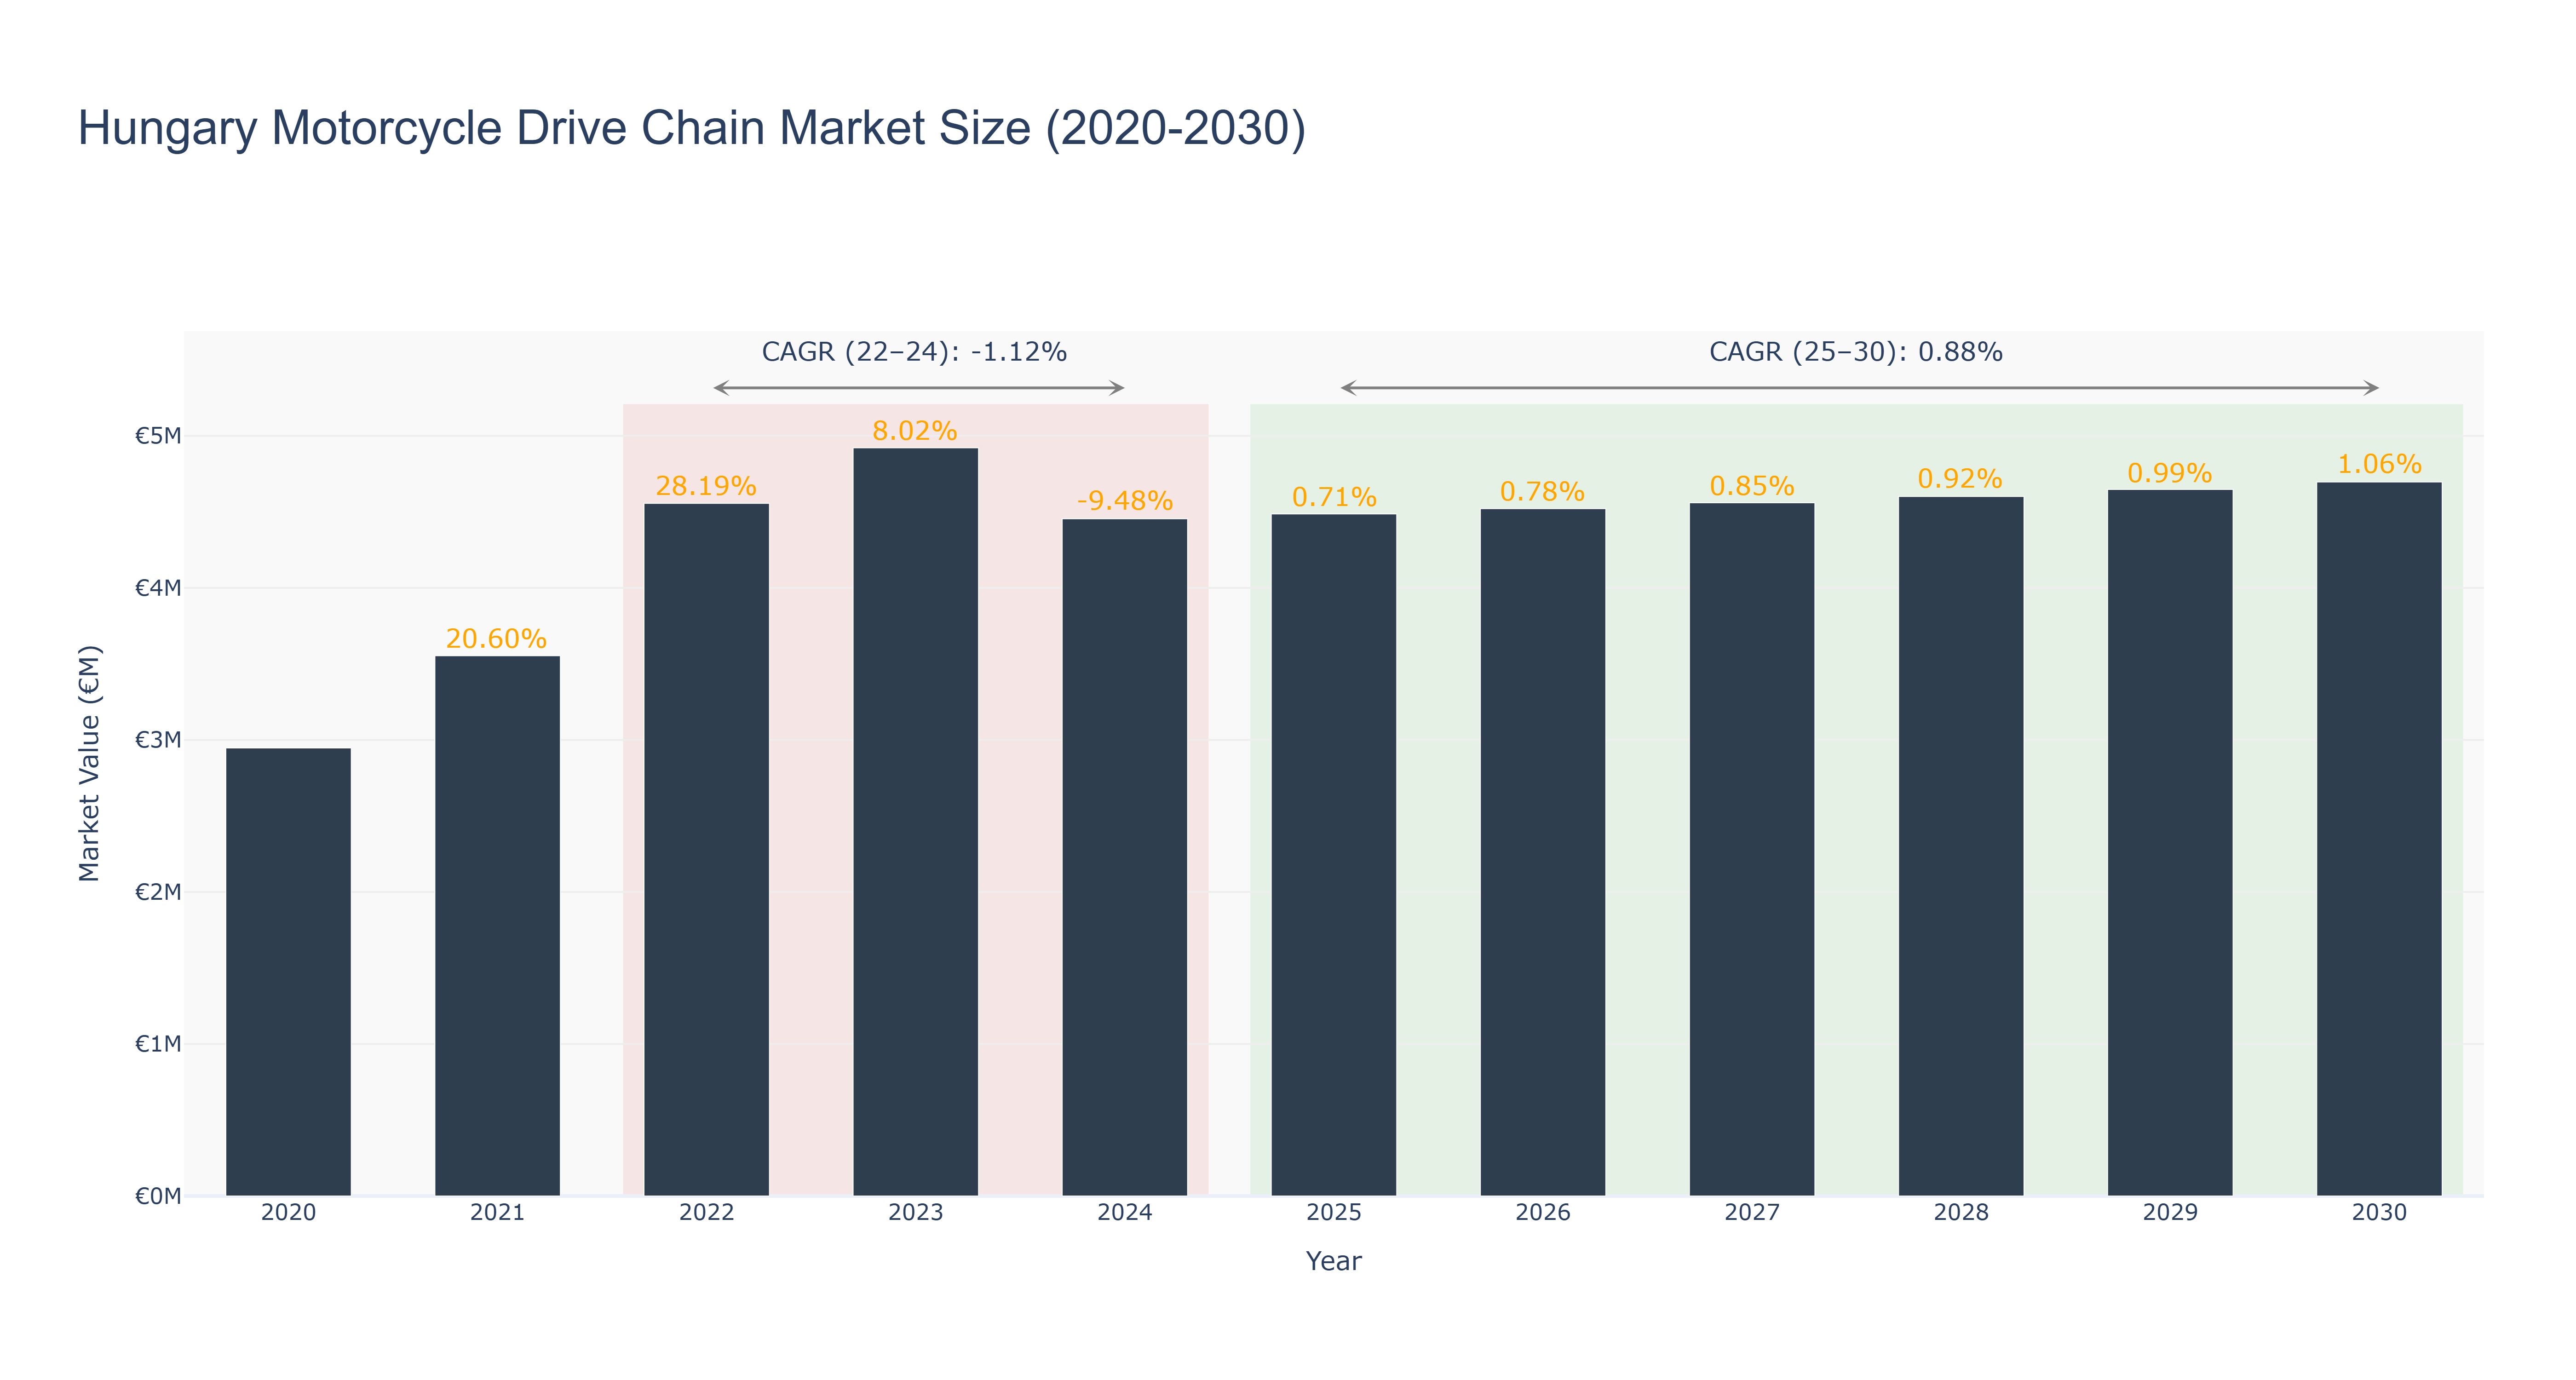
Hungary Motorcycle Drive Chain Market has shown a fluctuating trend over the years. The peak market size of €4.92 million was recorded in 2023, while the actual market size decreased to €4.45 million in 2024. Forecasted growth indicates a steady increase, reaching €4.70 million by 2030. The CAGR for 2022-24 was -1.12%, reflecting a slight decline, followed by a positive CAGR of 0.88% for 2025-30. The market experienced a downturn in 2024 due to economic uncertainties, but is projected to recover and grow steadily driven by increasing demand for motorcycles and drive chains. Recent developments include collaborations with leading motorcycle manufacturers to enhance product quality and expand market reach. Future plans involve investing in advanced technology for improved efficiency and sustainability in production processes.
Hungary Motorcycle Drive Chain Market: Production & Trade Performance (2019-2025)
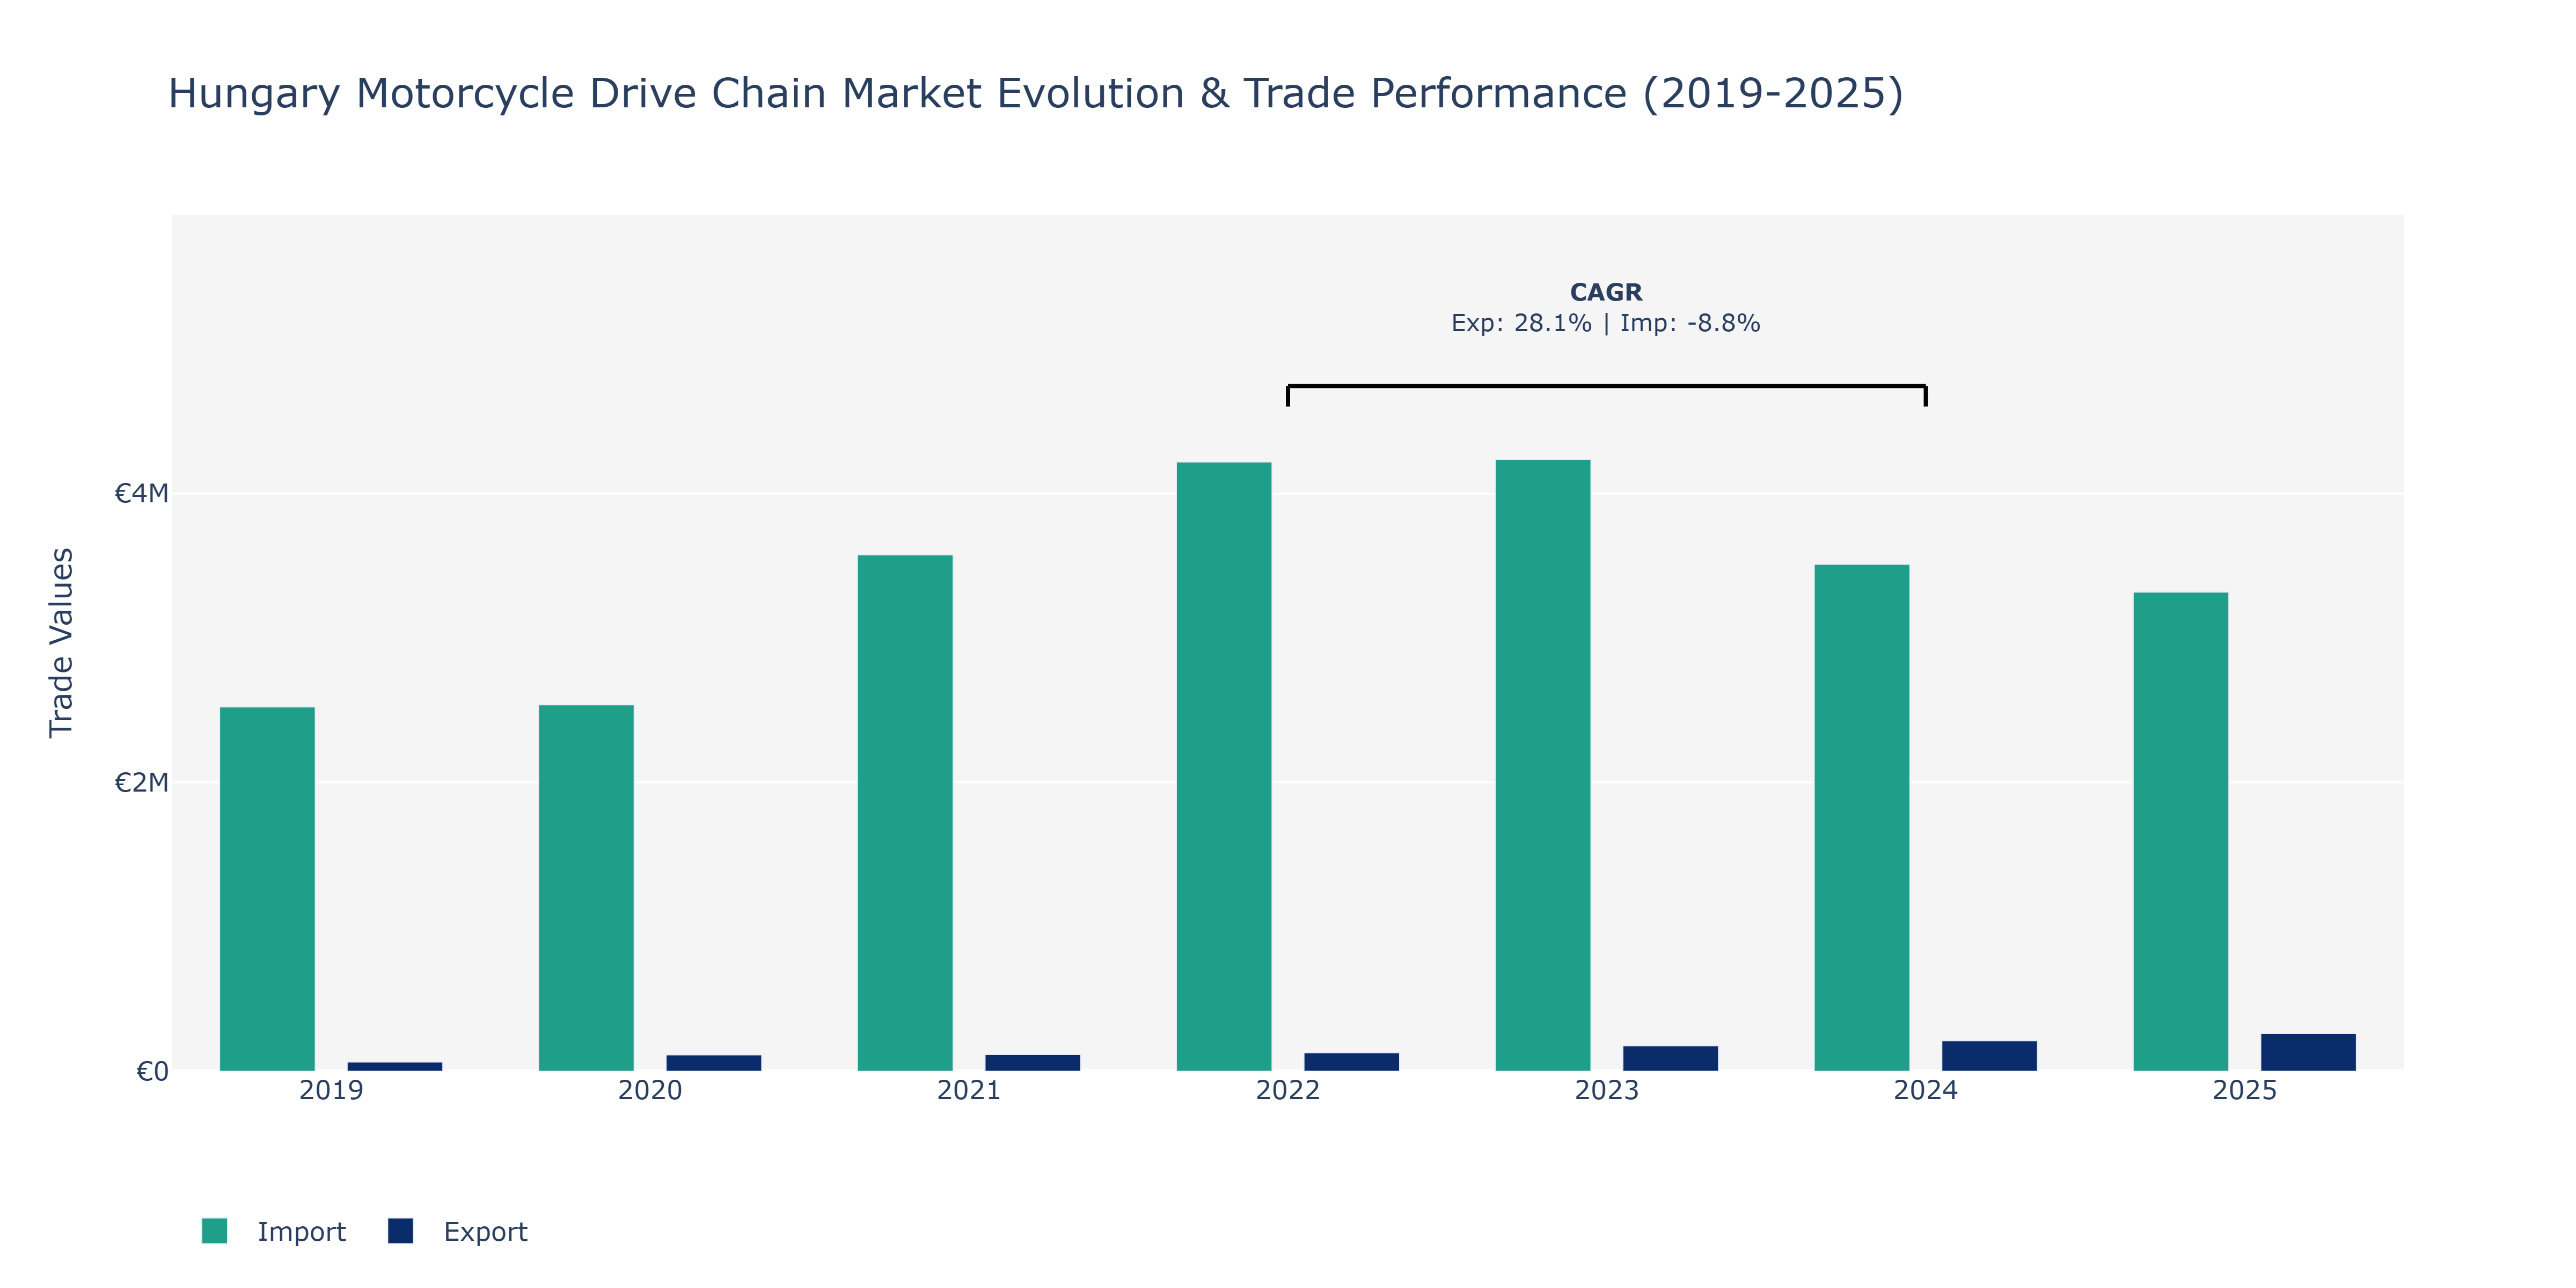
Between 2019 and 2025, Hungary's Motorcycle Drive Chain Market witnessed fluctuations in both Exports and Imports. Exports started at €64.04 thousand in 2019, steadily increasing each year to reach a peak of over €260.14 thousand in 2025. On the other hand, Imports began at €2.52 million in 2019, fluctuating over the years with a notable decline in 2024 to €3.51 million before slightly decreasing further in 2025. The rise in exports can be attributed to Hungary's growing reputation for producing high-quality motorcycle drive chains, leading to increased international demand. Conversely, the fluctuating Import value could be a result of changing global market dynamics, including shifts in supply chain strategies and variations in domestic manufacturing capabilities. These trends highlight the market's responsiveness to both local and global factors, emphasizing the need for market players to adapt to dynamic industry conditions to maintain competitiveness.
Key Highlights of the Report:
- Hungary Motorcycle Drive Chain Market Outlook
- Market Size of Hungary Motorcycle Drive Chain Market, 2025
- Forecast of Hungary Motorcycle Drive Chain Market, 2032
- Historical Data and Forecast of Hungary Motorcycle Drive Chain Revenues & Volume for the Period 2022-2032F
- Hungary Motorcycle Drive Chain Market Trend Evolution
- Hungary Motorcycle Drive Chain Market Drivers and Challenges
- Hungary Motorcycle Drive Chain Price Trends
- Hungary Motorcycle Drive Chain Porter's Five Forces
- Hungary Motorcycle Drive Chain Industry Life Cycle
- Historical Data and Forecast of Hungary Motorcycle Drive Chain Market Revenues & Volume By Types for the Period 2022-2032F
- Historical Data and Forecast of Hungary Motorcycle Drive Chain Market Revenues & Volume By Standard for the Period 2022-2032F
- Historical Data and Forecast of Hungary Motorcycle Drive Chain Market Revenues & Volume By Cruiser for the Period 2022-2032F
- Historical Data and Forecast of Hungary Motorcycle Drive Chain Market Revenues & Volume By Sports for the Period 2022-2032F
- Historical Data and Forecast of Hungary Motorcycle Drive Chain Market Revenues & Volume By Off-Road for the Period 2022-2032F
- Historical Data and Forecast of Hungary Motorcycle Drive Chain Market Revenues & Volume By Chain type for the Period 2022-2032F
- Historical Data and Forecast of Hungary Motorcycle Drive Chain Market Revenues & Volume By Standard Rolling Chain for the Period 2022-2032F
- Historical Data and Forecast of Hungary Motorcycle Drive Chain Market Revenues & Volume By O Ring Chain for the Period 2022-2032F
- Historical Data and Forecast of Hungary Motorcycle Drive Chain Market Revenues & Volume By X Ring Chain for the Period 2022-2032F
- Historical Data and Forecast of Hungary Motorcycle Drive Chain Market Revenues & Volume By Engine Capacity for the Period 2022-2032F
- Historical Data and Forecast of Hungary Motorcycle Drive Chain Market Revenues & Volume By Up to 150 CC for the Period 2022-2032F
- Historical Data and Forecast of Hungary Motorcycle Drive Chain Market Revenues & Volume By 151-300 CC for the Period 2022-2032F
- Historical Data and Forecast of Hungary Motorcycle Drive Chain Market Revenues & Volume By 301-500 CC for the Period 2022-2032F
- Historical Data and Forecast of Hungary Motorcycle Drive Chain Market Revenues & Volume By Above 500 CC for the Period 2022-2032F
- Historical Data and Forecast of Hungary Motorcycle Drive Chain Market Revenues & Volume By Material Type for the Period 2022-2032F
- Historical Data and Forecast of Hungary Motorcycle Drive Chain Market Revenues & Volume By Mild Steel for the Period 2022-2032F
- Historical Data and Forecast of Hungary Motorcycle Drive Chain Market Revenues & Volume By Cast Steel for the Period 2022-2032F
- Historical Data and Forecast of Hungary Motorcycle Drive Chain Market Revenues & Volume By Cast Iron for the Period 2022-2032F
- Historical Data and Forecast of Hungary Motorcycle Drive Chain Market Revenues & Volume By Distribution Channel for the Period 2022-2032F
- Historical Data and Forecast of Hungary Motorcycle Drive Chain Market Revenues & Volume By Online for the Period 2022-2032F
- Historical Data and Forecast of Hungary Motorcycle Drive Chain Market Revenues & Volume By Offline for the Period 2022-2032F
- Hungary Motorcycle Drive Chain Import Export Trade Statistics
- Market Opportunity Assessment By Types
- Market Opportunity Assessment By Chain type
- Market Opportunity Assessment By Engine Capacity
- Market Opportunity Assessment By Material Type
- Market Opportunity Assessment By Distribution Channel
- Hungary Motorcycle Drive Chain Top Companies Market Share
- Hungary Motorcycle Drive Chain Competitive Benchmarking By Technical and Operational Parameters
- Hungary Motorcycle Drive Chain Company Profiles
- Hungary Motorcycle Drive Chain Key Strategic Recommendations
Frequently Asked Questions About the Market Study (FAQs):
6Wresearch actively monitors the Hungary Motorcycle Drive Chain Market and publishes its comprehensive annual report, highlighting emerging trends, growth drivers, revenue analysis, and forecast outlook. Our insights help businesses to make data-backed strategic decisions with ongoing market dynamics. Our analysts track relevent industries related to the Hungary Motorcycle Drive Chain Market, allowing our clients with actionable intelligence and reliable forecasts tailored to emerging regional needs.
Yes, we provide customisation as per your requirements. To learn more, feel free to contact us on sales@6wresearch.com
1 Executive Summary |
2 Introduction |
2.1 Key Highlights of the Report |
2.2 Report Description |
2.3 Market Scope & Segmentation |
2.4 Research Methodology |
2.5 Assumptions |
3 Hungary Motorcycle Drive Chain Market Overview |
3.1 Hungary Country Macro Economic Indicators |
3.2 Hungary Motorcycle Drive Chain Market Revenues & Volume, 2022 & 2032F |
3.3 Hungary Motorcycle Drive Chain Market - Industry Life Cycle |
3.4 Hungary Motorcycle Drive Chain Market - Porter's Five Forces |
3.5 Hungary Motorcycle Drive Chain Market Revenues & Volume Share, By Types, 2022 & 2032F |
3.6 Hungary Motorcycle Drive Chain Market Revenues & Volume Share, By Chain type, 2022 & 2032F |
3.7 Hungary Motorcycle Drive Chain Market Revenues & Volume Share, By Engine Capacity, 2022 & 2032F |
3.8 Hungary Motorcycle Drive Chain Market Revenues & Volume Share, By Material Type, 2022 & 2032F |
3.9 Hungary Motorcycle Drive Chain Market Revenues & Volume Share, By Distribution Channel, 2022 & 2032F |
4 Hungary Motorcycle Drive Chain Market Dynamics |
4.1 Impact Analysis |
4.2 Market Drivers |
4.2.1 Increasing demand for motorcycles in Hungary |
4.2.2 Growth in the tourism sector leading to higher motorcycle rentals |
4.2.3 Technological advancements in drive chain materials and manufacturing processes |
4.3 Market Restraints |
4.3.1 Economic downturn impacting disposable income for motorcycle purchases |
4.3.2 Fluctuating raw material prices affecting production costs |
4.3.3 Stringent government regulations on emissions and noise levels for motorcycles |
5 Hungary Motorcycle Drive Chain Market Trends |
6 Hungary Motorcycle Drive Chain Market, By Types |
6.1 Hungary Motorcycle Drive Chain Market, By Types |
6.1.1 Overview and Analysis |
6.1.2 Hungary Motorcycle Drive Chain Market Revenues & Volume, By Types, 2022-2032F |
6.1.3 Hungary Motorcycle Drive Chain Market Revenues & Volume, By Standard, 2022-2032F |
6.1.4 Hungary Motorcycle Drive Chain Market Revenues & Volume, By Cruiser, 2022-2032F |
6.1.5 Hungary Motorcycle Drive Chain Market Revenues & Volume, By Sports, 2022-2032F |
6.1.6 Hungary Motorcycle Drive Chain Market Revenues & Volume, By Off-Road, 2022-2032F |
6.2 Hungary Motorcycle Drive Chain Market, By Chain type |
6.2.1 Overview and Analysis |
6.2.2 Hungary Motorcycle Drive Chain Market Revenues & Volume, By Standard Rolling Chain, 2022-2032F |
6.2.3 Hungary Motorcycle Drive Chain Market Revenues & Volume, By O Ring Chain, 2022-2032F |
6.2.4 Hungary Motorcycle Drive Chain Market Revenues & Volume, By X Ring Chain, 2022-2032F |
6.3 Hungary Motorcycle Drive Chain Market, By Engine Capacity |
6.3.1 Overview and Analysis |
6.3.2 Hungary Motorcycle Drive Chain Market Revenues & Volume, By Up to 150 CC, 2022-2032F |
6.3.3 Hungary Motorcycle Drive Chain Market Revenues & Volume, By 151-300 CC, 2022-2032F |
6.3.4 Hungary Motorcycle Drive Chain Market Revenues & Volume, By 301-500 CC, 2022-2032F |
6.3.5 Hungary Motorcycle Drive Chain Market Revenues & Volume, By Above 500 CC, 2022-2032F |
6.4 Hungary Motorcycle Drive Chain Market, By Material Type |
6.4.1 Overview and Analysis |
6.4.2 Hungary Motorcycle Drive Chain Market Revenues & Volume, By Mild Steel, 2022-2032F |
6.4.3 Hungary Motorcycle Drive Chain Market Revenues & Volume, By Cast Steel, 2022-2032F |
6.4.4 Hungary Motorcycle Drive Chain Market Revenues & Volume, By Cast Iron, 2022-2032F |
6.5 Hungary Motorcycle Drive Chain Market, By Distribution Channel |
6.5.1 Overview and Analysis |
6.5.2 Hungary Motorcycle Drive Chain Market Revenues & Volume, By Online, 2022-2032F |
6.5.3 Hungary Motorcycle Drive Chain Market Revenues & Volume, By Offline, 2022-2032F |
7 Hungary Motorcycle Drive Chain Market Import-Export Trade Statistics |
7.1 Hungary Motorcycle Drive Chain Market Export to Major Countries |
7.2 Hungary Motorcycle Drive Chain Market Imports from Major Countries |
8 Hungary Motorcycle Drive Chain Market Key Performance Indicators |
8.1 Average age of motorcycles in Hungary |
8.2 Number of motorcycle registrations |
8.3 Adoption rate of maintenance-free drive chains |
8.4 Percentage of motorcycles using eco-friendly drive chain materials |
8.5 Number of motorcycle rental businesses in Hungary |
9 Hungary Motorcycle Drive Chain Market - Opportunity Assessment |
9.1 Hungary Motorcycle Drive Chain Market Opportunity Assessment, By Types, 2022 & 2032F |
9.2 Hungary Motorcycle Drive Chain Market Opportunity Assessment, By Chain type, 2022 & 2032F |
9.3 Hungary Motorcycle Drive Chain Market Opportunity Assessment, By Engine Capacity, 2022 & 2032F |
9.4 Hungary Motorcycle Drive Chain Market Opportunity Assessment, By Material Type, 2022 & 2032F |
9.5 Hungary Motorcycle Drive Chain Market Opportunity Assessment, By Distribution Channel, 2022 & 2032F |
10 Hungary Motorcycle Drive Chain Market - Competitive Landscape |
10.1 Hungary Motorcycle Drive Chain Market Revenue Share, By Companies, 2025 |
10.2 Hungary Motorcycle Drive Chain Market Competitive Benchmarking, By Operating and Technical Parameters |
11 Company Profiles |
12 Recommendations |
13 Disclaimer |
Export potential assessment - trade Analytics for 2030
Export potential enables firms to identify high-growth global markets with greater confidence by combining advanced trade intelligence with a structured quantitative methodology. The framework analyzes emerging demand trends and country-level import patterns while integrating macroeconomic and trade datasets such as GDP and population forecasts, bilateral import–export flows, tariff structures, elasticity differentials between developed and developing economies, geographic distance, and import demand projections. Using weighted trade values from 2020–2024 as the base period to project country-to-country export potential for 2030, these inputs are operationalized through calculated drivers such as gravity model parameters, tariff impact factors, and projected GDP per-capita growth. Through an analysis of hidden potentials, demand hotspots, and market conditions that are most favorable to success, this method enables firms to focus on target countries, maximize returns, and global expansion with data, backed by accuracy.
By factoring in the projected importer demand gap that is currently unmet and could be potential opportunity, it identifies the potential for the Exporter (Country) among 190 countries, against the general trade analysis, which identifies the biggest importer or exporter.
To discover high-growth global markets and optimize your business strategy:
Click Here
Pricing
- Single User License$ 1,995
- Department License$ 2,400
- Site License$ 3,120
- Global License$ 3,795

Search
Thought Leadership and Analyst Meet


Our Clients
Latest Reports
- Canada Cloud CFD Market (2026-2032) | Size & Revenue, Industry, Growth, Competitive Landscape, Forecast, Segmentation, Value, Outlook, Trends, Share, Analysis, Companies
- Taiwan Food Delivery Platform Market (2026-2032) | Companies, Outlook, Analysis, Trends, Value, Revenue, Segmentation, Share, Forecast, Competitive Landscape, Growth, Size & Forecast
- United Kingdom (UK) Long-term Care Insurance Market (2026-2032) | Growth, Share, Consumer Insights, Drivers, Opportunities, Competition, Pricing Analysis, Segments, Restraints, Companies, Competitive, Value, Outlook, Size, Demand, Analysis, Challenges, Strategic Insights, Investment Trends, Revenue, Trends, Supply, Forecast
- United Kingdom (UK) Long Term Care Market (2026-2032) | Companies, Outlook, Analysis, Trends, Value, Revenue, Segmentation, Share, Forecast, Competitive Landscape, Growth, Size & Forecast
- Iraq Insulation and Waterproofing Market (2026-2032) | Outlook, Drivers, Growth, Size, Share, Industry, Revenue, Trends, Demand, Competitive, Strategic Insights, Opportunities, Segments, Companies, Challenges, Strategy, Consumer Insights, Analysis, Investment Trends, Value, Segmentation, Forecast, Restraints
- India Switchgear Market Outlook (2026-2032) | Size, Share, Trends, Growth, Revenue, Forecast, Analysis, Value, Outlook
- Pakistan Contraceptive Implants Market (2025-2031) | Demand, Growth, Size, Share, Industry, Pricing Analysis, Competitive, Strategic Insights, Strategy, Consumer Insights, Analysis, Investment Trends, Opportunities, Revenue, Segments, Value, Segmentation, Supply, Forecast, Restraints, Outlook, Competition, Drivers, Trends, Companies, Challenges
- Sri Lanka Packaging Market (2026-2032) | Outlook, Competition, Drivers, Trends, Demand, Pricing Analysis, Competitive, Strategic Insights, Companies, Challenges, Strategy, Consumer Insights, Analysis, Investment Trends, Opportunities, Growth, Size, Share, Industry, Revenue, Segments, Value, Segmentation, Supply, Forecast, Restraints
- India Kids Watches Market (2026-2032) | Strategy, Consumer Insights, Analysis, Investment Trends, Opportunities, Growth, Size, Share, Industry, Revenue, Segments, Value, Segmentation, Supply, Forecast, Restraints, Outlook, Competition, Drivers, Trends, Demand, Pricing Analysis, Competitive, Strategic Insights, Companies, Challenges
- Saudi Arabia Core Assurance Service Market (2025-2031) | Strategy, Consumer Insights, Analysis, Investment Trends, Opportunities, Growth, Size, Share, Industry, Revenue, Segments, Value, Segmentation, Supply, Forecast, Restraints, Outlook, Competition, Drivers, Trends, Demand, Pricing Analysis, Competitive, Strategic Insights, Companies, Challenges
Industry Events and Analyst Meet

India EV Show 2026

EV tech India Expo 2026

Auto Tech Asia 2026

Battery Tech India 2026

Smart Production Solutions Guangzhou 2026
Whitepaper
- Middle East & Africa Commercial Security Market Click here to view more.
- Middle East & Africa Fire Safety Systems & Equipment Market Click here to view more.
- GCC Drone Market Click here to view more.
- Middle East Lighting Fixture Market Click here to view more.
- GCC Physical & Perimeter Security Market Click here to view more.
6WResearch In News
- Doha a strategic location for EV manufacturing hub: IPA Qatar
- Demand for luxury TVs surging in the GCC, says Samsung
- Empowering Growth: The Thriving Journey of Bangladesh’s Cable Industry
- Demand for luxury TVs surging in the GCC, says Samsung
- Video call with a traditional healer? Once unthinkable, it’s now common in South Africa
- Intelligent Buildings To Smooth GCC’s Path To Net Zero