Hungary Paperboard Jar Market (2026-2032) | Trends, Share, Forecast, Value, Industry, Outlook, Analysis, Growth, Segmentation, Companies, Competitive Landscape, Size & Revenue
Market Forecast By Neck Diameter (Up to 50 mm, 51 mm 100 mm, 101 mm & Above), By Closure Type (Caps, Snap-on, Plug, Lids, Metal, Plastic, Paperboard Ends), By End Use (Personal Care & Cosmetics, Coffee and Tea, Food & Beverages, Snacks & Confectionery, Industrial Goods, Consumer Goods, Others) And Competitive Landscape
| Product Code: ETC7507024 | Publication Date: Sep 2024 | Updated Date: Apr 2026 | Product Type: Market Research Report | |
| Publisher: 6Wresearch | Author: Summon Dutta | No. of Pages: 75 | No. of Figures: 35 | No. of Tables: 20 |
Hungary Paperboard Jar Market Size (2020-2030)
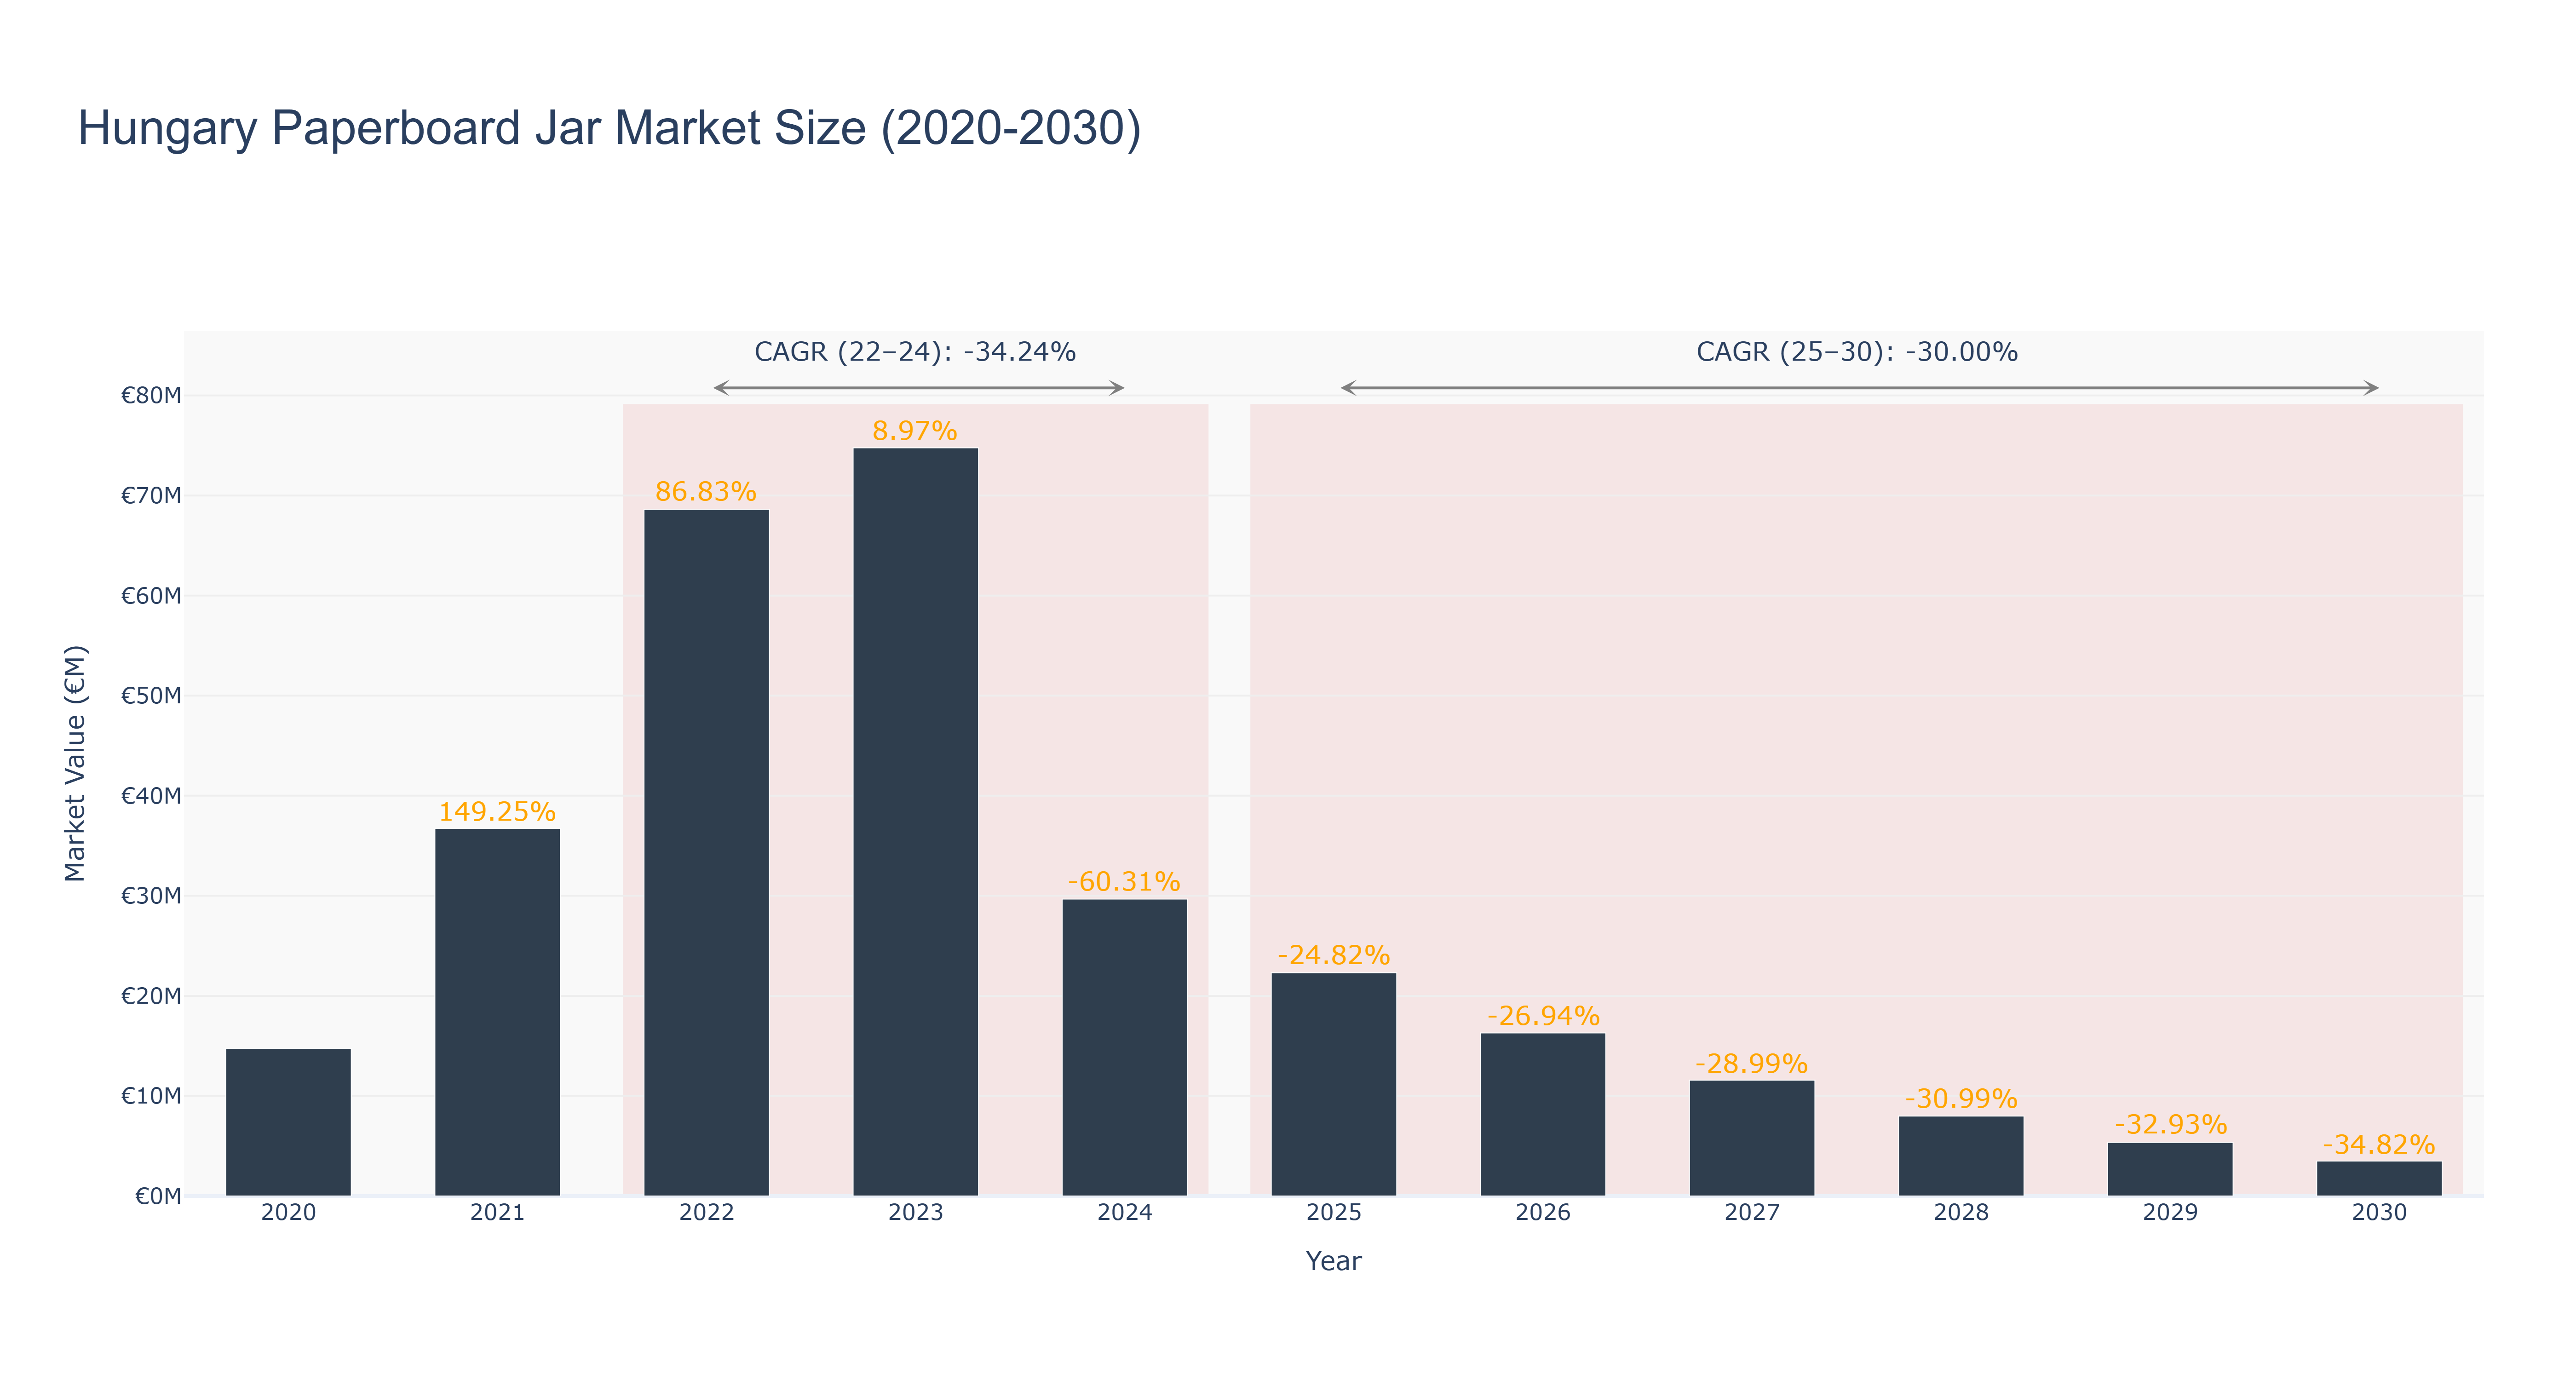
Hungary Paperboard Jar Market has seen a fluctuating trend in recent years. The peak market size was €74.77 million in 2023, followed by a sharp decline to €29.67 million in 2024. Forecasted market sizes indicate a continued decrease, reaching €3.49 million in 2030. The CAGR for the period 2022-24 was -34.24%, while for 2025-30 it is projected at -30.0%. The market faced challenges due to changing consumer preferences towards eco-friendly packaging solutions and increased competition from alternative materials. Looking ahead, Hungary is set to introduce new sustainability initiatives in the packaging industry to align with EU regulations, promoting the use of recyclable materials and reducing environmental impact. These developments are expected to drive innovation and reshape the market landscape in the coming years.
Hungary Paperboard Jar Market: Production & Trade Performance (2019-2025)
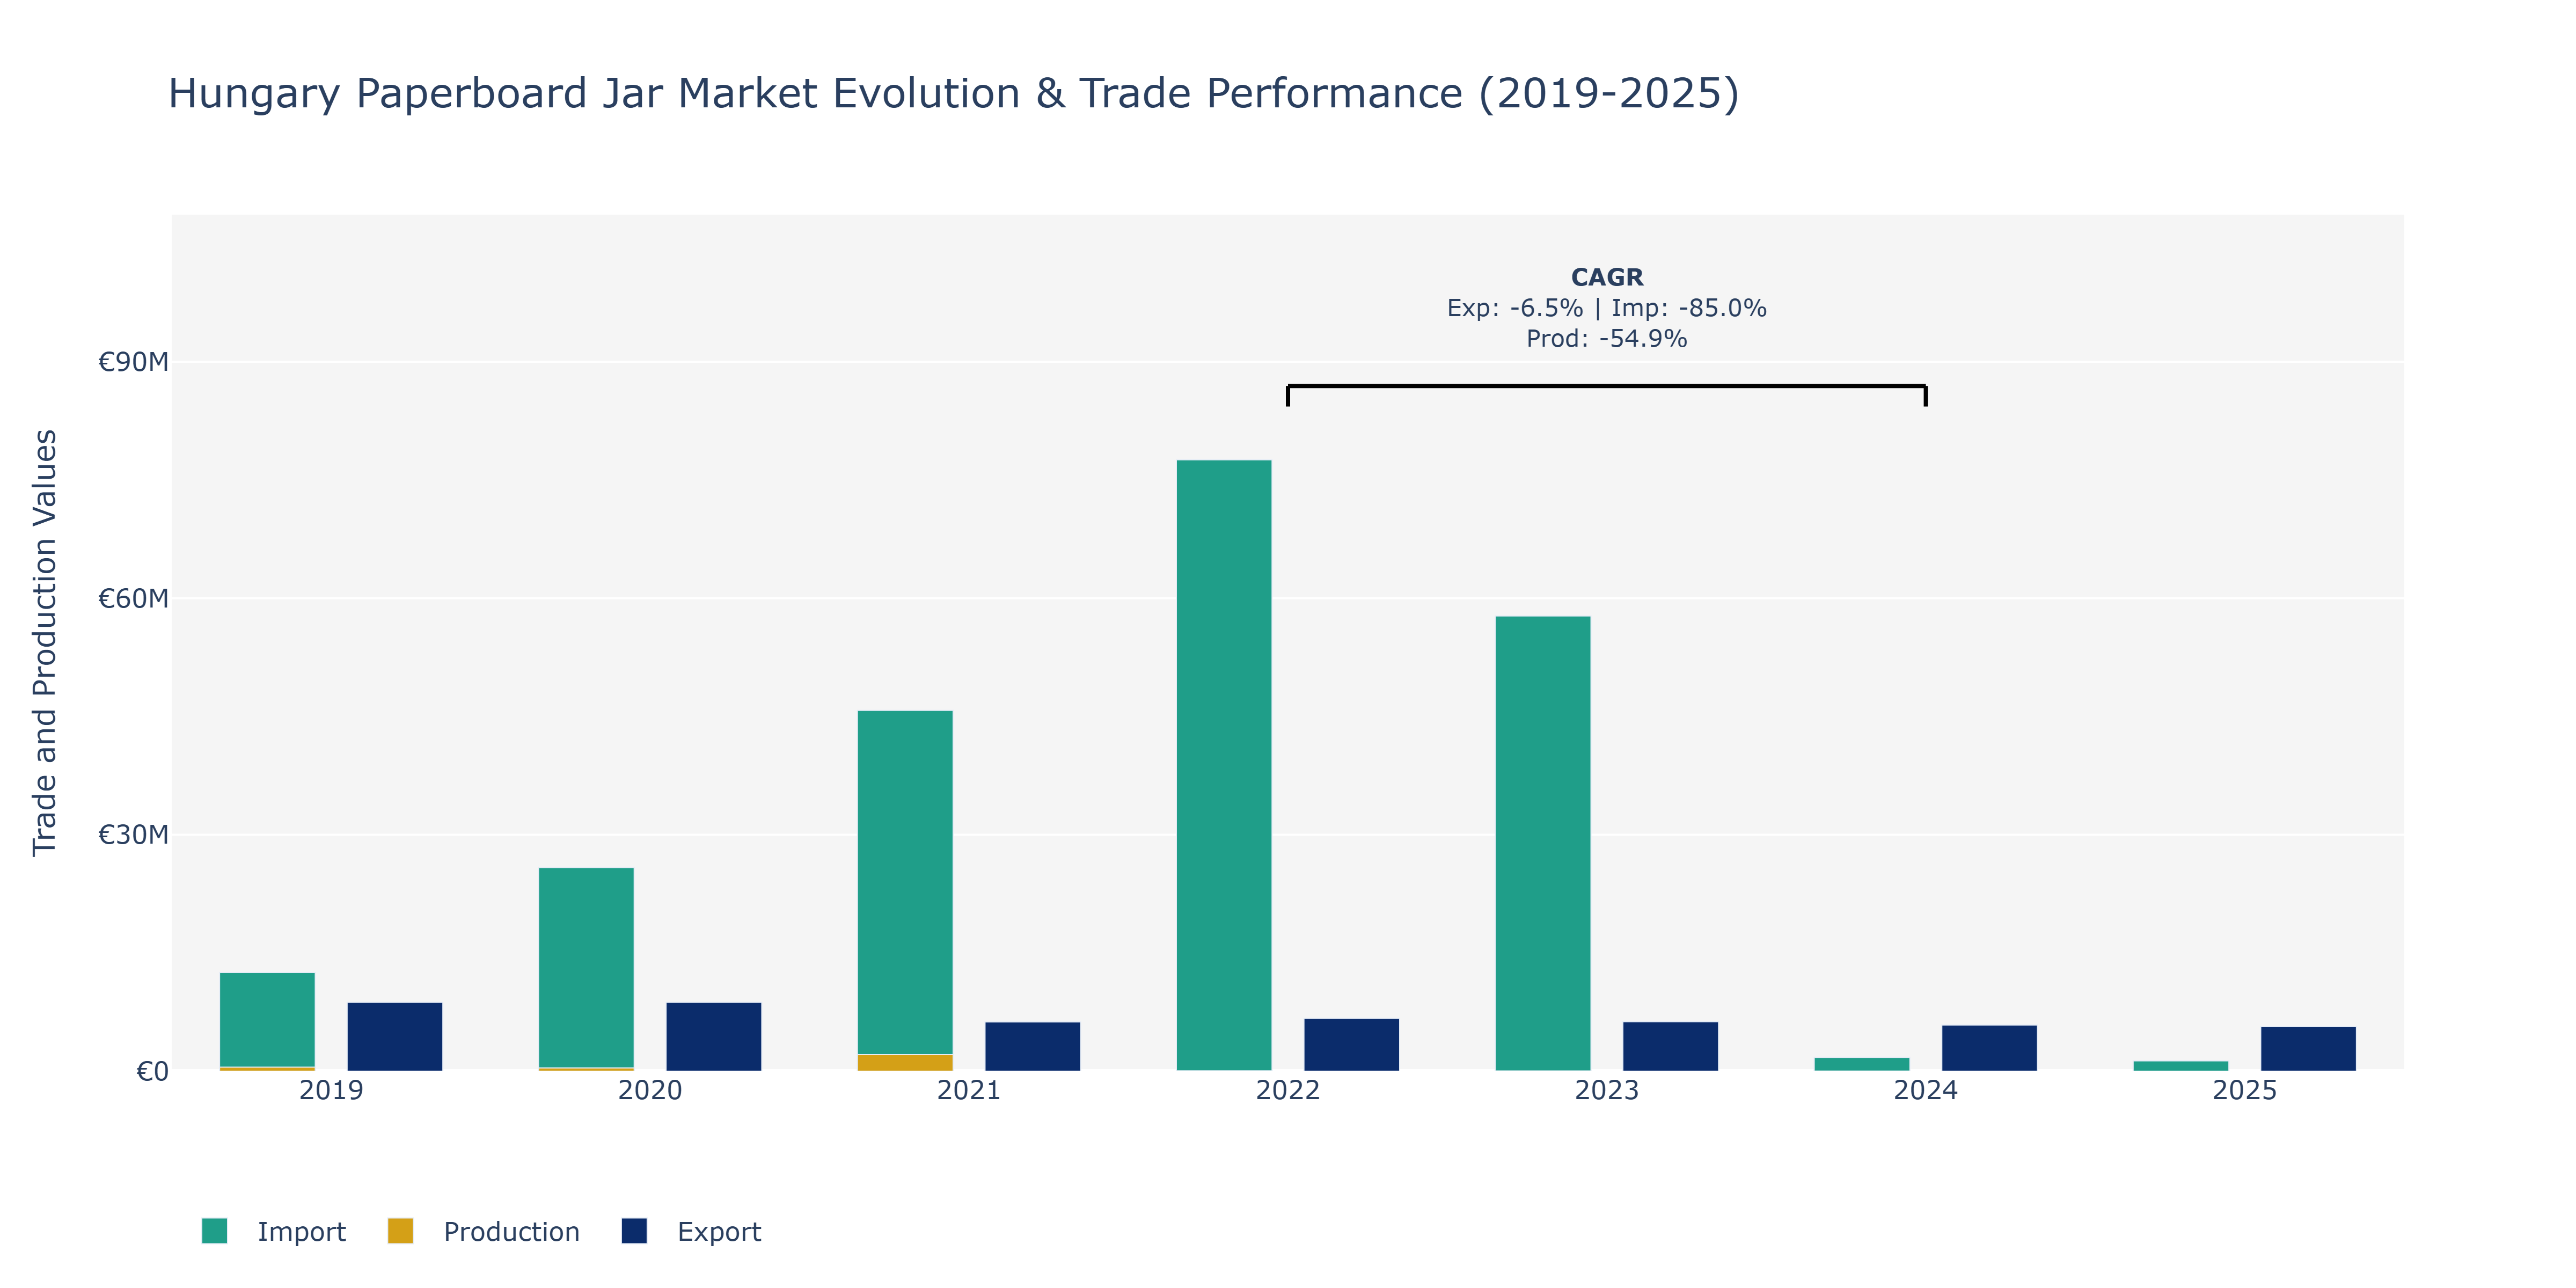
Between 2019 and 2025, the Hungary Paperboard Jar Market witnessed dynamic shifts in its key metrics. Exports remained relatively stable over the period, with a slight decrease from €8.73 million in 2019 to €5.65 million in 2025. In contrast, imports showed a notable fluctuation, starting at €12.52 million in 2019, peaking at €77.57 million in 2022, and then dropping to €1.32 million by 2025. Production, on the other hand, experienced a significant decline from €504 million in 2019 to €7.89 million in 2025. The drastic decline in imports post-2022 could be attributed to shifting global trade dynamics, possibly influenced by changes in supply chain strategies or economic policies. The decline in production may reflect market saturation or technological disruptions impacting traditional paperboard jar manufacturing processes. To adapt to these changes, stakeholders may need to focus on enhancing production efficiency and exploring innovative product solutions to maintain competitiveness in the market.
Key Highlights of the Report:
- Hungary Paperboard Jar Market Outlook
- Market Size of Hungary Paperboard Jar Market, 2025
- Forecast of Hungary Paperboard Jar Market, 2032
- Historical Data and Forecast of Hungary Paperboard Jar Revenues & Volume for the Period 2022-2032F
- Hungary Paperboard Jar Market Trend Evolution
- Hungary Paperboard Jar Market Drivers and Challenges
- Hungary Paperboard Jar Price Trends
- Hungary Paperboard Jar Porter's Five Forces
- Hungary Paperboard Jar Industry Life Cycle
- Historical Data and Forecast of Hungary Paperboard Jar Market Revenues & Volume By Neck Diameter for the Period 2022-2032F
- Historical Data and Forecast of Hungary Paperboard Jar Market Revenues & Volume By Up to 50 mm for the Period 2022-2032F
- Historical Data and Forecast of Hungary Paperboard Jar Market Revenues & Volume By 51 mm 100 mm for the Period 2022-2032F
- Historical Data and Forecast of Hungary Paperboard Jar Market Revenues & Volume By 101 mm & Above for the Period 2022-2032F
- Historical Data and Forecast of Hungary Paperboard Jar Market Revenues & Volume By Closure Type for the Period 2022-2032F
- Historical Data and Forecast of Hungary Paperboard Jar Market Revenues & Volume By Caps for the Period 2022-2032F
- Historical Data and Forecast of Hungary Paperboard Jar Market Revenues & Volume By Snap-on for the Period 2022-2032F
- Historical Data and Forecast of Hungary Paperboard Jar Market Revenues & Volume By Plug for the Period 2022-2032F
- Historical Data and Forecast of Hungary Paperboard Jar Market Revenues & Volume By Lids for the Period 2022-2032F
- Historical Data and Forecast of Hungary Paperboard Jar Market Revenues & Volume By Metal for the Period 2022-2032F
- Historical Data and Forecast of Hungary Paperboard Jar Market Revenues & Volume By Plastic for the Period 2022-2032F
- Historical Data and Forecast of Hungary Paperboard Jar Market Revenues & Volume By Paperboard Ends for the Period 2022-2032F
- Historical Data and Forecast of Hungary Paperboard Jar Market Revenues & Volume By End Use for the Period 2022-2032F
- Historical Data and Forecast of Hungary Paperboard Jar Market Revenues & Volume By Personal Care & Cosmetics for the Period 2022-2032F
- Historical Data and Forecast of Hungary Paperboard Jar Market Revenues & Volume By Coffee and Tea for the Period 2022-2032F
- Historical Data and Forecast of Hungary Paperboard Jar Market Revenues & Volume By Food & Beverages for the Period 2022-2032F
- Historical Data and Forecast of Hungary Paperboard Jar Market Revenues & Volume By Snacks & Confectionery for the Period 2022-2032F
- Historical Data and Forecast of Hungary Paperboard Jar Market Revenues & Volume By Industrial Goods for the Period 2022-2032F
- Historical Data and Forecast of Hungary Paperboard Jar Market Revenues & Volume By Consumer Goods for the Period 2022-2032F
- Historical Data and Forecast of Hungary Paperboard Jar Market Revenues & Volume By Others for the Period 2022-2032F
- Hungary Paperboard Jar Import Export Trade Statistics
- Market Opportunity Assessment By Neck Diameter
- Market Opportunity Assessment By Closure Type
- Market Opportunity Assessment By End Use
- Hungary Paperboard Jar Top Companies Market Share
- Hungary Paperboard Jar Competitive Benchmarking By Technical and Operational Parameters
- Hungary Paperboard Jar Company Profiles
- Hungary Paperboard Jar Key Strategic Recommendations
Frequently Asked Questions About the Market Study (FAQs):
6Wresearch actively monitors the Hungary Paperboard Jar Market and publishes its comprehensive annual report, highlighting emerging trends, growth drivers, revenue analysis, and forecast outlook. Our insights help businesses to make data-backed strategic decisions with ongoing market dynamics. Our analysts track relevent industries related to the Hungary Paperboard Jar Market, allowing our clients with actionable intelligence and reliable forecasts tailored to emerging regional needs.
Yes, we provide customisation as per your requirements. To learn more, feel free to contact us on sales@6wresearch.com
1 Executive Summary |
2 Introduction |
2.1 Key Highlights of the Report |
2.2 Report Description |
2.3 Market Scope & Segmentation |
2.4 Research Methodology |
2.5 Assumptions |
3 Hungary Paperboard Jar Market Overview |
3.1 Hungary Country Macro Economic Indicators |
3.2 Hungary Paperboard Jar Market Revenues & Volume, 2022 & 2032F |
3.3 Hungary Paperboard Jar Market - Industry Life Cycle |
3.4 Hungary Paperboard Jar Market - Porter's Five Forces |
3.5 Hungary Paperboard Jar Market Revenues & Volume Share, By Neck Diameter, 2022 & 2032F |
3.6 Hungary Paperboard Jar Market Revenues & Volume Share, By Closure Type, 2022 & 2032F |
3.7 Hungary Paperboard Jar Market Revenues & Volume Share, By End Use, 2022 & 2032F |
4 Hungary Paperboard Jar Market Dynamics |
4.1 Impact Analysis |
4.2 Market Drivers |
4.2.1 Increasing consumer demand for sustainable packaging solutions |
4.2.2 Growing awareness about environmental conservation leading to preference for eco-friendly packaging |
4.2.3 Rise in online shopping and e-commerce driving the demand for paperboard jars |
4.3 Market Restraints |
4.3.1 Fluctuating raw material prices impacting production costs |
4.3.2 Intense competition from alternative packaging materials like plastics |
4.3.3 Regulatory challenges and compliance requirements affecting market entry and operations |
5 Hungary Paperboard Jar Market Trends |
6 Hungary Paperboard Jar Market, By Types |
6.1 Hungary Paperboard Jar Market, By Neck Diameter |
6.1.1 Overview and Analysis |
6.1.2 Hungary Paperboard Jar Market Revenues & Volume, By Neck Diameter, 2022-2032F |
6.1.3 Hungary Paperboard Jar Market Revenues & Volume, By Up to 50 mm, 2022-2032F |
6.1.4 Hungary Paperboard Jar Market Revenues & Volume, By 51 mm 100 mm, 2022-2032F |
6.1.5 Hungary Paperboard Jar Market Revenues & Volume, By 101 mm & Above, 2022-2032F |
6.2 Hungary Paperboard Jar Market, By Closure Type |
6.2.1 Overview and Analysis |
6.2.2 Hungary Paperboard Jar Market Revenues & Volume, By Caps, 2022-2032F |
6.2.3 Hungary Paperboard Jar Market Revenues & Volume, By Snap-on, 2022-2032F |
6.2.4 Hungary Paperboard Jar Market Revenues & Volume, By Plug, 2022-2032F |
6.2.5 Hungary Paperboard Jar Market Revenues & Volume, By Lids, 2022-2032F |
6.2.6 Hungary Paperboard Jar Market Revenues & Volume, By Metal, 2022-2032F |
6.2.7 Hungary Paperboard Jar Market Revenues & Volume, By Plastic, 2022-2032F |
6.3 Hungary Paperboard Jar Market, By End Use |
6.3.1 Overview and Analysis |
6.3.2 Hungary Paperboard Jar Market Revenues & Volume, By Personal Care & Cosmetics, 2022-2032F |
6.3.3 Hungary Paperboard Jar Market Revenues & Volume, By Coffee and Tea, 2022-2032F |
6.3.4 Hungary Paperboard Jar Market Revenues & Volume, By Food & Beverages, 2022-2032F |
6.3.5 Hungary Paperboard Jar Market Revenues & Volume, By Snacks & Confectionery, 2022-2032F |
6.3.6 Hungary Paperboard Jar Market Revenues & Volume, By Industrial Goods, 2022-2032F |
6.3.7 Hungary Paperboard Jar Market Revenues & Volume, By Consumer Goods, 2022-2032F |
7 Hungary Paperboard Jar Market Import-Export Trade Statistics |
7.1 Hungary Paperboard Jar Market Export to Major Countries |
7.2 Hungary Paperboard Jar Market Imports from Major Countries |
8 Hungary Paperboard Jar Market Key Performance Indicators |
8.1 Percentage of recycled content used in paperboard jars production |
8.2 Number of new product innovations in the paperboard jar market |
8.3 Adoption rate of paperboard jars by major FMCG companies for packaging their products |
9 Hungary Paperboard Jar Market - Opportunity Assessment |
9.1 Hungary Paperboard Jar Market Opportunity Assessment, By Neck Diameter, 2022 & 2032F |
9.2 Hungary Paperboard Jar Market Opportunity Assessment, By Closure Type, 2022 & 2032F |
9.3 Hungary Paperboard Jar Market Opportunity Assessment, By End Use, 2022 & 2032F |
10 Hungary Paperboard Jar Market - Competitive Landscape |
10.1 Hungary Paperboard Jar Market Revenue Share, By Companies, 2025 |
10.2 Hungary Paperboard Jar Market Competitive Benchmarking, By Operating and Technical Parameters |
11 Company Profiles |
12 Recommendations |
13 Disclaimer |
Export potential assessment - trade Analytics for 2030
Export potential enables firms to identify high-growth global markets with greater confidence by combining advanced trade intelligence with a structured quantitative methodology. The framework analyzes emerging demand trends and country-level import patterns while integrating macroeconomic and trade datasets such as GDP and population forecasts, bilateral import–export flows, tariff structures, elasticity differentials between developed and developing economies, geographic distance, and import demand projections. Using weighted trade values from 2020–2024 as the base period to project country-to-country export potential for 2030, these inputs are operationalized through calculated drivers such as gravity model parameters, tariff impact factors, and projected GDP per-capita growth. Through an analysis of hidden potentials, demand hotspots, and market conditions that are most favorable to success, this method enables firms to focus on target countries, maximize returns, and global expansion with data, backed by accuracy.
By factoring in the projected importer demand gap that is currently unmet and could be potential opportunity, it identifies the potential for the Exporter (Country) among 190 countries, against the general trade analysis, which identifies the biggest importer or exporter.
To discover high-growth global markets and optimize your business strategy:
Click Here
Pricing
- Single User License$ 1,995
- Department License$ 2,400
- Site License$ 3,120
- Global License$ 3,795

Search
Thought Leadership and Analyst Meet


Our Clients
Latest Reports
- Canada Cloud CFD Market (2026-2032) | Size & Revenue, Industry, Growth, Competitive Landscape, Forecast, Segmentation, Value, Outlook, Trends, Share, Analysis, Companies
- Taiwan Food Delivery Platform Market (2026-2032) | Companies, Outlook, Analysis, Trends, Value, Revenue, Segmentation, Share, Forecast, Competitive Landscape, Growth, Size & Forecast
- United Kingdom (UK) Long-term Care Insurance Market (2026-2032) | Growth, Share, Consumer Insights, Drivers, Opportunities, Competition, Pricing Analysis, Segments, Restraints, Companies, Competitive, Value, Outlook, Size, Demand, Analysis, Challenges, Strategic Insights, Investment Trends, Revenue, Trends, Supply, Forecast
- United Kingdom (UK) Long Term Care Market (2026-2032) | Companies, Outlook, Analysis, Trends, Value, Revenue, Segmentation, Share, Forecast, Competitive Landscape, Growth, Size & Forecast
- Iraq Insulation and Waterproofing Market (2026-2032) | Outlook, Drivers, Growth, Size, Share, Industry, Revenue, Trends, Demand, Competitive, Strategic Insights, Opportunities, Segments, Companies, Challenges, Strategy, Consumer Insights, Analysis, Investment Trends, Value, Segmentation, Forecast, Restraints
- India Switchgear Market Outlook (2026-2032) | Size, Share, Trends, Growth, Revenue, Forecast, Analysis, Value, Outlook
- Pakistan Contraceptive Implants Market (2025-2031) | Demand, Growth, Size, Share, Industry, Pricing Analysis, Competitive, Strategic Insights, Strategy, Consumer Insights, Analysis, Investment Trends, Opportunities, Revenue, Segments, Value, Segmentation, Supply, Forecast, Restraints, Outlook, Competition, Drivers, Trends, Companies, Challenges
- Sri Lanka Packaging Market (2026-2032) | Outlook, Competition, Drivers, Trends, Demand, Pricing Analysis, Competitive, Strategic Insights, Companies, Challenges, Strategy, Consumer Insights, Analysis, Investment Trends, Opportunities, Growth, Size, Share, Industry, Revenue, Segments, Value, Segmentation, Supply, Forecast, Restraints
- India Kids Watches Market (2026-2032) | Strategy, Consumer Insights, Analysis, Investment Trends, Opportunities, Growth, Size, Share, Industry, Revenue, Segments, Value, Segmentation, Supply, Forecast, Restraints, Outlook, Competition, Drivers, Trends, Demand, Pricing Analysis, Competitive, Strategic Insights, Companies, Challenges
- Saudi Arabia Core Assurance Service Market (2025-2031) | Strategy, Consumer Insights, Analysis, Investment Trends, Opportunities, Growth, Size, Share, Industry, Revenue, Segments, Value, Segmentation, Supply, Forecast, Restraints, Outlook, Competition, Drivers, Trends, Demand, Pricing Analysis, Competitive, Strategic Insights, Companies, Challenges
Industry Events and Analyst Meet

India EV Show 2026

EV tech India Expo 2026

Auto Tech Asia 2026

Battery Tech India 2026

Smart Production Solutions Guangzhou 2026
Whitepaper
- Middle East & Africa Commercial Security Market Click here to view more.
- Middle East & Africa Fire Safety Systems & Equipment Market Click here to view more.
- GCC Drone Market Click here to view more.
- Middle East Lighting Fixture Market Click here to view more.
- GCC Physical & Perimeter Security Market Click here to view more.
6WResearch In News
- Doha a strategic location for EV manufacturing hub: IPA Qatar
- Demand for luxury TVs surging in the GCC, says Samsung
- Empowering Growth: The Thriving Journey of Bangladesh’s Cable Industry
- Demand for luxury TVs surging in the GCC, says Samsung
- Video call with a traditional healer? Once unthinkable, it’s now common in South Africa
- Intelligent Buildings To Smooth GCC’s Path To Net Zero