Hungary Stable Isotope Labeled Compound Market (2026-2032) | Share, Size & Revenue, Trends, Industry, Analysis, Companies, Competitive Landscape, Forecast, Outlook, Growth, Value, Segmentation
Market Forecast By Type (Deuterium, Carbon 12 & 13, Nitrogen 15, Oxygen 16 & 18, Lithium 6 & 7, Sulphur 34, Chlorine 35 & 37), By Application (Research, Clinical Diagnostics, Industrial), By End User (Academic & Research, Institution, Hospital & Diagnostic Centers, Pharmaceutical & Biopharmaceutical Companies) And Competitive Landscape
| Product Code: ETC7511267 | Publication Date: Sep 2024 | Updated Date: Apr 2026 | Product Type: Market Research Report | |
| Publisher: 6Wresearch | Author: Summon Dutta | No. of Pages: 75 | No. of Figures: 35 | No. of Tables: 20 |
Hungary Stable Isotope Labeled Compound Market Size (2020-2030)
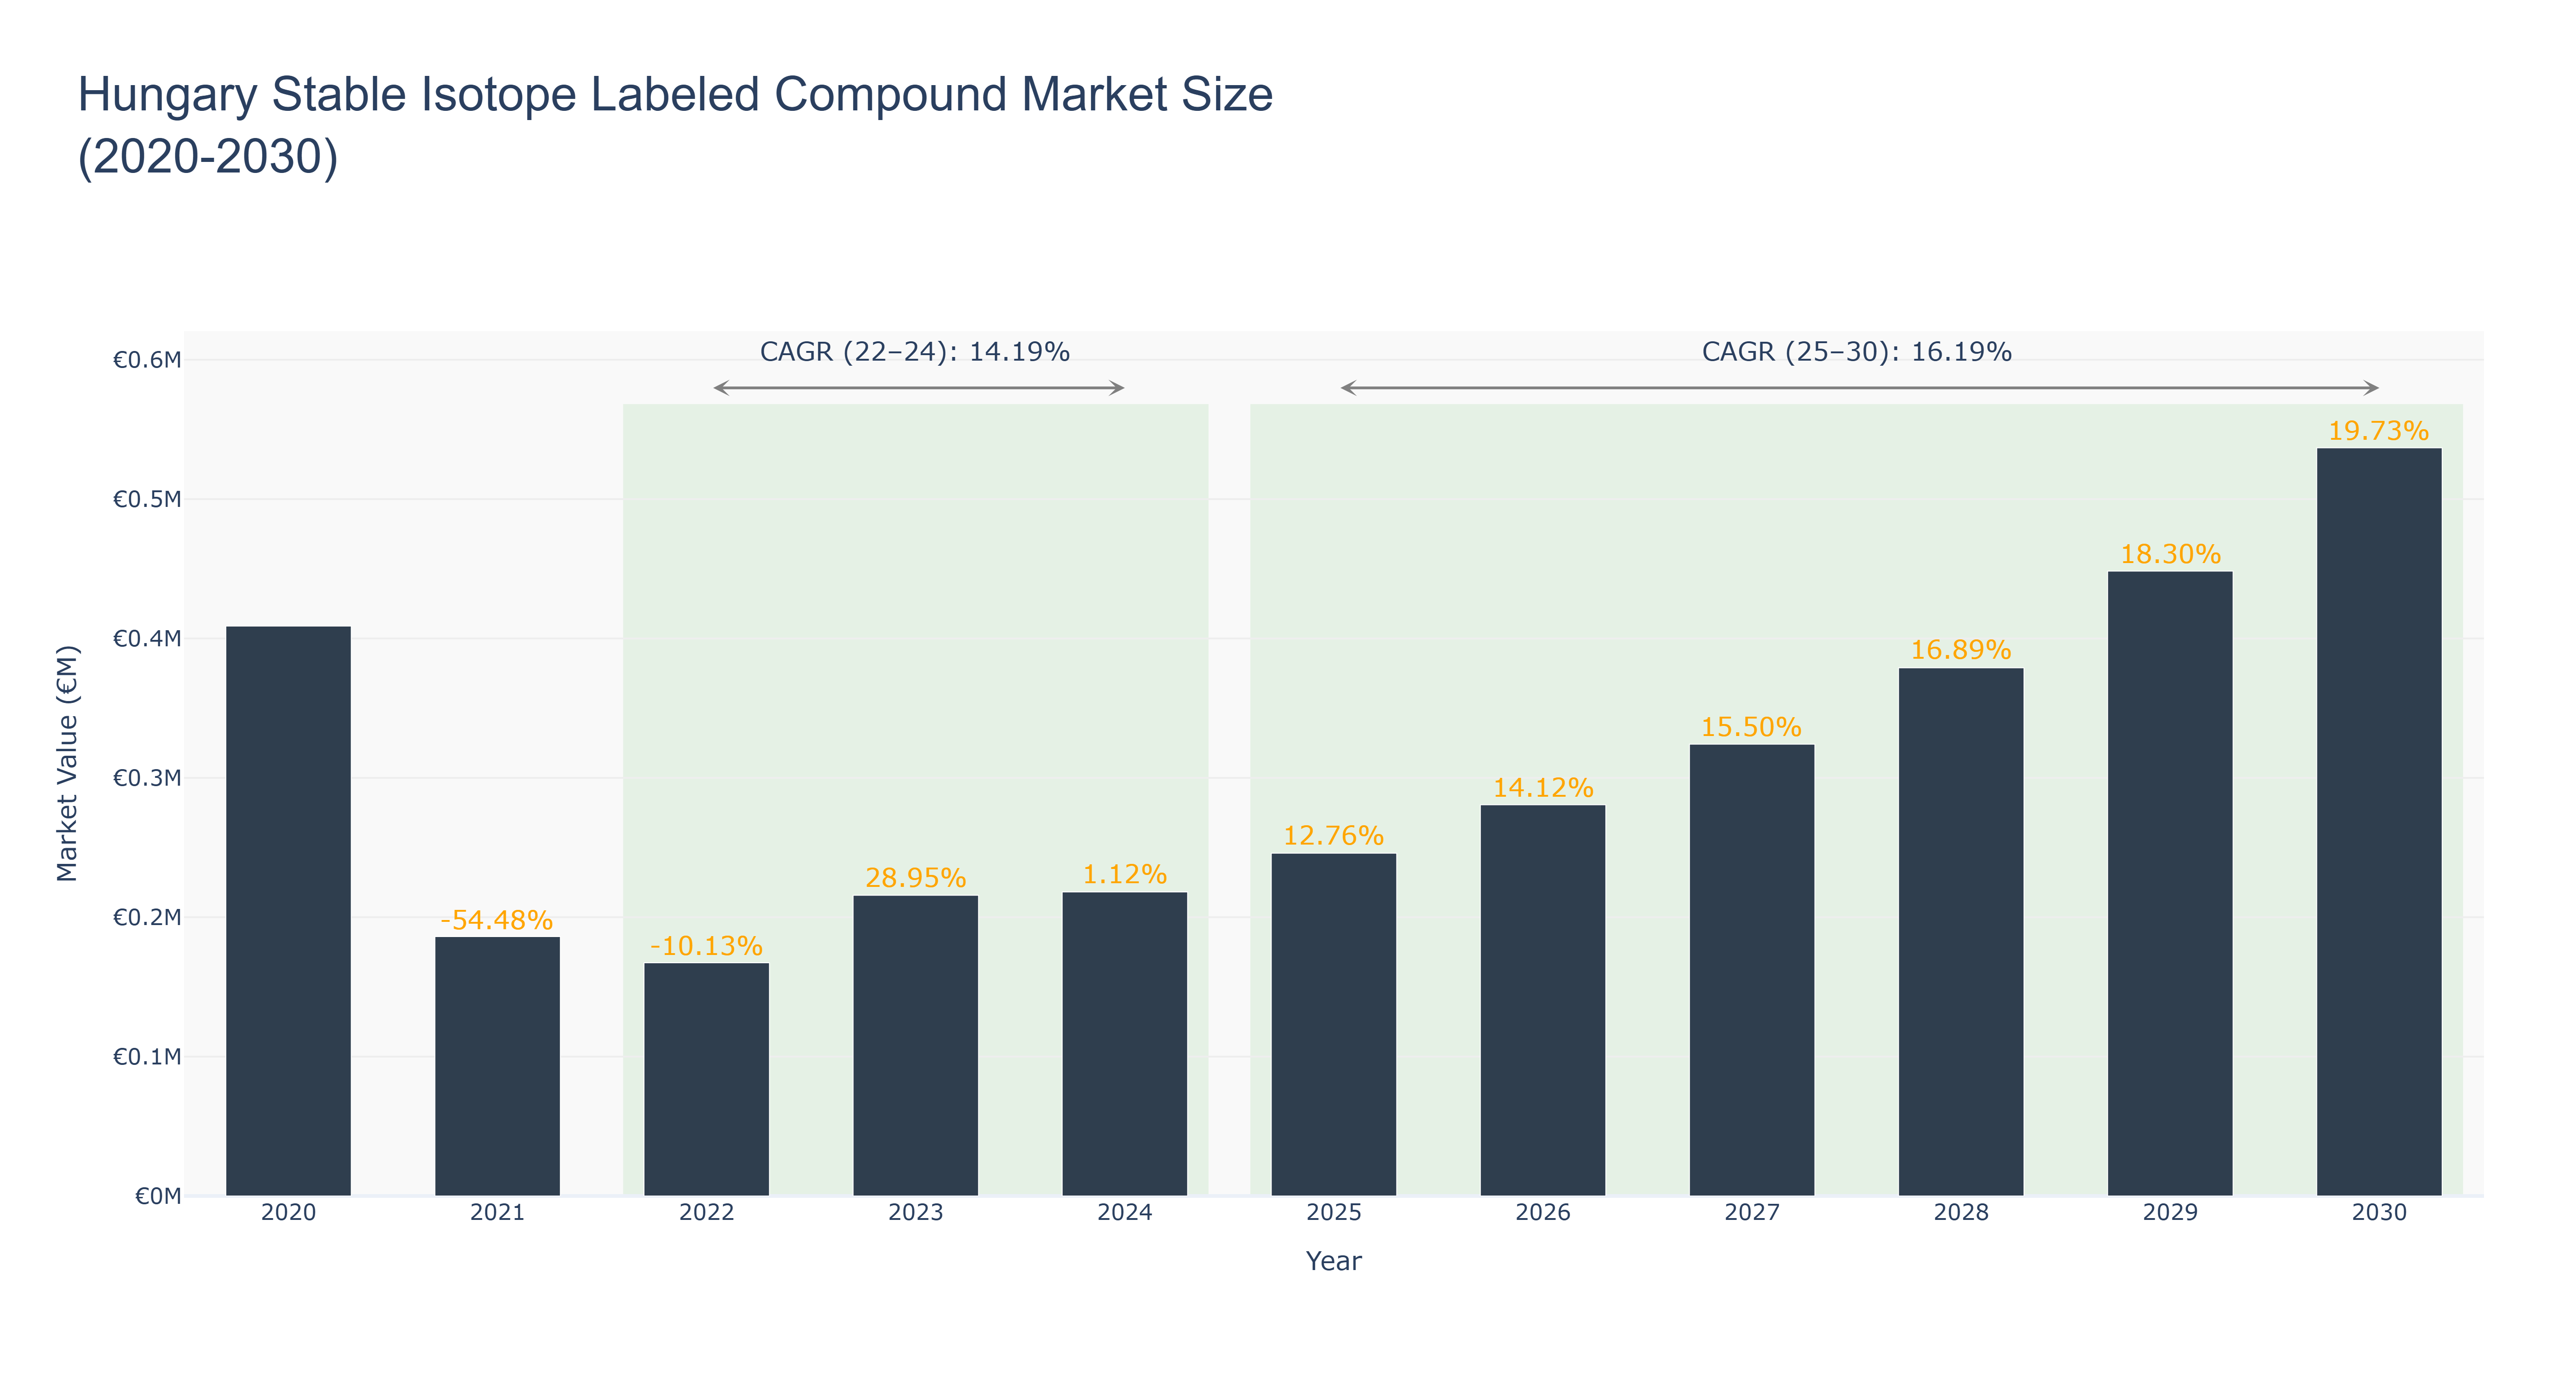
Hungary Stable Isotope Labeled Compound Market has shown a fluctuating trend in recent years. The peak market size of €0.54 million is forecasted for 2030, with a steady growth trajectory. Actual market size decreased from €0.41 million in 2020 to €0.22 million in 2024, attributed to initial market instability and economic challenges. However, a notable recovery began in 2025, with a 12.76% growth, and has been consistently increasing since. The CAGR for 2022-24 stands at 14.19%, while the CAGR for 2025-30 is projected at 16.19%. Industry drivers such as increasing demand for stable isotope labeled compounds in research and medical applications are fueling this growth. Looking ahead, Hungary is set to launch a new research initiative in collaboration with leading pharmaceutical companies to further advance the market's capabilities and offerings.
Hungary Stable Isotope Labeled Compound Market: Production & Trade Performance (2019-2025)
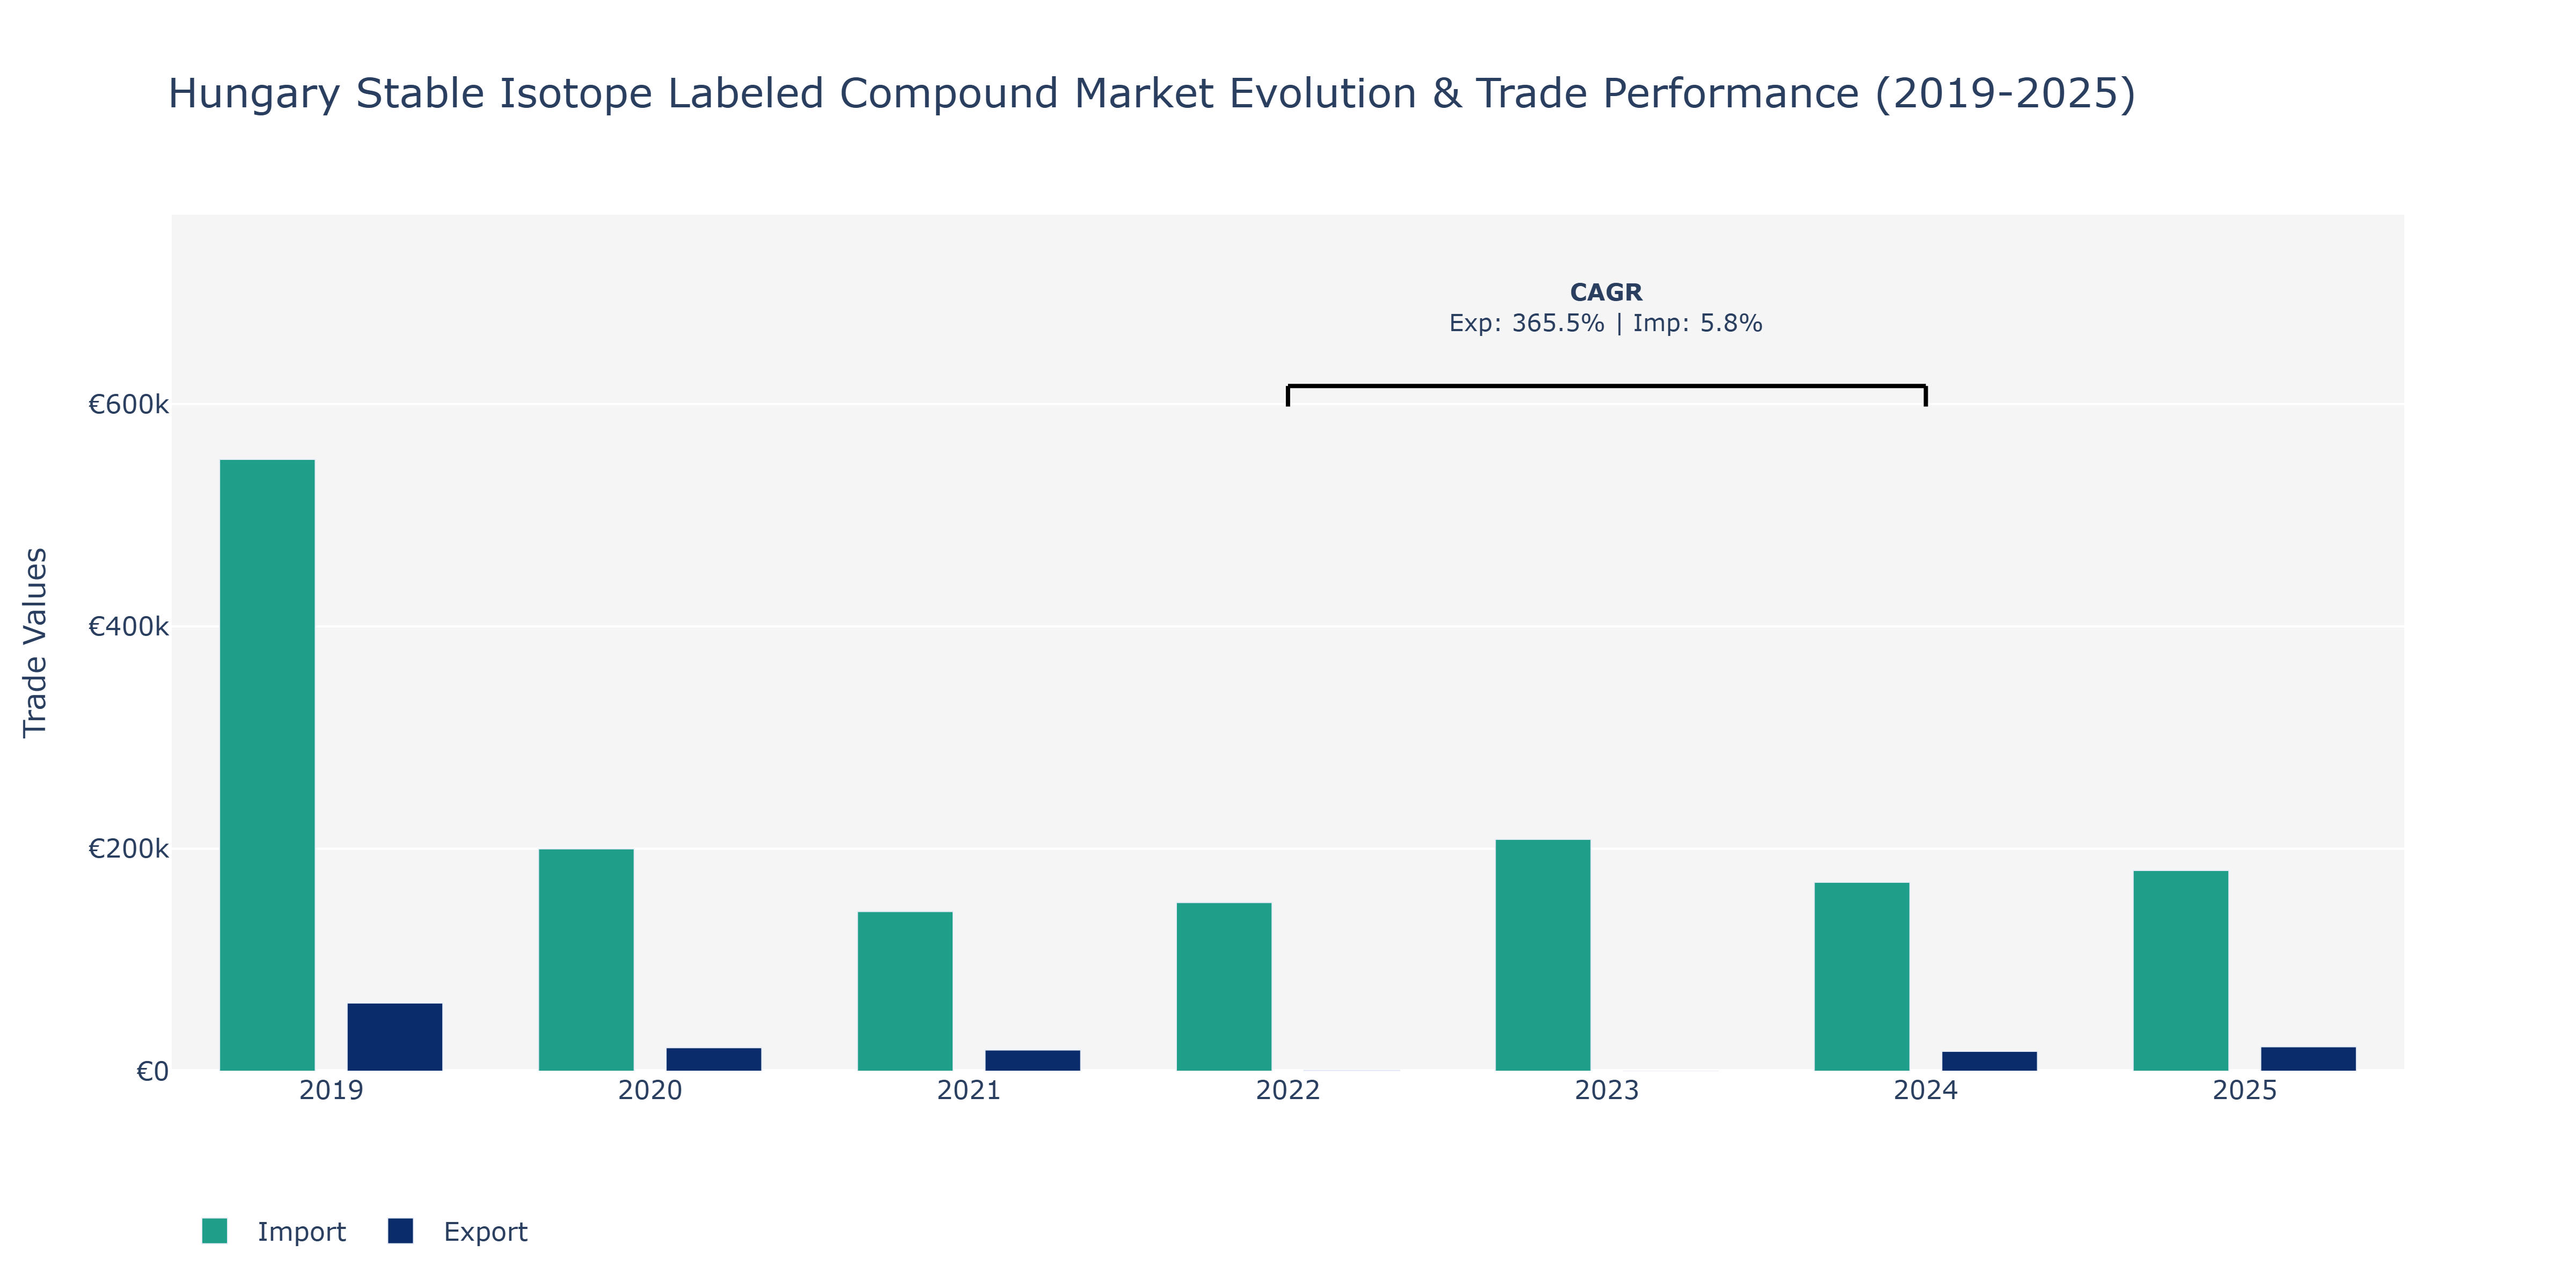
The Hungary Stable Isotope Labeled Compound Market witnessed varied trends in Exports and Imports over the analyzed years. In 2019, Exports stood at €61.36 thousand, significantly declining to €21.06 thousand in 2020, and further dropping to €19.01 thousand in 2021. The year 2022 saw a substantial decrease to €822 thousand in Exports, followed by a notable recovery to €17.81 thousand in 2024 and €21.97 thousand in 2025, showcasing a strong rebound. On the other hand, Imports amounted to €550.2 thousand in 2019, decreasing to €199.97 thousand in 2020, and further declining to €143.64 thousand in 2021. Although there was a slight increase to €151.69 thousand in 2022, Imports peaked at €208.52 thousand in 2023, then slightly moderated to €169.88 thousand in 2024, and €180.44 thousand in 2025. These shifts in trade volumes could be attributed to factors such as global economic conditions, advancements in stable isotope research, and regulatory changes affecting the pharmaceutical and scientific research sectors in Hungary.
Key Highlights of the Report:
- Hungary Stable Isotope Labeled Compound Market Outlook
- Market Size of Hungary Stable Isotope Labeled Compound Market, 2025
- Forecast of Hungary Stable Isotope Labeled Compound Market, 2032
- Historical Data and Forecast of Hungary Stable Isotope Labeled Compound Revenues & Volume for the Period 2022-2032F
- Hungary Stable Isotope Labeled Compound Market Trend Evolution
- Hungary Stable Isotope Labeled Compound Market Drivers and Challenges
- Hungary Stable Isotope Labeled Compound Price Trends
- Hungary Stable Isotope Labeled Compound Porter's Five Forces
- Hungary Stable Isotope Labeled Compound Industry Life Cycle
- Historical Data and Forecast of Hungary Stable Isotope Labeled Compound Market Revenues & Volume By Type for the Period 2022-2032F
- Historical Data and Forecast of Hungary Stable Isotope Labeled Compound Market Revenues & Volume By Deuterium for the Period 2022-2032F
- Historical Data and Forecast of Hungary Stable Isotope Labeled Compound Market Revenues & Volume By Carbon 12 & 13 for the Period 2022-2032F
- Historical Data and Forecast of Hungary Stable Isotope Labeled Compound Market Revenues & Volume By Nitrogen 15 for the Period 2022-2032F
- Historical Data and Forecast of Hungary Stable Isotope Labeled Compound Market Revenues & Volume By Oxygen 16 & 18 for the Period 2022-2032F
- Historical Data and Forecast of Hungary Stable Isotope Labeled Compound Market Revenues & Volume By Lithium 6 & 7 for the Period 2022-2032F
- Historical Data and Forecast of Hungary Stable Isotope Labeled Compound Market Revenues & Volume By Sulphur 34 for the Period 2022-2032F
- Historical Data and Forecast of Hungary Stable Isotope Labeled Compound Market Revenues & Volume By Chlorine 35 & 37 for the Period 2022-2032F
- Historical Data and Forecast of Hungary Stable Isotope Labeled Compound Market Revenues & Volume By Application for the Period 2022-2032F
- Historical Data and Forecast of Hungary Stable Isotope Labeled Compound Market Revenues & Volume By Research for the Period 2022-2032F
- Historical Data and Forecast of Hungary Stable Isotope Labeled Compound Market Revenues & Volume By Clinical Diagnostics for the Period 2022-2032F
- Historical Data and Forecast of Hungary Stable Isotope Labeled Compound Market Revenues & Volume By Industrial for the Period 2022-2032F
- Historical Data and Forecast of Hungary Stable Isotope Labeled Compound Market Revenues & Volume By End User for the Period 2022-2032F
- Historical Data and Forecast of Hungary Stable Isotope Labeled Compound Market Revenues & Volume By Academic & Research for the Period 2022-2032F
- Historical Data and Forecast of Hungary Stable Isotope Labeled Compound Market Revenues & Volume By Institution for the Period 2022-2032F
- Historical Data and Forecast of Hungary Stable Isotope Labeled Compound Market Revenues & Volume By Hospital & Diagnostic Centers for the Period 2022-2032F
- Historical Data and Forecast of Hungary Stable Isotope Labeled Compound Market Revenues & Volume By Pharmaceutical & Biopharmaceutical Companies for the Period 2022-2032F
- Hungary Stable Isotope Labeled Compound Import Export Trade Statistics
- Market Opportunity Assessment By Type
- Market Opportunity Assessment By Application
- Market Opportunity Assessment By End User
- Hungary Stable Isotope Labeled Compound Top Companies Market Share
- Hungary Stable Isotope Labeled Compound Competitive Benchmarking By Technical and Operational Parameters
- Hungary Stable Isotope Labeled Compound Company Profiles
- Hungary Stable Isotope Labeled Compound Key Strategic Recommendations
Frequently Asked Questions About the Market Study (FAQs):
6Wresearch actively monitors the Hungary Stable Isotope Labeled Compound Market and publishes its comprehensive annual report, highlighting emerging trends, growth drivers, revenue analysis, and forecast outlook. Our insights help businesses to make data-backed strategic decisions with ongoing market dynamics. Our analysts track relevent industries related to the Hungary Stable Isotope Labeled Compound Market, allowing our clients with actionable intelligence and reliable forecasts tailored to emerging regional needs.
Yes, we provide customisation as per your requirements. To learn more, feel free to contact us on sales@6wresearch.com
1 Executive Summary |
2 Introduction |
2.1 Key Highlights of the Report |
2.2 Report Description |
2.3 Market Scope & Segmentation |
2.4 Research Methodology |
2.5 Assumptions |
3 Hungary Stable Isotope Labeled Compound Market Overview |
3.1 Hungary Country Macro Economic Indicators |
3.2 Hungary Stable Isotope Labeled Compound Market Revenues & Volume, 2022 & 2032F |
3.3 Hungary Stable Isotope Labeled Compound Market - Industry Life Cycle |
3.4 Hungary Stable Isotope Labeled Compound Market - Porter's Five Forces |
3.5 Hungary Stable Isotope Labeled Compound Market Revenues & Volume Share, By Type, 2022 & 2032F |
3.6 Hungary Stable Isotope Labeled Compound Market Revenues & Volume Share, By Application, 2022 & 2032F |
3.7 Hungary Stable Isotope Labeled Compound Market Revenues & Volume Share, By End User, 2022 & 2032F |
4 Hungary Stable Isotope Labeled Compound Market Dynamics |
4.1 Impact Analysis |
4.2 Market Drivers |
4.2.1 Increasing demand for stable isotope labeled compounds in research and development activities |
4.2.2 Growing adoption of stable isotope labeling in pharmaceutical and biotechnology industries |
4.2.3 Technological advancements leading to the development of new stable isotope labeled compounds |
4.3 Market Restraints |
4.3.1 High cost associated with stable isotope labeled compounds |
4.3.2 Regulatory challenges related to the production and distribution of stable isotope labeled compounds |
5 Hungary Stable Isotope Labeled Compound Market Trends |
6 Hungary Stable Isotope Labeled Compound Market, By Types |
6.1 Hungary Stable Isotope Labeled Compound Market, By Type |
6.1.1 Overview and Analysis |
6.1.2 Hungary Stable Isotope Labeled Compound Market Revenues & Volume, By Type, 2022-2032F |
6.1.3 Hungary Stable Isotope Labeled Compound Market Revenues & Volume, By Deuterium, 2022-2032F |
6.1.4 Hungary Stable Isotope Labeled Compound Market Revenues & Volume, By Carbon 12 & 13, 2022-2032F |
6.1.5 Hungary Stable Isotope Labeled Compound Market Revenues & Volume, By Nitrogen 15, 2022-2032F |
6.1.6 Hungary Stable Isotope Labeled Compound Market Revenues & Volume, By Oxygen 16 & 18, 2022-2032F |
6.1.7 Hungary Stable Isotope Labeled Compound Market Revenues & Volume, By Lithium 6 & 7, 2022-2032F |
6.1.8 Hungary Stable Isotope Labeled Compound Market Revenues & Volume, By Sulphur 34, 2022-2032F |
6.2 Hungary Stable Isotope Labeled Compound Market, By Application |
6.2.1 Overview and Analysis |
6.2.2 Hungary Stable Isotope Labeled Compound Market Revenues & Volume, By Research, 2022-2032F |
6.2.3 Hungary Stable Isotope Labeled Compound Market Revenues & Volume, By Clinical Diagnostics, 2022-2032F |
6.2.4 Hungary Stable Isotope Labeled Compound Market Revenues & Volume, By Industrial, 2022-2032F |
6.3 Hungary Stable Isotope Labeled Compound Market, By End User |
6.3.1 Overview and Analysis |
6.3.2 Hungary Stable Isotope Labeled Compound Market Revenues & Volume, By Academic & Research, 2022-2032F |
6.3.3 Hungary Stable Isotope Labeled Compound Market Revenues & Volume, By Institution, 2022-2032F |
6.3.4 Hungary Stable Isotope Labeled Compound Market Revenues & Volume, By Hospital & Diagnostic Centers, 2022-2032F |
6.3.5 Hungary Stable Isotope Labeled Compound Market Revenues & Volume, By Pharmaceutical & Biopharmaceutical Companies, 2022-2032F |
7 Hungary Stable Isotope Labeled Compound Market Import-Export Trade Statistics |
7.1 Hungary Stable Isotope Labeled Compound Market Export to Major Countries |
7.2 Hungary Stable Isotope Labeled Compound Market Imports from Major Countries |
8 Hungary Stable Isotope Labeled Compound Market Key Performance Indicators |
8.1 Research and development investment in stable isotope labeled compounds |
8.2 Number of patent filings related to stable isotope labeling technologies |
8.3 Adoption rate of stable isotope labeled compounds in different industries |
8.4 Number of partnerships and collaborations for the development of stable isotope labeled compounds |
8.5 Rate of technological advancements in stable isotope labeling techniques |
9 Hungary Stable Isotope Labeled Compound Market - Opportunity Assessment |
9.1 Hungary Stable Isotope Labeled Compound Market Opportunity Assessment, By Type, 2022 & 2032F |
9.2 Hungary Stable Isotope Labeled Compound Market Opportunity Assessment, By Application, 2022 & 2032F |
9.3 Hungary Stable Isotope Labeled Compound Market Opportunity Assessment, By End User, 2022 & 2032F |
10 Hungary Stable Isotope Labeled Compound Market - Competitive Landscape |
10.1 Hungary Stable Isotope Labeled Compound Market Revenue Share, By Companies, 2025 |
10.2 Hungary Stable Isotope Labeled Compound Market Competitive Benchmarking, By Operating and Technical Parameters |
11 Company Profiles |
12 Recommendations |
13 Disclaimer |
Export potential assessment - trade Analytics for 2030
Export potential enables firms to identify high-growth global markets with greater confidence by combining advanced trade intelligence with a structured quantitative methodology. The framework analyzes emerging demand trends and country-level import patterns while integrating macroeconomic and trade datasets such as GDP and population forecasts, bilateral import–export flows, tariff structures, elasticity differentials between developed and developing economies, geographic distance, and import demand projections. Using weighted trade values from 2020–2024 as the base period to project country-to-country export potential for 2030, these inputs are operationalized through calculated drivers such as gravity model parameters, tariff impact factors, and projected GDP per-capita growth. Through an analysis of hidden potentials, demand hotspots, and market conditions that are most favorable to success, this method enables firms to focus on target countries, maximize returns, and global expansion with data, backed by accuracy.
By factoring in the projected importer demand gap that is currently unmet and could be potential opportunity, it identifies the potential for the Exporter (Country) among 190 countries, against the general trade analysis, which identifies the biggest importer or exporter.
To discover high-growth global markets and optimize your business strategy:
Click Here
Pricing
- Single User License$ 1,995
- Department License$ 2,400
- Site License$ 3,120
- Global License$ 3,795

Search
Thought Leadership and Analyst Meet


Our Clients
Latest Reports
- Canada Cloud CFD Market (2026-2032) | Size & Revenue, Industry, Growth, Competitive Landscape, Forecast, Segmentation, Value, Outlook, Trends, Share, Analysis, Companies
- Taiwan Food Delivery Platform Market (2026-2032) | Companies, Outlook, Analysis, Trends, Value, Revenue, Segmentation, Share, Forecast, Competitive Landscape, Growth, Size & Forecast
- United Kingdom (UK) Long-term Care Insurance Market (2026-2032) | Growth, Share, Consumer Insights, Drivers, Opportunities, Competition, Pricing Analysis, Segments, Restraints, Companies, Competitive, Value, Outlook, Size, Demand, Analysis, Challenges, Strategic Insights, Investment Trends, Revenue, Trends, Supply, Forecast
- United Kingdom (UK) Long Term Care Market (2026-2032) | Companies, Outlook, Analysis, Trends, Value, Revenue, Segmentation, Share, Forecast, Competitive Landscape, Growth, Size & Forecast
- Iraq Insulation and Waterproofing Market (2026-2032) | Outlook, Drivers, Growth, Size, Share, Industry, Revenue, Trends, Demand, Competitive, Strategic Insights, Opportunities, Segments, Companies, Challenges, Strategy, Consumer Insights, Analysis, Investment Trends, Value, Segmentation, Forecast, Restraints
- India Switchgear Market Outlook (2026-2032) | Size, Share, Trends, Growth, Revenue, Forecast, Analysis, Value, Outlook
- Pakistan Contraceptive Implants Market (2025-2031) | Demand, Growth, Size, Share, Industry, Pricing Analysis, Competitive, Strategic Insights, Strategy, Consumer Insights, Analysis, Investment Trends, Opportunities, Revenue, Segments, Value, Segmentation, Supply, Forecast, Restraints, Outlook, Competition, Drivers, Trends, Companies, Challenges
- Sri Lanka Packaging Market (2026-2032) | Outlook, Competition, Drivers, Trends, Demand, Pricing Analysis, Competitive, Strategic Insights, Companies, Challenges, Strategy, Consumer Insights, Analysis, Investment Trends, Opportunities, Growth, Size, Share, Industry, Revenue, Segments, Value, Segmentation, Supply, Forecast, Restraints
- India Kids Watches Market (2026-2032) | Strategy, Consumer Insights, Analysis, Investment Trends, Opportunities, Growth, Size, Share, Industry, Revenue, Segments, Value, Segmentation, Supply, Forecast, Restraints, Outlook, Competition, Drivers, Trends, Demand, Pricing Analysis, Competitive, Strategic Insights, Companies, Challenges
- Saudi Arabia Core Assurance Service Market (2025-2031) | Strategy, Consumer Insights, Analysis, Investment Trends, Opportunities, Growth, Size, Share, Industry, Revenue, Segments, Value, Segmentation, Supply, Forecast, Restraints, Outlook, Competition, Drivers, Trends, Demand, Pricing Analysis, Competitive, Strategic Insights, Companies, Challenges
Industry Events and Analyst Meet

India EV Show 2026

EV tech India Expo 2026

Auto Tech Asia 2026

Battery Tech India 2026

Smart Production Solutions Guangzhou 2026
Whitepaper
- Middle East & Africa Commercial Security Market Click here to view more.
- Middle East & Africa Fire Safety Systems & Equipment Market Click here to view more.
- GCC Drone Market Click here to view more.
- Middle East Lighting Fixture Market Click here to view more.
- GCC Physical & Perimeter Security Market Click here to view more.
6WResearch In News
- Doha a strategic location for EV manufacturing hub: IPA Qatar
- Demand for luxury TVs surging in the GCC, says Samsung
- Empowering Growth: The Thriving Journey of Bangladesh’s Cable Industry
- Demand for luxury TVs surging in the GCC, says Samsung
- Video call with a traditional healer? Once unthinkable, it’s now common in South Africa
- Intelligent Buildings To Smooth GCC’s Path To Net Zero