Iceland Hotel Uniforms Market (2026-2032) | Analysis, Segments, Strategy, Pricing Analysis, Investment Trends, Drivers, Outlook, Competition, Size, Forecast, Growth, Share, Consumer Insights, Revenue, Challenges, Opportunities, Demand, Restraints, Companies, Supply, Strategic Insights, Trends, Industry, Segmentation, Competitive, Value
Market Forecast By Type (Front Desk, Housekeeping, Chef Wear, Waitstaff, Spa Attire, Others), By Material (Cotton, Polyester, Wool, Linen, Others), By End User (Hotels, Resorts, Motels, Service Apartments, Cruise Lines, Others), By Distribution Channel (Online, Offline, Wholesale, Direct Procurement, Others) And Competitive Landscape
| Product Code: ETC10583404 | Publication Date: Apr 2025 | Updated Date: Feb 2026 | Product Type: Market Research Report | |
| Publisher: 6Wresearch | Author: Bhawna Singh | No. of Pages: 65 | No. of Figures: 34 | No. of Tables: 19 |
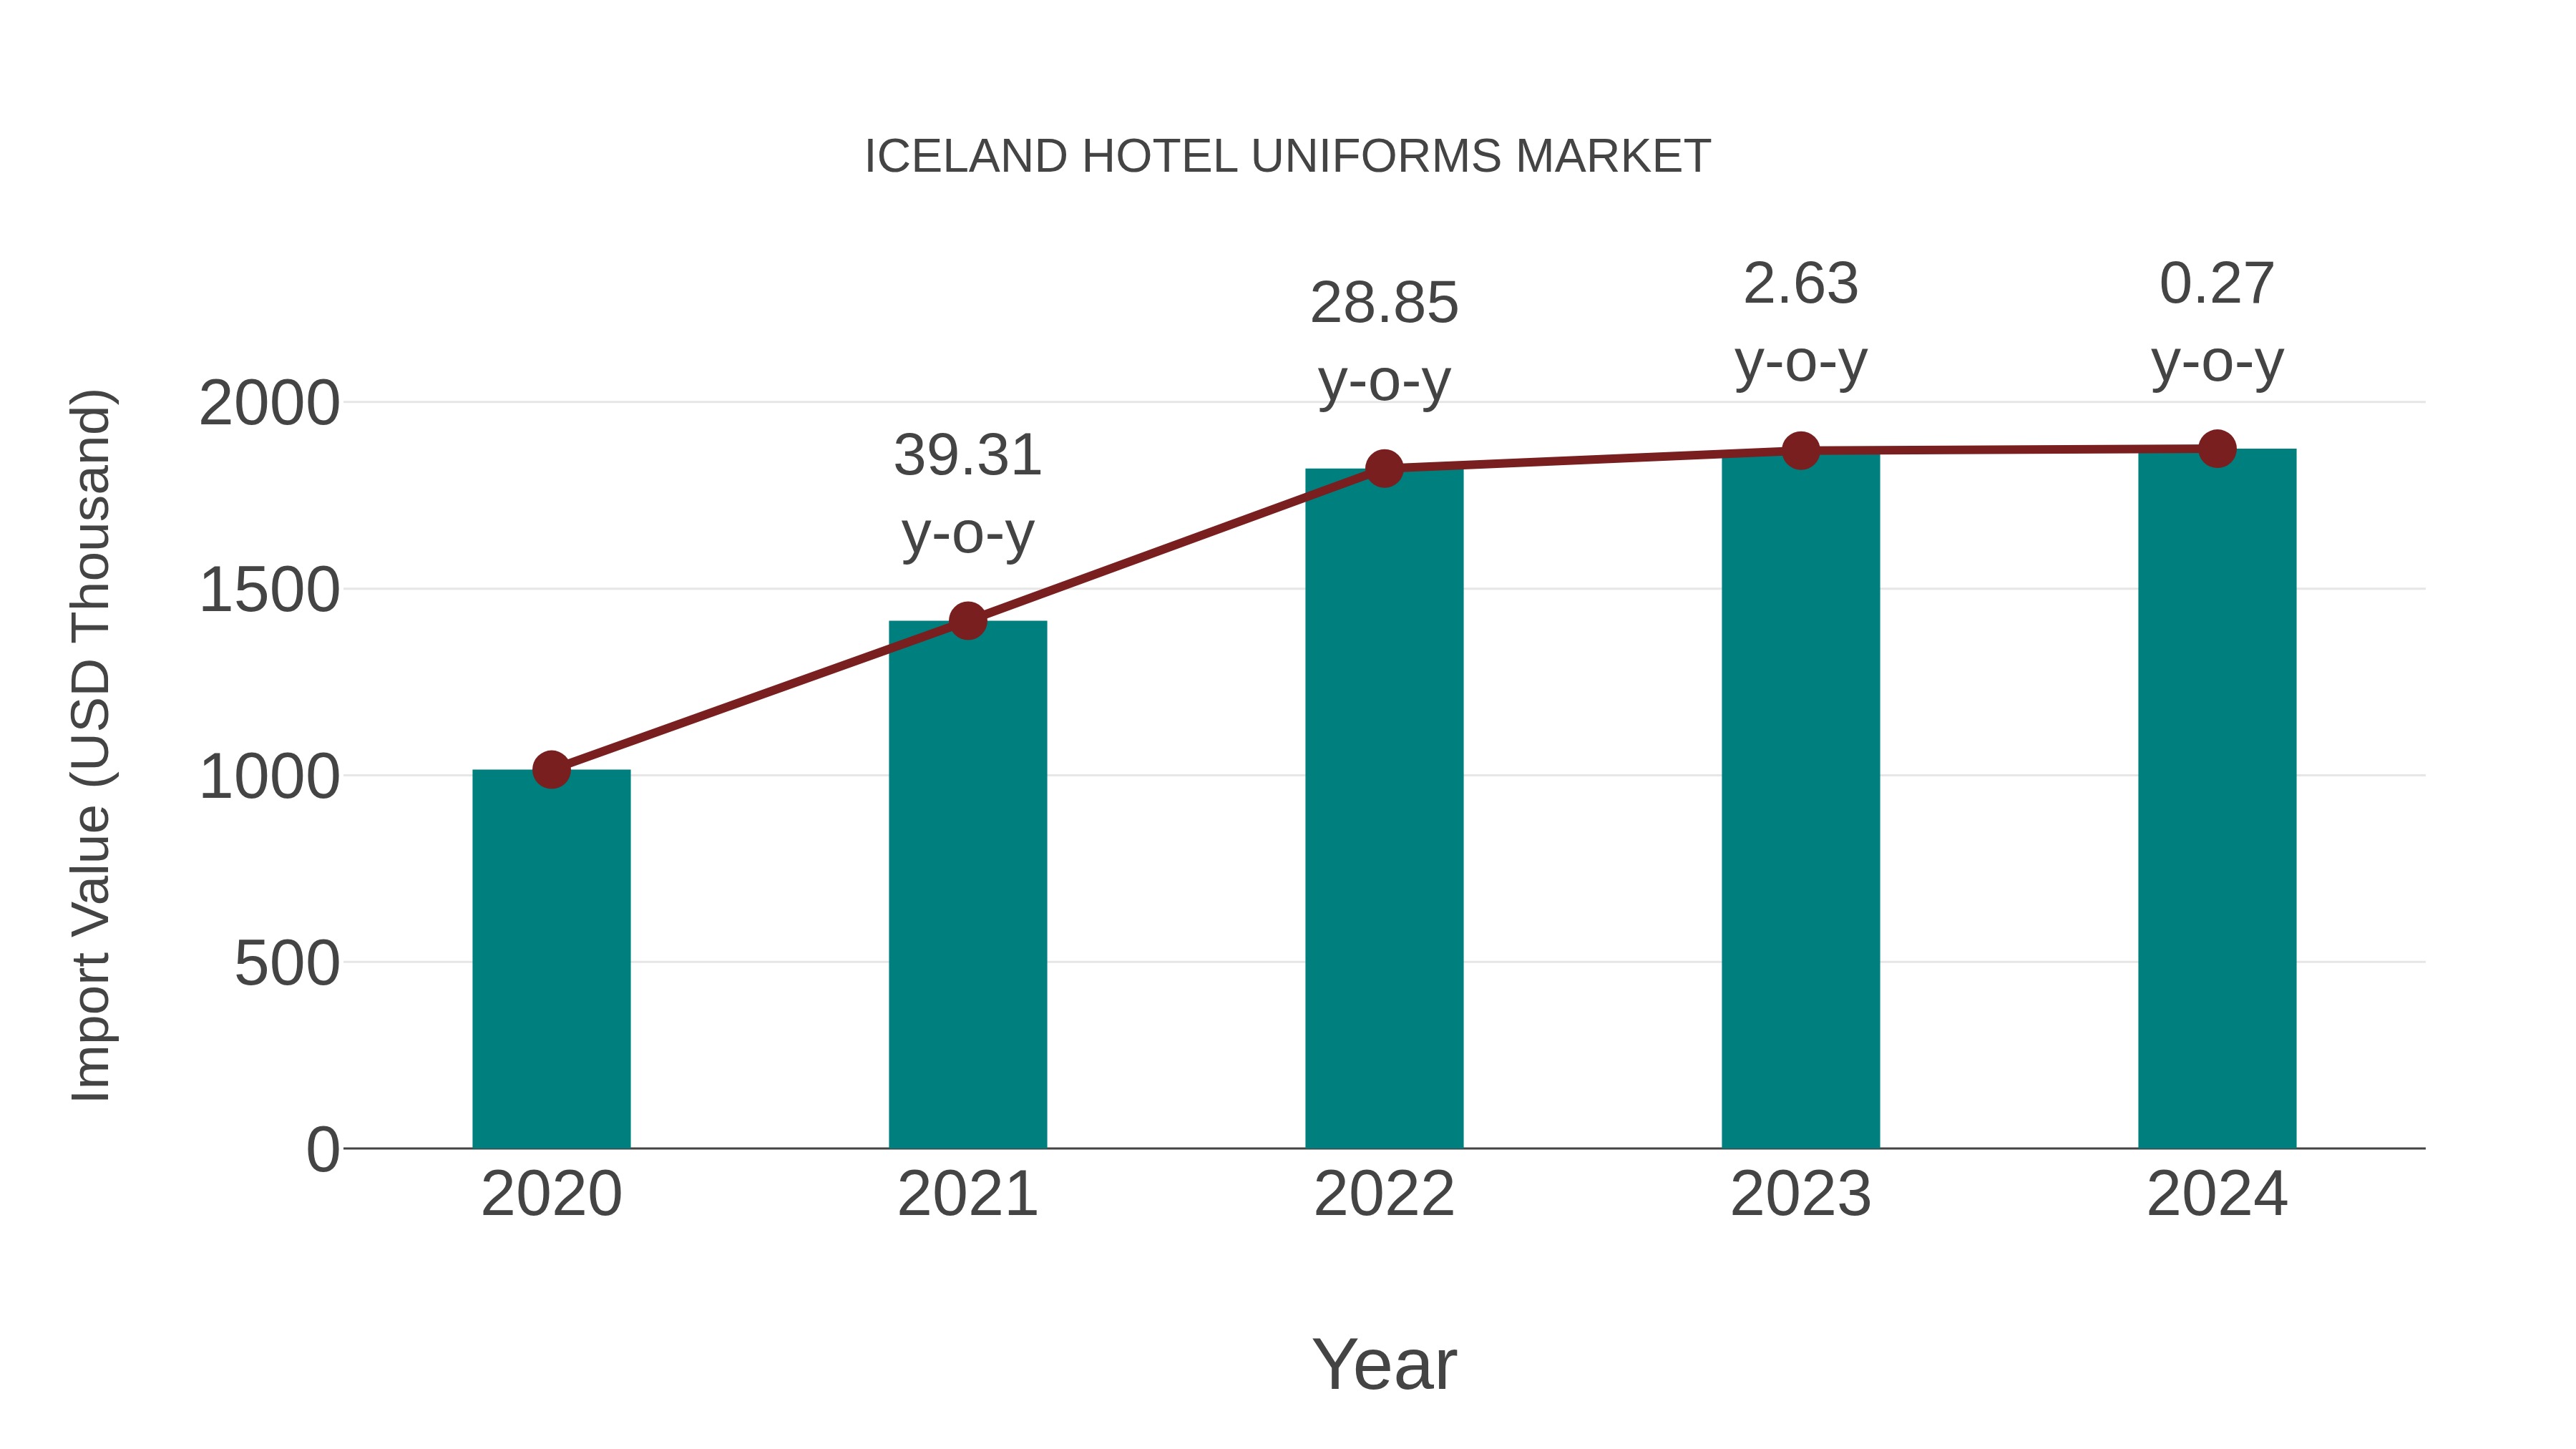
Iceland Hotel Uniforms Market: Import Trend Analysis
The Iceland hotel uniforms market import trend experienced a steady increase from 2020 to 2024. The Compound Annual Growth Rate (CAGR) of 16.58% during 2020-2024, along with a year-on-year growth rate of 0.27% in 2023-2024, contributed to the overall rise in imports during this period.
Key Highlights of the Report:
- Iceland Hotel Uniforms Market Outlook
- Market Size of Iceland Hotel Uniforms Market, 2025
- Forecast of Iceland Hotel Uniforms Market, 2032
- Historical Data and Forecast of Iceland Hotel Uniforms Revenues & Volume for the Period 2022-2032F
- Iceland Hotel Uniforms Market Trend Evolution
- Iceland Hotel Uniforms Market Drivers and Challenges
- Iceland Hotel Uniforms Price Trends
- Iceland Hotel Uniforms Porter's Five Forces
- Iceland Hotel Uniforms Industry Life Cycle
- Historical Data and Forecast of Iceland Hotel Uniforms Market Revenues & Volume By Type for the Period 2022-2032F
- Historical Data and Forecast of Iceland Hotel Uniforms Market Revenues & Volume By Front Desk for the Period 2022-2032F
- Historical Data and Forecast of Iceland Hotel Uniforms Market Revenues & Volume By Housekeeping for the Period 2022-2032F
- Historical Data and Forecast of Iceland Hotel Uniforms Market Revenues & Volume By Chef Wear for the Period 2022-2032F
- Historical Data and Forecast of Iceland Hotel Uniforms Market Revenues & Volume By Waitstaff for the Period 2022-2032F
- Historical Data and Forecast of Iceland Hotel Uniforms Market Revenues & Volume By Spa Attire for the Period 2022 - 2032F
- Historical Data and Forecast of Iceland Hotel Uniforms Market Revenues & Volume By Others for the Period 2022 - 2032F
- Historical Data and Forecast of Iceland Hotel Uniforms Market Revenues & Volume By Material for the Period 2022-2032F
- Historical Data and Forecast of Iceland Hotel Uniforms Market Revenues & Volume By Cotton for the Period 2022-2032F
- Historical Data and Forecast of Iceland Hotel Uniforms Market Revenues & Volume By Polyester for the Period 2022-2032F
- Historical Data and Forecast of Iceland Hotel Uniforms Market Revenues & Volume By Wool for the Period 2022-2032F
- Historical Data and Forecast of Iceland Hotel Uniforms Market Revenues & Volume By Linen for the Period 2022-2032F
- Historical Data and Forecast of Iceland Hotel Uniforms Market Revenues & Volume By Others for the Period 2022 - 2032F
- Historical Data and Forecast of Iceland Hotel Uniforms Market Revenues & Volume By End User for the Period 2022-2032F
- Historical Data and Forecast of Iceland Hotel Uniforms Market Revenues & Volume By Hotels for the Period 2022-2032F
- Historical Data and Forecast of Iceland Hotel Uniforms Market Revenues & Volume By Resorts for the Period 2022-2032F
- Historical Data and Forecast of Iceland Hotel Uniforms Market Revenues & Volume By Motels for the Period 2022-2032F
- Historical Data and Forecast of Iceland Hotel Uniforms Market Revenues & Volume By Service Apartments for the Period 2022-2032F
- Historical Data and Forecast of Iceland Hotel Uniforms Market Revenues & Volume By Cruise Lines for the Period 2022 - 2032F
- Historical Data and Forecast of Iceland Hotel Uniforms Market Revenues & Volume By Others for the Period 2022 - 2032F
- Historical Data and Forecast of Iceland Hotel Uniforms Market Revenues & Volume By Distribution Channel for the Period 2022-2032F
- Historical Data and Forecast of Iceland Hotel Uniforms Market Revenues & Volume By Online for the Period 2022-2032F
- Historical Data and Forecast of Iceland Hotel Uniforms Market Revenues & Volume By Offline for the Period 2022-2032F
- Historical Data and Forecast of Iceland Hotel Uniforms Market Revenues & Volume By Wholesale for the Period 2022-2032F
- Historical Data and Forecast of Iceland Hotel Uniforms Market Revenues & Volume By Direct Procurement for the Period 2022-2032F
- Historical Data and Forecast of Iceland Hotel Uniforms Market Revenues & Volume By Others for the Period 2022 - 2032F
- Iceland Hotel Uniforms Import Export Trade Statistics
- Market Opportunity Assessment By Type
- Market Opportunity Assessment By Material
- Market Opportunity Assessment By End User
- Market Opportunity Assessment By Distribution Channel
- Iceland Hotel Uniforms Top Companies Market Share
- Iceland Hotel Uniforms Competitive Benchmarking By Technical and Operational Parameters
- Iceland Hotel Uniforms Company Profiles
- Iceland Hotel Uniforms Key Strategic Recommendations
Frequently Asked Questions About the Market Study (FAQs):
6Wresearch actively monitors the Iceland Hotel Uniforms Market and publishes its comprehensive annual report, highlighting emerging trends, growth drivers, revenue analysis, and forecast outlook. Our insights help businesses to make data-backed strategic decisions with ongoing market dynamics. Our analysts track relevent industries related to the Iceland Hotel Uniforms Market, allowing our clients with actionable intelligence and reliable forecasts tailored to emerging regional needs.
Yes, we provide customisation as per your requirements. To learn more, feel free to contact us on sales@6wresearch.com
1 Executive Summary |
2 Introduction |
2.1 Key Highlights of the Report |
2.2 Report Description |
2.3 Market Scope & Segmentation |
2.4 Research Methodology |
2.5 Assumptions |
3 Iceland Hotel Uniforms Market Overview |
3.1 Iceland Country Macro Economic Indicators |
3.2 Iceland Hotel Uniforms Market Revenues & Volume, 2022 & 2032F |
3.3 Iceland Hotel Uniforms Market - Industry Life Cycle |
3.4 Iceland Hotel Uniforms Market - Porter's Five Forces |
3.5 Iceland Hotel Uniforms Market Revenues & Volume Share, By Type, 2022 & 2032F |
3.6 Iceland Hotel Uniforms Market Revenues & Volume Share, By Material, 2022 & 2032F |
3.7 Iceland Hotel Uniforms Market Revenues & Volume Share, By End User, 2022 & 2032F |
3.8 Iceland Hotel Uniforms Market Revenues & Volume Share, By Distribution Channel, 2022 & 2032F |
4 Iceland Hotel Uniforms Market Dynamics |
4.1 Impact Analysis |
4.2 Market Drivers |
4.2.1 Growth in the tourism industry in Iceland leading to an increase in the number of hotels and demand for hotel uniforms. |
4.2.2 Emphasis on staff presentation and customer experience in the hospitality sector driving the adoption of quality uniforms. |
4.2.3 Increasing focus on sustainable and eco-friendly practices leading to a demand for environmentally friendly uniform options in hotels. |
4.3 Market Restraints |
4.3.1 Seasonal nature of tourism in Iceland affecting the demand for hotel uniforms during off-peak months. |
4.3.2 Price sensitivity of hotel owners and operators impacting their willingness to invest in high-quality uniforms. |
4.3.3 Limited availability of local suppliers for specialized hotel uniform requirements leading to reliance on imports. |
5 Iceland Hotel Uniforms Market Trends |
6 Iceland Hotel Uniforms Market, By Types |
6.1 Iceland Hotel Uniforms Market, By Type |
6.1.1 Overview and Analysis |
6.1.2 Iceland Hotel Uniforms Market Revenues & Volume, By Type, 2022 - 2032F |
6.1.3 Iceland Hotel Uniforms Market Revenues & Volume, By Front Desk, 2022 - 2032F |
6.1.4 Iceland Hotel Uniforms Market Revenues & Volume, By Housekeeping, 2022 - 2032F |
6.1.5 Iceland Hotel Uniforms Market Revenues & Volume, By Chef Wear, 2022 - 2032F |
6.1.6 Iceland Hotel Uniforms Market Revenues & Volume, By Waitstaff, 2022 - 2032F |
6.1.7 Iceland Hotel Uniforms Market Revenues & Volume, By Spa Attire, 2022 - 2032F |
6.1.8 Iceland Hotel Uniforms Market Revenues & Volume, By Others, 2022 - 2032F |
6.2 Iceland Hotel Uniforms Market, By Material |
6.2.1 Overview and Analysis |
6.2.2 Iceland Hotel Uniforms Market Revenues & Volume, By Cotton, 2022 - 2032F |
6.2.3 Iceland Hotel Uniforms Market Revenues & Volume, By Polyester, 2022 - 2032F |
6.2.4 Iceland Hotel Uniforms Market Revenues & Volume, By Wool, 2022 - 2032F |
6.2.5 Iceland Hotel Uniforms Market Revenues & Volume, By Linen, 2022 - 2032F |
6.2.6 Iceland Hotel Uniforms Market Revenues & Volume, By Others, 2022 - 2032F |
6.3 Iceland Hotel Uniforms Market, By End User |
6.3.1 Overview and Analysis |
6.3.2 Iceland Hotel Uniforms Market Revenues & Volume, By Hotels, 2022 - 2032F |
6.3.3 Iceland Hotel Uniforms Market Revenues & Volume, By Resorts, 2022 - 2032F |
6.3.4 Iceland Hotel Uniforms Market Revenues & Volume, By Motels, 2022 - 2032F |
6.3.5 Iceland Hotel Uniforms Market Revenues & Volume, By Service Apartments, 2022 - 2032F |
6.3.6 Iceland Hotel Uniforms Market Revenues & Volume, By Cruise Lines, 2022 - 2032F |
6.3.7 Iceland Hotel Uniforms Market Revenues & Volume, By Others, 2022 - 2032F |
6.4 Iceland Hotel Uniforms Market, By Distribution Channel |
6.4.1 Overview and Analysis |
6.4.2 Iceland Hotel Uniforms Market Revenues & Volume, By Online, 2022 - 2032F |
6.4.3 Iceland Hotel Uniforms Market Revenues & Volume, By Offline, 2022 - 2032F |
6.4.4 Iceland Hotel Uniforms Market Revenues & Volume, By Wholesale, 2022 - 2032F |
6.4.5 Iceland Hotel Uniforms Market Revenues & Volume, By Direct Procurement, 2022 - 2032F |
6.4.6 Iceland Hotel Uniforms Market Revenues & Volume, By Others, 2022 - 2032F |
7 Iceland Hotel Uniforms Market Import-Export Trade Statistics |
7.1 Iceland Hotel Uniforms Market Export to Major Countries |
7.2 Iceland Hotel Uniforms Market Imports from Major Countries |
8 Iceland Hotel Uniforms Market Key Performance Indicators |
8.1 Employee satisfaction with uniforms provided. |
8.2 Rate of adoption of sustainable uniform options. |
8.3 Percentage of hotels investing in custom uniform designs. |
8.4 Customer feedback on staff appearance and presentation. |
8.5 Uniform durability and longevity ratings by hotel management. |
9 Iceland Hotel Uniforms Market - Opportunity Assessment |
9.1 Iceland Hotel Uniforms Market Opportunity Assessment, By Type, 2022 & 2032F |
9.2 Iceland Hotel Uniforms Market Opportunity Assessment, By Material, 2022 & 2032F |
9.3 Iceland Hotel Uniforms Market Opportunity Assessment, By End User, 2022 & 2032F |
9.4 Iceland Hotel Uniforms Market Opportunity Assessment, By Distribution Channel, 2022 & 2032F |
10 Iceland Hotel Uniforms Market - Competitive Landscape |
10.1 Iceland Hotel Uniforms Market Revenue Share, By Companies, 2025 |
10.2 Iceland Hotel Uniforms Market Competitive Benchmarking, By Operating and Technical Parameters |
11 Company Profiles |
12 Recommendations |
13 Disclaimer |
Export potential assessment - trade Analytics for 2030
Export potential enables firms to identify high-growth global markets with greater confidence by combining advanced trade intelligence with a structured quantitative methodology. The framework analyzes emerging demand trends and country-level import patterns while integrating macroeconomic and trade datasets such as GDP and population forecasts, bilateral import–export flows, tariff structures, elasticity differentials between developed and developing economies, geographic distance, and import demand projections. Using weighted trade values from 2020–2024 as the base period to project country-to-country export potential for 2030, these inputs are operationalized through calculated drivers such as gravity model parameters, tariff impact factors, and projected GDP per-capita growth. Through an analysis of hidden potentials, demand hotspots, and market conditions that are most favorable to success, this method enables firms to focus on target countries, maximize returns, and global expansion with data, backed by accuracy.
By factoring in the projected importer demand gap that is currently unmet and could be potential opportunity, it identifies the potential for the Exporter (Country) among 190 countries, against the general trade analysis, which identifies the biggest importer or exporter.
To discover high-growth global markets and optimize your business strategy:
Click Here
Pricing
- Single User License$ 1,995
- Department License$ 2,400
- Site License$ 3,120
- Global License$ 3,795

Search
Thought Leadership and Analyst Meet


Our Clients
Latest Reports
- France Thermally Conductive Filler Dispersants Market (2026-2032) | Challenges, Restraints, Value, Share, Size, segmentation, Analysis, Trends, Investment Opportunities, Outlook, Pricing, Demand, Forecast, Revenue, Companies, Growth, Drivers, Strategy, Insights, Competition
- Egypt Thermally Conductive Filler Dispersants Market (2026-2032) | Competition, Forecast, Strategy, Value, Insights, Outlook, Investment Opportunities, Pricing, Demand, Share, segmentation, Drivers, Size, Companies, Restraints, Growth, Trends, Revenue, Challenges, Analysis
- Czech Republic Thermally Conductive Filler Dispersants Market (2026-2032) | Forecast, Pricing, Analysis, Drivers, Insights, Size, Demand, Growth, Challenges, segmentation, Competition, Outlook, Trends, Investment Opportunities, Companies, Strategy, Revenue, Share, Value, Restraints
- Colombia Thermally Conductive Filler Dispersants Market (2026-2032) | segmentation, Trends, Share, Drivers, Strategy, Companies, Demand, Insights, Size, Challenges, Value, Competition, Analysis, Growth, Revenue, Restraints, Forecast, Pricing, Outlook, Investment Opportunities
- China Thermally Conductive Filler Dispersants Market (2026-2032) | Restraints, Investment Opportunities, Pricing, Companies, Share, Size, Challenges, Trends, Outlook, Value, Analysis, Competition, Revenue, Drivers, Forecast, Demand, Insights, Growth, Strategy, segmentation
- Chile Thermally Conductive Filler Dispersants Market (2026-2032) | Investment Opportunities, Trends, Value, Restraints, Share, Companies, Forecast, segmentation, Pricing, Challenges, Demand, Size, Analysis, Drivers, Outlook, Growth, Competition, Strategy, Revenue, Insights
- Cambodia Thermally Conductive Filler Dispersants Market (2026-2032) | Analysis, Share, Outlook, Strategy, Pricing, Demand, Size, Growth, segmentation, Insights, Revenue, Forecast, Challenges, Competition, Companies, Investment Opportunities, Trends, Restraints, Value, Drivers
- Brazil Thermally Conductive Filler Dispersants Market (2026-2032) | Restraints, Forecast, Competition, Size, Revenue, Value, Investment Opportunities, Trends, Insights, Outlook, Growth, Analysis, Drivers, segmentation, Pricing, Challenges, Strategy, Share, Companies, Demand
- Bangladesh Thermally Conductive Filler Dispersants Market (2026-2032) | Restraints, Trends, Analysis, Competition, Insights, Forecast, Value, Investment Opportunities, Pricing, Share, Demand, Outlook, Revenue, segmentation, Companies, Drivers, Growth, Size, Challenges, Strategy
- Bahrain Thermally Conductive Filler Dispersants Market (2026-2032) | Trends, Outlook, Pricing, Demand, Value, Competition, Forecast, Growth, segmentation, Revenue, Companies, Analysis, Insights, Size, Drivers, Challenges, Strategy, Investment Opportunities, Share, Restraints
Industry Events and Analyst Meet

HIMTEX 2026

India Refining Summit 2026

India EV Show 2026

EV tech India Expo 2026

Auto Tech Asia 2026
Whitepaper
- Middle East & Africa Commercial Security Market Click here to view more.
- Middle East & Africa Fire Safety Systems & Equipment Market Click here to view more.
- GCC Drone Market Click here to view more.
- Middle East Lighting Fixture Market Click here to view more.
- GCC Physical & Perimeter Security Market Click here to view more.
6WResearch In News
- Doha a strategic location for EV manufacturing hub: IPA Qatar
- Demand for luxury TVs surging in the GCC, says Samsung
- Empowering Growth: The Thriving Journey of Bangladesh’s Cable Industry
- Demand for luxury TVs surging in the GCC, says Samsung
- Video call with a traditional healer? Once unthinkable, it’s now common in South Africa
- Intelligent Buildings To Smooth GCC’s Path To Net Zero