India Converted Paper Products Market (2026-2032) | Share, Growth, Outlook, Revenue, Size, Industry, Companies, Forecast, Trends, Value & Analysis
Market Forecast By Type (Paperboard Container, Sanitary Paper Product, Stationery Product, Paper Bag And Coated And Treated Paper, Other), By End-Users (Packaging & Wrapping, Food Service, Printing, Others) And Competitive Landscape
| Product Code: ETC039125 | Publication Date: Jun 2023 | Updated Date: Jun 2026 | Product Type: Report | |
| Publisher: 6Wresearch | Author: Ravi Bhandari | No. of Pages: 70 | No. of Figures: 35 | No. of Tables: 5 |
India Converted Paper Products Market Summary
The india converted paper products market was estimated at USD 315 Million in 2025 and is projected to reach USD 452 Million by 2032, growing at a CAGR of 7.7% from 2026 to 2032.
India Converted Paper Products Market Growth Rate Analysis (2021-2032)
The India Converted Paper Products market has shown impressive recovery and growth after a downturn in 2021, where it contracted by 3.0%. The resurgence began in 2022 with a strong increase of 9.5%, fueled by rising consumer demand and significant investments in sustainable packaging solutions. Forecasts indicate steady growth rates of 7.6% for both 2023 and 2024, as industries increasingly shift towards eco-friendly materials amidst the energy transition and digitalization trends. As we look further, growth is expected to stabilize at around 6.6% annually from 2029 to 2030, reflecting ongoing industrial advancements and government policies aimed at promoting green practices. This market's dynamics are increasingly influenced by consumer preferences and technological innovations, paving the way for long-term sustainability.
India Converted Paper Products Market Year-wise Growth Rate and Key Drivers
This graph highlights how the India Converted Paper Products Market has steadily grown over the past five years, supported by major growth factors.
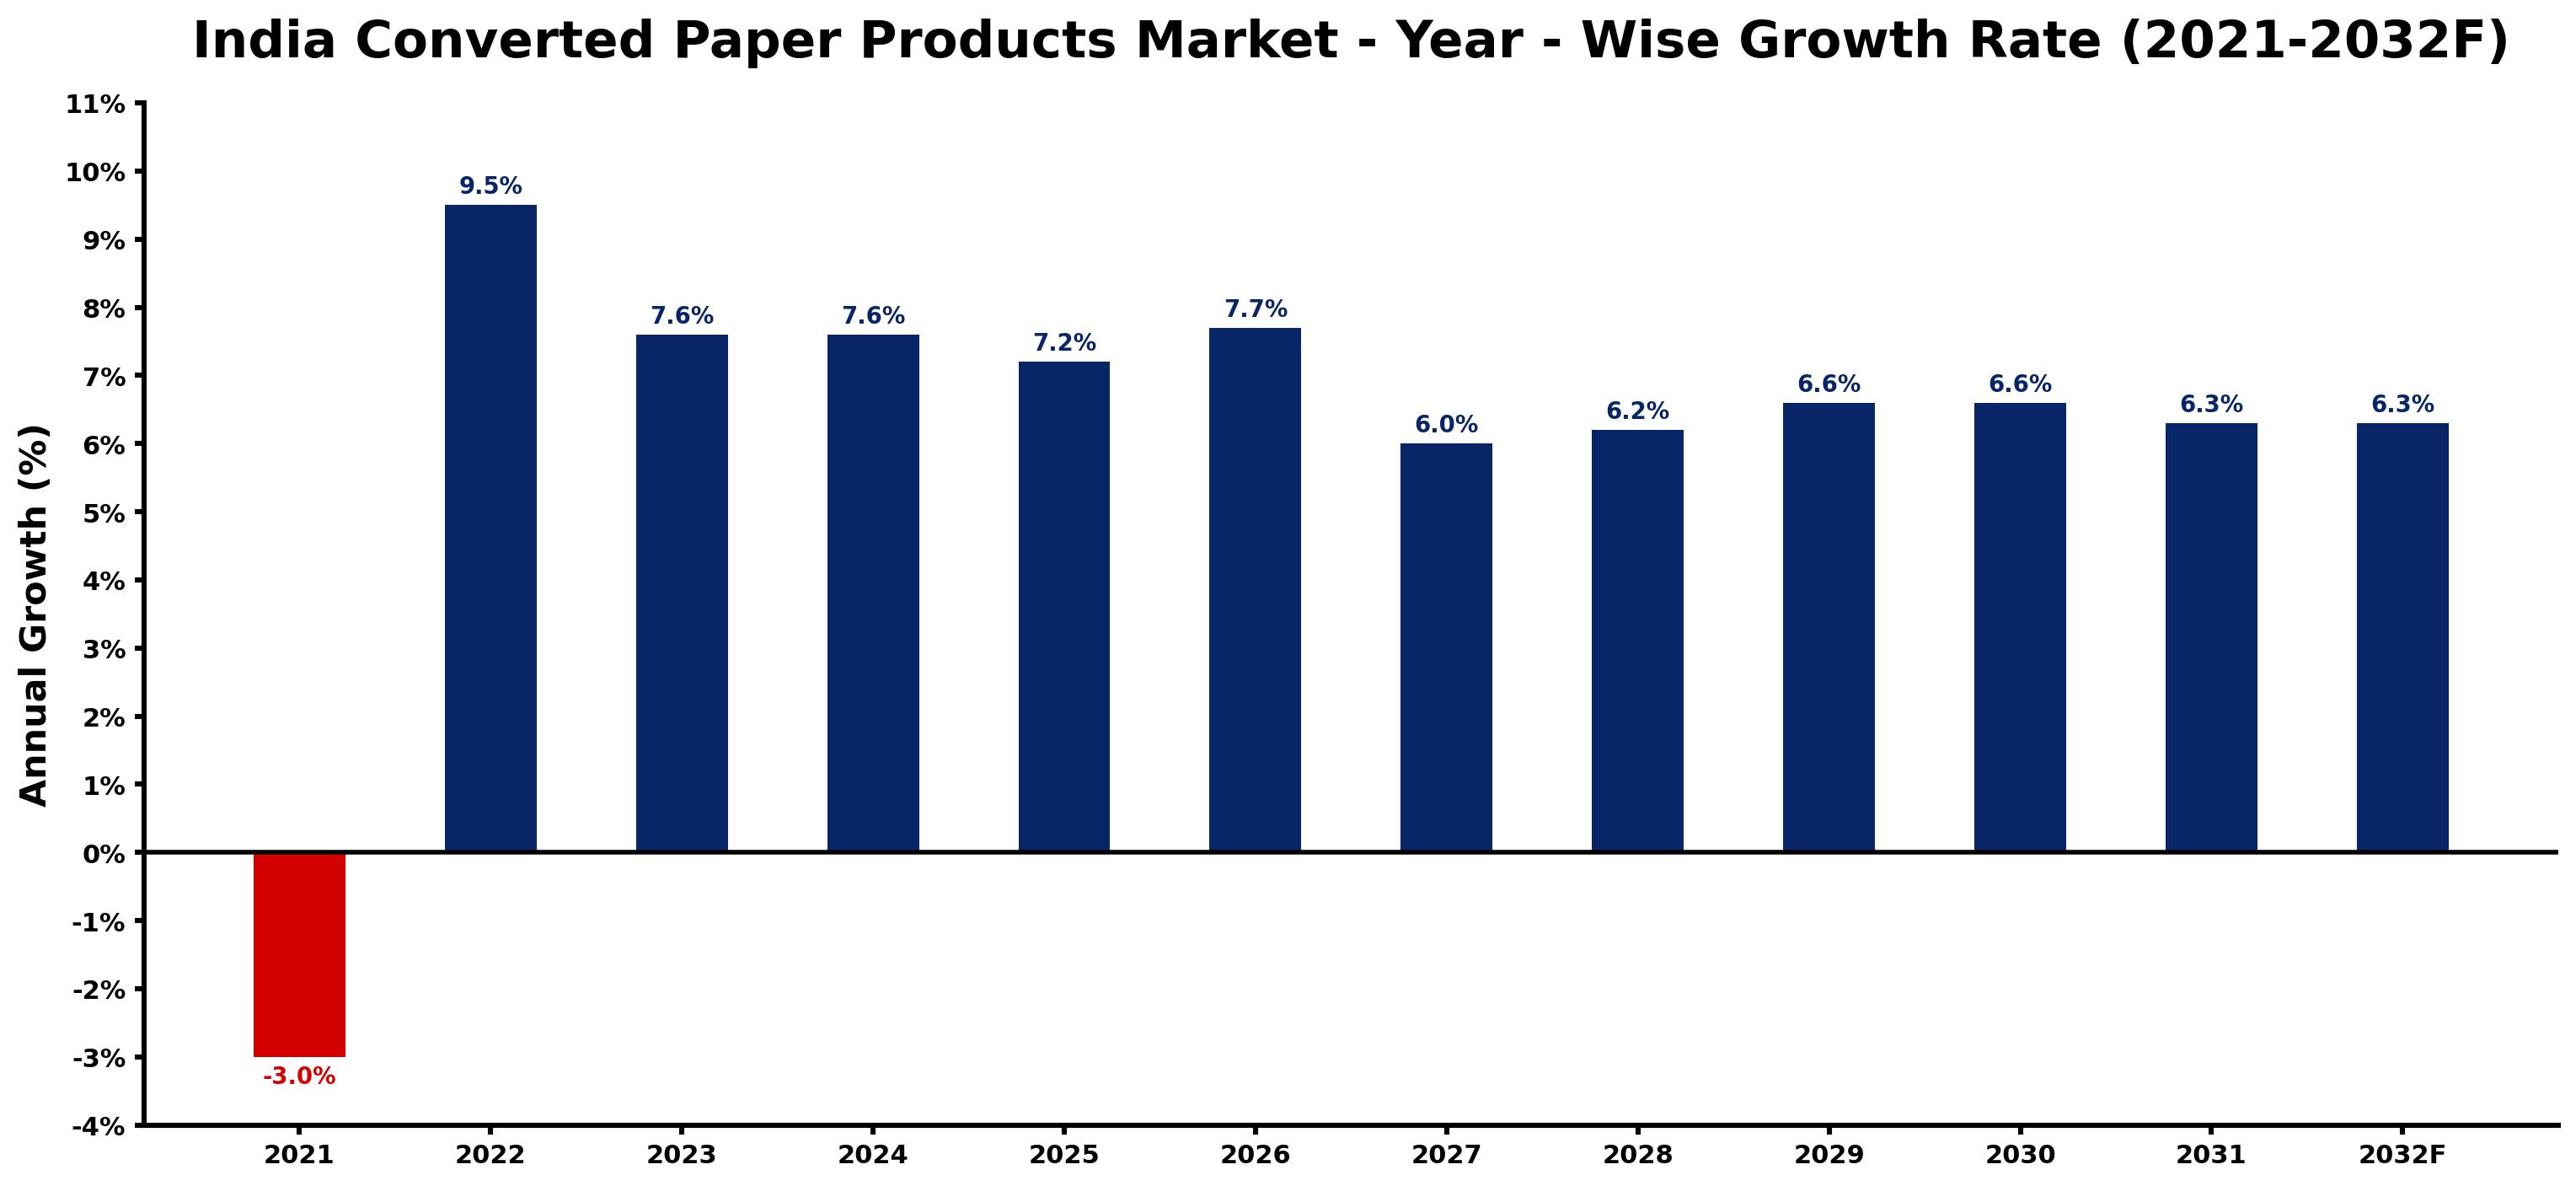
The table below presents the year wise growth rates along with the key drivers influencing the market
| Year | Growth Rate | Major Drivers |
| 2021 | -3.0% | Increased digitalization led to a significant decline in demand for traditional paper products across various sectors. |
| 2022 | 9.5% | Manufacturers began investing in advanced machinery to enhance production efficiency substantially. |
| 2023 | 7.6% | Urbanization trends drive consumer preferences for eco-friendly paper products across urban centers. |
| 2024 | 7.6% | Retail sectors increasingly favor biodegradable packaging to align with environmental consciousness. |
| 2025 | 7.2% | E-commerce expansion necessitates innovative packaging solutions to boost customer experience effectively. |
| 2026 | 7.7% | Local businesses prioritize sourcing recycled paper products, promoting a circular economy model. |
| 2027 | 6.0% | Technological innovations streamline supply chains, reducing costs while improving product quality. |
| 2028 | 6.2% | Education campaigns highlight sustainability benefits, influencing consumer habits towards eco-friendly choices. |
| 2029 | 6.6% | Corporate social responsibility initiatives encourage firms to adopt environmentally sustainable practices. |
| 2030 | 6.6% | Investment in renewable energy sources enhances the production capabilities of paper manufacturers. |
| 2031 | 6.3% | International trade agreements facilitate market access for high-quality converted paper products. |
| 2032 | 6.3% | Consumer awareness of environmental impacts drives increased demand for converted paper packaging. |
Note - Market size estimations and growth projections presented in this report are based on 6Wresearch's advanced forecasting approach, validated with industry datasets as of June 2026.
India Converted Paper Products Market Synopsis
The India Converted Paper Products Market is projected to reach 7.7% and witness significant growth during the forecast period (2026-2032). This expansion is primarily driven by the increased demand for packaging solutions, heightened literacy rates, and growing public awareness regarding hygiene and sanitation standards. India's position as one of the leading producers of writing and printing paper, along with its reputation for low-cost production capabilities, positions it favorably in the global market.
India Converted Paper Products Market Growth Drivers
Several key factors are influencing the growth trajectory of the India Converted Paper Products Market:
- Increasing Demand for Eco-Friendly Packaging: The expanding e-commerce sector and the fast-moving consumer goods (FMCG) industry are shifting towards biodegradable and eco-friendly packaging solutions, propelling the demand for paper-based products.
- Rise in Disposable Income: As disposable incomes rise across urban and semi-urban areas, consumers are increasingly purchasing stationery and related products, enhancing overall market growth.
- Higher Literacy Rates: An increase in literacy rates has led to a surge in educational institutions, resulting in greater consumption of stationery such as notebooks, exercise books, and other educational materials.
- Health and Hygiene Awareness: Growing public consciousness regarding hygiene is driving the demand for sanitary products, significantly contributing to market expansion.
- Government Support for Sustainable Practices: Various government policies and initiatives promoting environmental sustainability are encouraging the adoption of paper products over plastic alternatives, further stimulating market growth.
India Converted Paper Products Market Challenges and Restraints
Despite the positive growth outlook, the India Converted Paper Products Market faces several challenges that could impede progress:
- Availability of Substitutes: The presence of cheaper substitutes, particularly plastics, poses a competitive threat to paper products. Although there is a shift towards sustainable options, the initial cost and convenience of alternatives can deter widespread adoption.
- High Production Costs: Rising labor costs and volatile taxation policies present significant challenges for manufacturers, placing pressure on profit margins and making it difficult to compete with international markets.
- Environmental Concerns: While paper products are more sustainable than plastics, intensive production processes can still be environmentally damaging, prompting scrutiny from regulatory bodies and consumers alike.
- Market Volatility: Fluctuations in raw material prices can impact production costs, which may deter investment and growth in the paper products sector.
- Technological Advancements: The fast-paced evolution of manufacturing technologies necessitates continuous investment in updates to remain competitive, placing additional financial burdens on smaller firms.
India Converted Paper Products Market Trends and Opportunities
The India Converted Paper Products Market is poised for notable trends and opportunities that can further bolster growth:
- Digital Transformation: The integration of digitization in operations is evolving traditional production methods. Companies are investing in automation, which can enhance efficiency and reduce costs, opening doors for new market entrants.
- Sustainable Product Innovation: Manufacturers are exploring innovative paper products that cater to specific market needs, such as recyclable materials and biodegradable packaging options, which align with consumer preferences for sustainability.
- Growth in Niche Markets: Demand is rising in niche segments like specialty papers, which are used in high-end packaging and premium stationery, providing lucrative opportunities for businesses targeting these sectors.
- Expansion of Retail Channels: The increase in organized retail and online shopping platforms offers manufacturers improved access to consumers, facilitating greater distribution of paper products.
- Collaborations and Partnerships: Strategic alliances between manufacturers and e-commerce platforms can enhance market reach, streamline supply chains, and foster innovative product development.
India Converted Paper Products Market Government Investment and Initiatives
The Indian government is actively supporting the growth of the Converted Paper Products Market through various initiatives and policies:
- Incentives for Sustainable Practices: The government has implemented financial incentives for companies that invest in sustainable manufacturing processes, encouraging eco-friendly production methods in the paper industry.
- Public Awareness Campaigns: Initiatives aimed at promoting hygiene and sanitation have heightened demand for paper products, particularly in the educational and healthcare sectors.
- Investment in Infrastructure: The government is investing in enhancing infrastructure in rural areas, which can improve access to paper products and stimulate regional market growth.
- Regulatory Frameworks: Policies aimed at reducing plastic usage are creating a favorable environment for paper products, as companies seek to comply with increasingly stringent regulations.
- Support for Research and Development: Government funding for research into new paper products and sustainable resources is paving the way for innovation within the industry.
India Converted Paper Products Market Latest Developments (May 2025 - June 2026)
The period from May 2025 to June 2026 has seen significant shifts within the India Converted Paper Products Market, reflecting global trends and local needs:
- Increased Focus on Sustainability: There has been a notable surge in initiatives aimed at reducing carbon footprints, with more manufacturers committing to sustainable practices in their production processes.
- Adoption of Advanced Technologies: The industry is witnessing the integration of AI and IoT technologies in manufacturing, enhancing operational efficiency and product quality.
- Expansion of E-Commerce Packaging Solutions: The growth of e-commerce has driven innovations in packaging, leading to the development of specialized paper products designed for safe and sustainable delivery.
- Collaboration with NGOs: Many companies are partnering with non-governmental organizations to promote recycling and environmental education, fostering a more responsible consumption culture.
- Government Policy Revisions: New policies aimed at promoting renewable resources and sustainable manufacturing have been rolled out, impacting pricing and production dynamics across the market.
India Converted Paper Products Market - Key Attractiveness of the Report
- 10 Years of Market Numbers
- Historical Data Starting from 2022 to 2025
- Base Year: 2025
- Forecast Data until 2032
- Key Performance Indicators Impacting the Market
- Major Upcoming Developments and Projects
Key Highlights of the Report:
- India Converted Paper Products Market Outlook
- Market Size of India Converted Paper Products Market, 2025
- Forecast of India Converted Paper Products Market, 2032
- Historical Data and Forecast of India Converted Paper Products Revenues & Volume for the Period 2022-2032F
- India Converted Paper Products Market Trend Evolution
- India Converted Paper Products Market Drivers and Challenges
- India Converted Paper Products Price Trends
- India Converted Paper Products Porter's Five Forces
- India Converted Paper Products Industry Life Cycle
- Historical Data and Forecast of India Converted Paper Products Market Revenues & Volume By Type for the Period 2022-2032F
- Historical Data and Forecast of India Converted Paper Products Market Revenues & Volume By Paperboard Container for the Period 2022-2032F
- Historical Data and Forecast of India Converted Paper Products Market Revenues & Volume By Sanitary Paper Product for the Period 2022-2032F
- Historical Data and Forecast of India Converted Paper Products Market Revenues & Volume By Stationery Product for the Period 2022-2032F
- Historical Data and Forecast of India Converted Paper Products Market Revenues & Volume By Paper Bag And Coated And Treated Paper for the Period 2022-2032F
- Historical Data and Forecast of India Converted Paper Products Market Revenues & Volume By Other for the Period 2022-2032F
- Historical Data and Forecast of India Converted Paper Products Market Revenues & Volume By End-Users for the Period 2022-2032F
- Historical Data and Forecast of India Converted Paper Products Market Revenues & Volume By Packaging & Wrapping for the Period 2022-2032F
- Historical Data and Forecast of India Converted Paper Products Market Revenues & Volume By Food Service for the Period 2022-2032F
- Historical Data and Forecast of India Converted Paper Products Market Revenues & Volume By Printing for the Period 2022-2032F
- Historical Data and Forecast of India Converted Paper Products Market Revenues & Volume By Others for the Period 2022-2032F
- India Converted Paper Products Import Export Trade Statistics
- Market Opportunity Assessment By Type
- Market Opportunity Assessment By End-Users
- India Converted Paper Products Top Companies Market Share
- India Converted Paper Products Competitive Benchmarking By Technical and Operational Parameters
- India Converted Paper Products Company Profiles
- India Converted Paper Products Key Strategic Recommendations
Frequently Asked Questions About the Market Study (FAQs):
The growth of the India Converted Paper Products Market is primarily driven by increasing demand for packaging solutions, rising literacy rates, and heightened awareness of hygiene and sanitation.
Key challenges include the availability of cheaper substitutes like plastics, high production costs, and environmental concerns associated with paper manufacturing.
Government investment in sustainable practices, public awareness campaigns, and regulatory frameworks aimed at reducing plastic usage are positively impacting the market.
Emerging trends include a focus on sustainability, the adoption of advanced manufacturing technologies, and the growth of niche markets catering to specific consumer needs.
6Wresearch actively monitors the India Converted Paper Products Market and publishes its comprehensive annual report, highlighting emerging trends, growth drivers, revenue analysis, and forecast outlook. Our insights help businesses to make data-backed strategic decisions with ongoing market dynamics. Our analysts track relevent industries related to the India Converted Paper Products Market, allowing our clients with actionable intelligence and reliable forecasts tailored to emerging regional needs.
Yes, we provide customisation as per your requirements. To learn more, feel free to contact us on sales@6wresearch.com
1 Executive Summary |
2 Introduction |
2.1 Key Highlights of the Report |
2.2 Report Description |
2.3 Market Scope & Segmentation |
2.4 Research Methodology |
2.5 Assumptions |
3 India Converted Paper Products Market Overview |
3.1 India Country Macro Economic Indicators |
3.2 India Converted Paper Products Market Revenues & Volume, 2022 & 2032F |
3.3 India Converted Paper Products Market - Industry Life Cycle |
3.4 India Converted Paper Products Market - Porter's Five Forces |
3.5 India Converted Paper Products Market Revenues & Volume Share, By Type, 2022 & 2032F |
3.6 India Converted Paper Products Market Revenues & Volume Share, By End-Users, 2022 & 2032F |
4 India Converted Paper Products Market Dynamics |
4.1 Impact Analysis |
4.2 Market Drivers |
4.2.1 Growing awareness and demand for sustainable and eco-friendly products |
4.2.2 Increasing disposable income leading to higher consumer spending on premium paper products |
4.2.3 Government initiatives promoting the use of recycled paper and reducing plastic usage |
4.3 Market Restraints |
4.3.1 Fluctuating raw material prices affecting production costs |
4.3.2 Intense competition from alternative packaging materials like plastics and digital solutions |
4.3.3 Challenges in waste management and recycling infrastructure |
5 India Converted Paper Products Market Trends |
6 India Converted Paper Products Market, By Types |
6.1 India Converted Paper Products Market, By Type |
6.1.1 Overview and Analysis |
6.1.2 India Converted Paper Products Market Revenues & Volume, By Type, 2022-2032F |
6.1.3 India Converted Paper Products Market Revenues & Volume, By Paperboard Container, 2022-2032F |
6.1.4 India Converted Paper Products Market Revenues & Volume, By Sanitary Paper Product, 2022-2032F |
6.1.5 India Converted Paper Products Market Revenues & Volume, By Stationery Product, 2022-2032F |
6.1.6 India Converted Paper Products Market Revenues & Volume, By Paper Bag And Coated And Treated Paper, 2022-2032F |
6.1.7 India Converted Paper Products Market Revenues & Volume, By Other, 2022-2032F |
6.2 India Converted Paper Products Market, By End-Users |
6.2.1 Overview and Analysis |
6.2.2 India Converted Paper Products Market Revenues & Volume, By Packaging & Wrapping, 2022-2032F |
6.2.3 India Converted Paper Products Market Revenues & Volume, By Food Service, 2022-2032F |
6.2.4 India Converted Paper Products Market Revenues & Volume, By Printing, 2022-2032F |
6.2.5 India Converted Paper Products Market Revenues & Volume, By Others, 2022-2032F |
7 India Converted Paper Products Market Import-Export Trade Statistics |
7.1 India Converted Paper Products Market Export to Major Countries |
7.2 India Converted Paper Products Market Imports from Major Countries |
8 India Converted Paper Products Market Key Performance Indicators |
8.1 Percentage of recycled content used in paper products |
8.2 Consumer awareness and perception surveys on sustainability and eco-friendliness |
8.3 Adoption rate of digital solutions for communication and documentation in place of paper |
9 India Converted Paper Products Market - Opportunity Assessment |
9.1 India Converted Paper Products Market Opportunity Assessment, By Type, 2022 & 2032F |
9.2 India Converted Paper Products Market Opportunity Assessment, By End-Users, 2022 & 2032F |
10 India Converted Paper Products Market - Competitive Landscape |
10.1 India Converted Paper Products Market Revenue Share, By Companies, 2025 |
10.2 India Converted Paper Products Market Competitive Benchmarking, By Operating and Technical Parameters |
11 Company Profiles |
12 Recommendations |
13 Disclaimer |
Global Go To Market Strategy - 2030
Export potential enables firms to identify high-growth global markets with greater confidence by combining advanced trade intelligence with a structured quantitative methodology. The framework analyzes emerging demand trends and country-level import patterns while integrating macroeconomic and trade datasets such as GDP and population forecasts, bilateral import–export flows, tariff structures, elasticity differentials between developed and developing economies, geographic distance, and import demand projections. Using weighted trade values from 2020–2024 as the base period to project country-to-country export potential for 2030, these inputs are operationalized through calculated drivers such as gravity model parameters, tariff impact factors, and projected GDP per-capita growth. Through an analysis of hidden potentials, demand hotspots, and market conditions that are most favorable to success, this method enables firms to focus on target countries, maximize returns, and global expansion with data, backed by accuracy.
By factoring in the projected importer demand gap that is currently unmet and could be potential opportunity, it identifies the potential for the Exporter (Country) among 190 countries, against the general trade analysis, which identifies the biggest importer or exporter.
To discover high-growth global markets and optimize your business strategy:
Click Here
Pricing
- Single User License$ 1,995
- Department License$ 2,400
- Site License$ 3,120
- Global License$ 3,795

Leadership Perspectives from Industry Events
Search
Thought Leadership and Analyst Meet


Our Clients
6WResearch In News
- India Air Conditioner Market Set for Strong Rebound in 2026 After Weather-Led Correction and GST-Driven Recovery: 6Wresearch
- ADAS in India: How Automatic Emergency Braking, Blind Spot Detection & Driver Monitoring are Transforming Road Safety
- Doha a strategic location for EV manufacturing hub: IPA Qatar
- Demand for luxury TVs surging in the GCC, says Samsung
- Empowering Growth: The Thriving Journey of Bangladesh’s Cable Industry
- Demand for luxury TVs surging in the GCC, says Samsung
Latest Reports
- Nicaragua RPG Gaming Market (2026-2032)
- New Zealand RPG Gaming Market (2026-2032)
- Netherlands RPG Gaming Market (2026-2032)
- Nauru RPG Gaming Market (2026-2032)
- Namibia RPG Gaming Market (2026-2032)
- Mozambique RPG Gaming Market (2026-2032)
- Montenegro RPG Gaming Market (2026-2032)
- Mongolia RPG Gaming Market (2026-2032)
- Monaco RPG Gaming Market (2026-2032)
- Micronesia RPG Gaming Market (2026-2032)
Industry Events and Analyst Meet

HIMTEX 2026

India Refining Summit 2026

India EV Show 2026

EV tech India Expo 2026

Auto Tech Asia 2026
Whitepaper
- Middle East & Africa Commercial Security Market Click here to view more.
- Middle East & Africa Fire Safety Systems & Equipment Market Click here to view more.
- GCC Drone Market Click here to view more.
- Middle East Lighting Fixture Market Click here to view more.
- GCC Physical & Perimeter Security Market Click here to view more.