India Food Inclusions Market (2025-2031) Outlook | Industry, Forecast, Size, Revenue, Trends, Share, Analysis, Companies, Growth & Value
Market Forecast By Type (Chocolate, Fruit & Nut, Cereal, Confectionery), By Application (Cereal Products, Snacks & Bars, Bakery Products, Dairy & Frozen Desserts, Chocolate & Confectionery Products), By Source (Microorganisms, Animals, Plant) And Competitive Landscape
| Product Code: ETC4537105 | Publication Date: Jul 2023 | Updated Date: Nov 2025 | Product Type: Report | |
| Publisher: 6Wresearch | Author: Ravi Bhandari | No. of Pages: 85 | No. of Figures: 45 | No. of Tables: 25 |
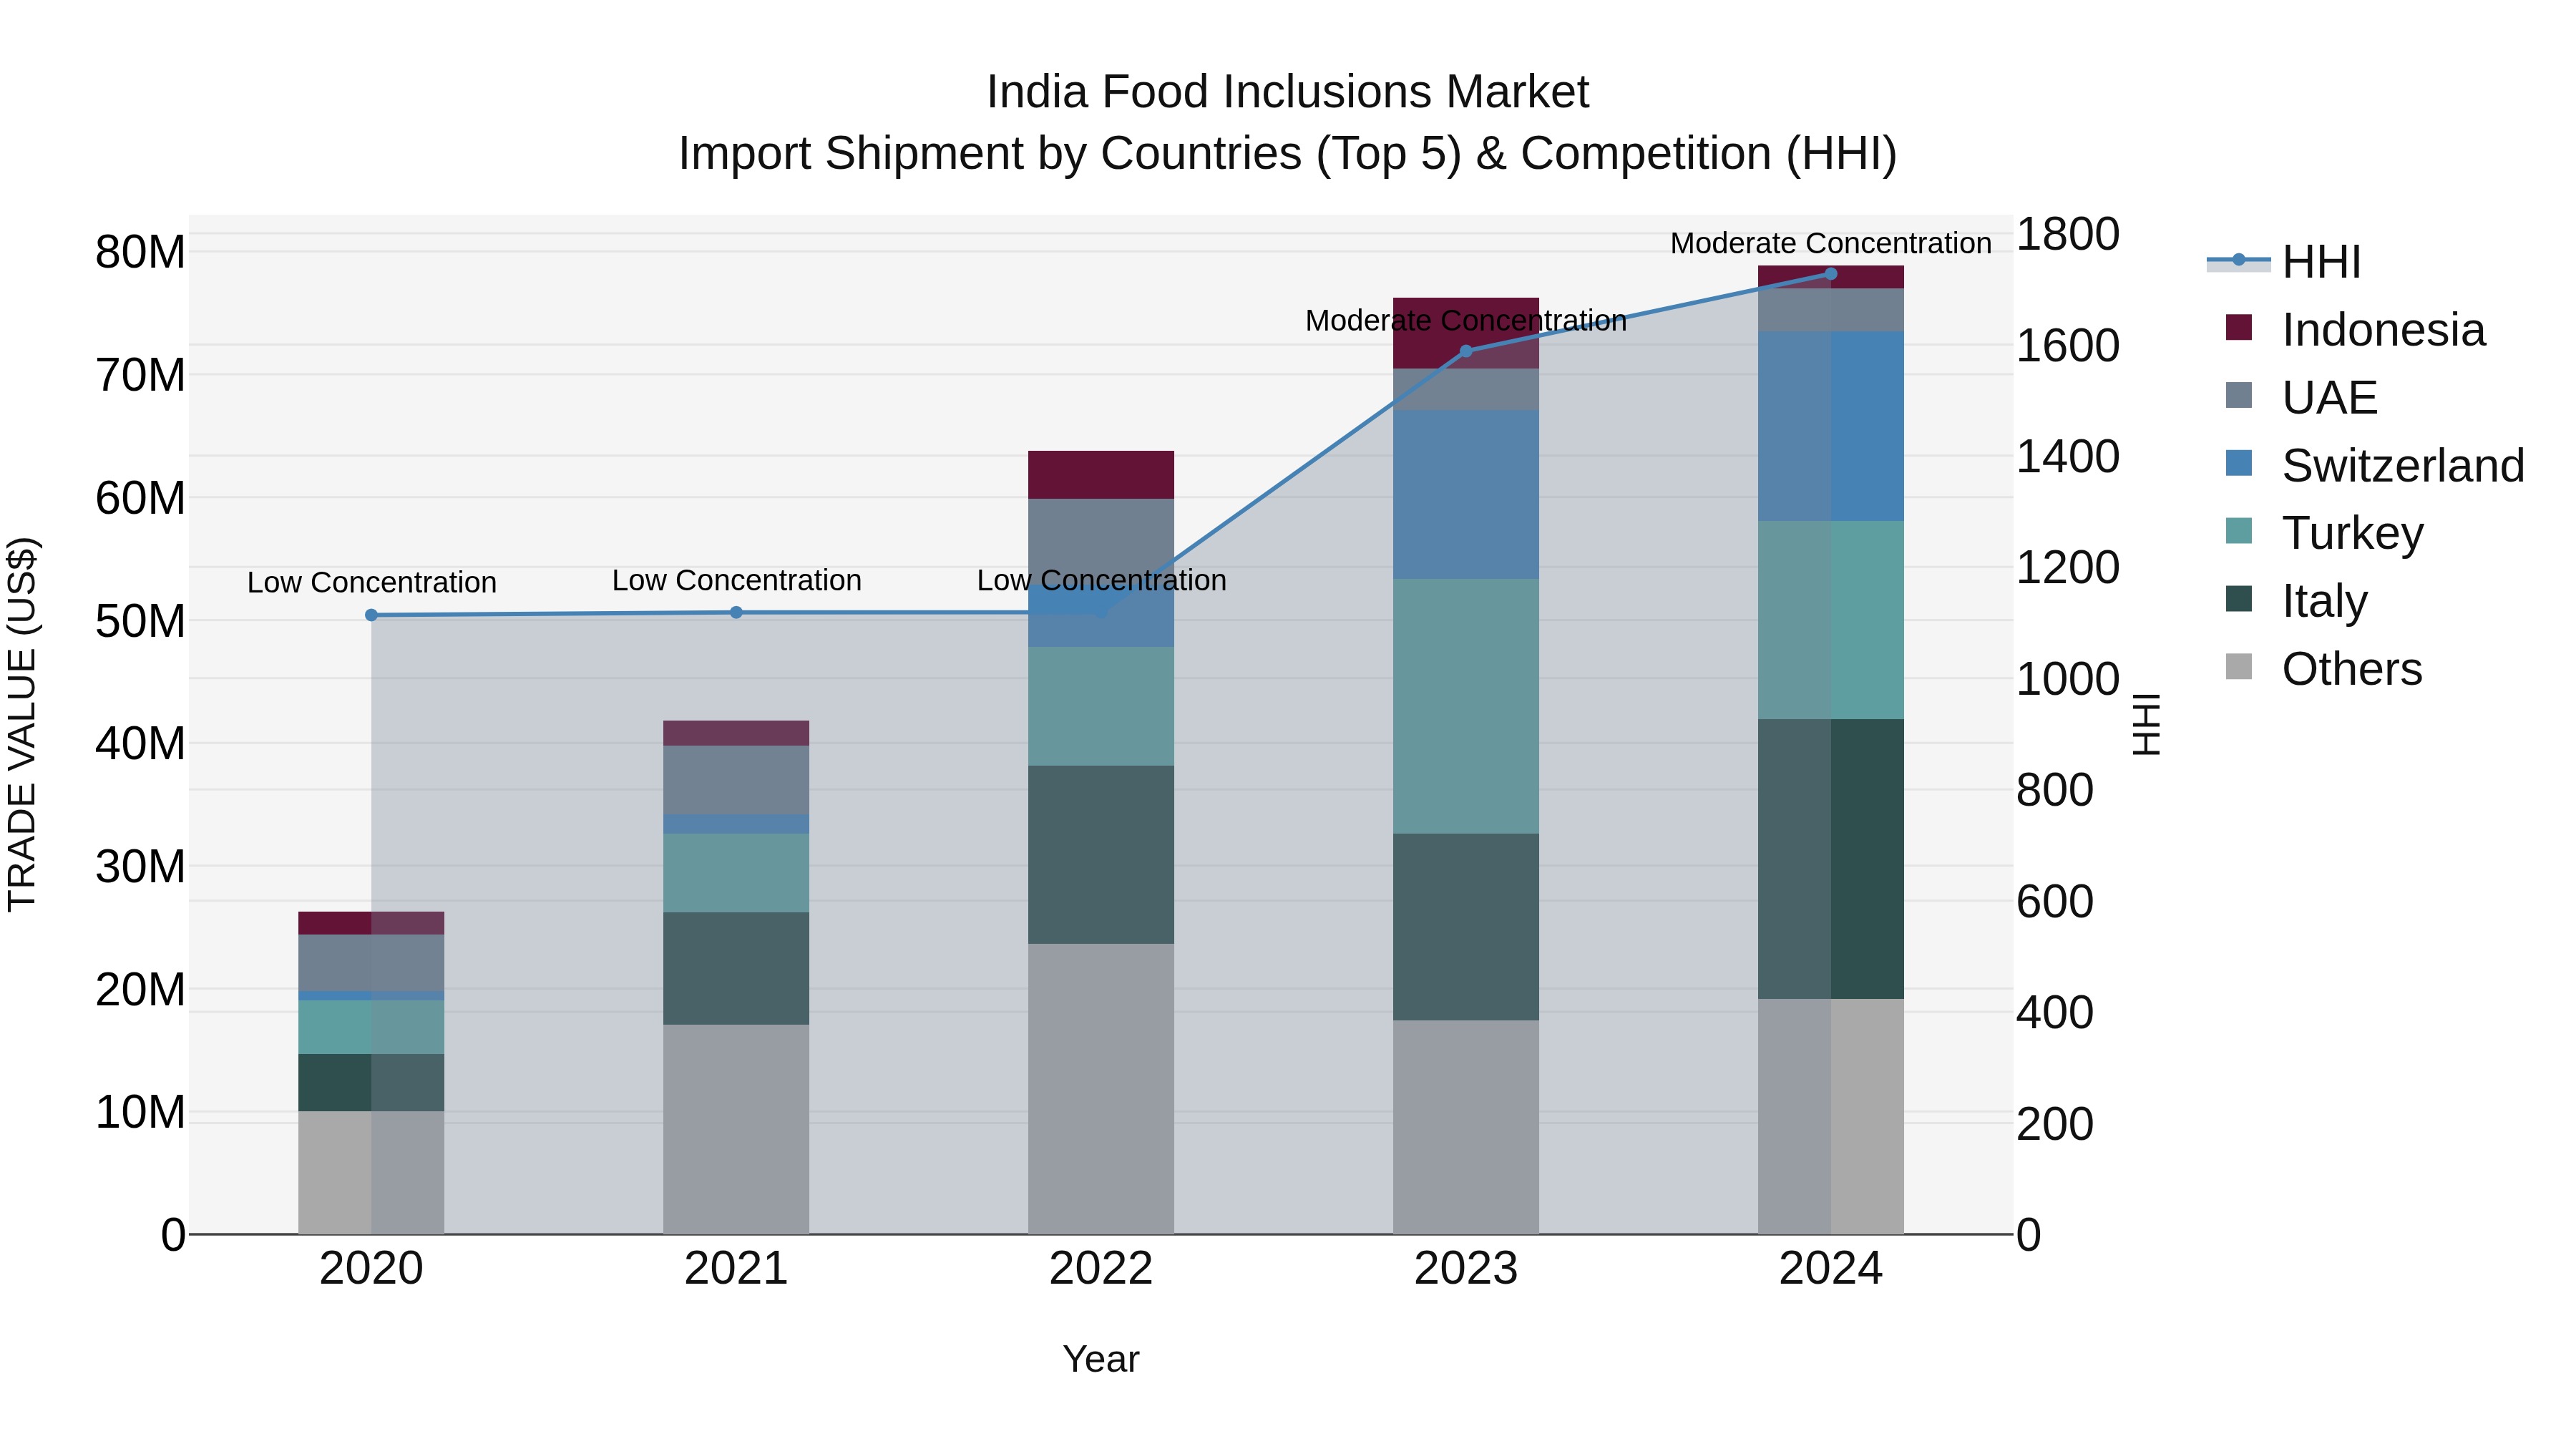
India Food Inclusions Market Top 5 Importing Countries and Market Competition (HHI) Analysis
India`s food inclusions import market saw significant growth in 2024, with top exporting countries being Italy, Turkey, Switzerland, Poland, and the UAE. The Herfindahl-Hirschman Index (HHI) indicated moderate concentration within the market. The compound annual growth rate (CAGR) from 2020 to 2024 was an impressive 31.66%, showcasing a thriving market. Additionally, the growth rate from 2023 to 2024 stood at 3.4%, suggesting a steady upward trajectory in the import of food inclusions into India.
India Food Inclusions Market Overview
Food inclusions are ingredients added to food products to enhance texture and flavor. These inclusions are increasingly used in bakery goods, confectionery, and dairy products in India to provide unique and sensory experiences to consumers.
Drivers of the Market
The India food inclusions market has seen remarkable growth driven by changing consumer preferences and a growing inclination toward innovative food products. Inclusions such as nuts, fruits, and chocolate chips have gained popularity as they add both flavor and texture to various food items. Furthermore, the health and wellness trend has prompted manufacturers to develop products with healthier inclusions. The market is also benefiting from the rise of premium and artisanal foods, which often incorporate unique inclusions to enhance their appeal.
Challenges of the Market
Quality control, supply chain complexities, and consumer demands for innovative inclusions pose challenges. Sourcing unique and safe ingredients, maintaining freshness, and adhering to changing taste preferences influence market dynamics.
COVID-19 Impact on the Market
The food inclusions market adapted to the changing consumer preferences driven by the pandemic. Snacking and indulgence products incorporating food inclusions saw increased demand as people spent more time at home.
Key Players in the Market
Major players in the India food inclusions market include Cargill, Kerry Group, Archer Daniels Midland Company (ADM), Barry Callebaut, and Tate & Lyle.
Key Highlights of the Report:
- India Food Inclusions Market Outlook
- Market Size of India Food Inclusions Market, 2024
- Forecast of India Food Inclusions Market, 2031
- Historical Data and Forecast of India Food Inclusions Revenues & Volume for the Period 2021-2031
- India Food Inclusions Market Trend Evolution
- India Food Inclusions Market Drivers and Challenges
- India Food Inclusions Price Trends
- India Food Inclusions Porter's Five Forces
- India Food Inclusions Industry Life Cycle
- Historical Data and Forecast of India Food Inclusions Market Revenues & Volume By Type for the Period 2021-2031
- Historical Data and Forecast of India Food Inclusions Market Revenues & Volume By Chocolate for the Period 2021-2031
- Historical Data and Forecast of India Food Inclusions Market Revenues & Volume By Fruit & Nut for the Period 2021-2031
- Historical Data and Forecast of India Food Inclusions Market Revenues & Volume By Cereal for the Period 2021-2031
- Historical Data and Forecast of India Food Inclusions Market Revenues & Volume By Confectionery for the Period 2021-2031
- Historical Data and Forecast of India Food Inclusions Market Revenues & Volume By Application for the Period 2021-2031
- Historical Data and Forecast of India Food Inclusions Market Revenues & Volume By Cereal Products for the Period 2021-2031
- Historical Data and Forecast of India Food Inclusions Market Revenues & Volume By Snacks & Bars for the Period 2021-2031
- Historical Data and Forecast of India Food Inclusions Market Revenues & Volume By Bakery Products for the Period 2021-2031
- Historical Data and Forecast of India Food Inclusions Market Revenues & Volume By Dairy & Frozen Desserts for the Period 2021-2031
- Historical Data and Forecast of India Food Inclusions Market Revenues & Volume By Chocolate & Confectionery Products for the Period 2021-2031
- Historical Data and Forecast of India Food Inclusions Market Revenues & Volume By Source for the Period 2021-2031
- Historical Data and Forecast of India Food Inclusions Market Revenues & Volume By Microorganisms for the Period 2021-2031
- Historical Data and Forecast of India Food Inclusions Market Revenues & Volume By Animals for the Period 2021-2031
- Historical Data and Forecast of India Food Inclusions Market Revenues & Volume By Plant for the Period 2021-2031
- India Food Inclusions Import Export Trade Statistics
- Market Opportunity Assessment By Type
- Market Opportunity Assessment By Application
- Market Opportunity Assessment By Source
- India Food Inclusions Top Companies Market Share
- India Food Inclusions Competitive Benchmarking By Technical and Operational Parameters
- India Food Inclusions Company Profiles
- India Food Inclusions Key Strategic Recommendations
Frequently Asked Questions About the Market Study (FAQs):
6Wresearch actively monitors the India Food Inclusions Market and publishes its comprehensive annual report, highlighting emerging trends, growth drivers, revenue analysis, and forecast outlook. Our insights help businesses to make data-backed strategic decisions with ongoing market dynamics. Our analysts track relevent industries related to the India Food Inclusions Market, allowing our clients with actionable intelligence and reliable forecasts tailored to emerging regional needs.
Yes, we provide customisation as per your requirements. To learn more, feel free to contact us on sales@6wresearch.com
1 Executive Summary |
2 Introduction |
2.1 Key Highlights of the Report |
2.2 Report Description |
2.3 Market Scope & Segmentation |
2.4 Research Methodology |
2.5 Assumptions |
3 India Food Inclusions Market Overview |
3.1 India Country Macro Economic Indicators |
3.2 India Food Inclusions Market Revenues & Volume, 2021 & 2031F |
3.3 India Food Inclusions Market - Industry Life Cycle |
3.4 India Food Inclusions Market - Porter's Five Forces |
3.5 India Food Inclusions Market Revenues & Volume Share, By Type, 2021 & 2031F |
3.6 India Food Inclusions Market Revenues & Volume Share, By Application, 2021 & 2031F |
3.7 India Food Inclusions Market Revenues & Volume Share, By Source, 2021 & 2031F |
4 India Food Inclusions Market Dynamics |
4.1 Impact Analysis |
4.2 Market Drivers |
4.2.1 Increasing consumer demand for diverse and premium food products. |
4.2.2 Growing popularity of ethnic and exotic food flavors. |
4.2.3 Rising disposable income and changing lifestyle leading to higher spending on food products. |
4.3 Market Restraints |
4.3.1 Fluctuating prices of raw materials impacting production costs. |
4.3.2 Stringent food safety regulations and quality standards. |
4.3.3 Limited awareness and distribution channels in rural areas hindering market penetration. |
5 India Food Inclusions Market Trends |
6 India Food Inclusions Market, By Types |
6.1 India Food Inclusions Market, By Type |
6.1.1 Overview and Analysis |
6.1.2 India Food Inclusions Market Revenues & Volume, By Type, 2021-2031F |
6.1.3 India Food Inclusions Market Revenues & Volume, By Chocolate, 2021-2031F |
6.1.4 India Food Inclusions Market Revenues & Volume, By Fruit & Nut, 2021-2031F |
6.1.5 India Food Inclusions Market Revenues & Volume, By Cereal, 2021-2031F |
6.1.6 India Food Inclusions Market Revenues & Volume, By Confectionery, 2021-2031F |
6.2 India Food Inclusions Market, By Application |
6.2.1 Overview and Analysis |
6.2.2 India Food Inclusions Market Revenues & Volume, By Cereal Products, 2021-2031F |
6.2.3 India Food Inclusions Market Revenues & Volume, By Snacks & Bars, 2021-2031F |
6.2.4 India Food Inclusions Market Revenues & Volume, By Bakery Products, 2021-2031F |
6.2.5 India Food Inclusions Market Revenues & Volume, By Dairy & Frozen Desserts, 2021-2031F |
6.2.6 India Food Inclusions Market Revenues & Volume, By Chocolate & Confectionery Products, 2021-2031F |
6.3 India Food Inclusions Market, By Source |
6.3.1 Overview and Analysis |
6.3.2 India Food Inclusions Market Revenues & Volume, By Microorganisms, 2021-2031F |
6.3.3 India Food Inclusions Market Revenues & Volume, By Animals, 2021-2031F |
6.3.4 India Food Inclusions Market Revenues & Volume, By Plant, 2021-2031F |
7 India Food Inclusions Market Import-Export Trade Statistics |
7.1 India Food Inclusions Market Export to Major Countries |
7.2 India Food Inclusions Market Imports from Major Countries |
8 India Food Inclusions Market Key Performance Indicators |
8.1 Consumer engagement and feedback on new food inclusion products. |
8.2 Number of partnerships and collaborations with food manufacturers. |
8.3 Percentage of revenue from innovative food inclusion products. |
8.4 Market penetration in tier-2 and tier-3 cities. |
8.5 Adoption rate of food inclusion products in various food applications. |
9 India Food Inclusions Market - Opportunity Assessment |
9.1 India Food Inclusions Market Opportunity Assessment, By Type, 2021 & 2031F |
9.2 India Food Inclusions Market Opportunity Assessment, By Application, 2021 & 2031F |
9.3 India Food Inclusions Market Opportunity Assessment, By Source, 2021 & 2031F |
10 India Food Inclusions Market - Competitive Landscape |
10.1 India Food Inclusions Market Revenue Share, By Companies, 2024 |
10.2 India Food Inclusions Market Competitive Benchmarking, By Operating and Technical Parameters |
11 Company Profiles |
12 Recommendations |
13 Disclaimer |
Global Go To Market Strategy - 2030
Export potential enables firms to identify high-growth global markets with greater confidence by combining advanced trade intelligence with a structured quantitative methodology. The framework analyzes emerging demand trends and country-level import patterns while integrating macroeconomic and trade datasets such as GDP and population forecasts, bilateral import–export flows, tariff structures, elasticity differentials between developed and developing economies, geographic distance, and import demand projections. Using weighted trade values from 2020–2024 as the base period to project country-to-country export potential for 2030, these inputs are operationalized through calculated drivers such as gravity model parameters, tariff impact factors, and projected GDP per-capita growth. Through an analysis of hidden potentials, demand hotspots, and market conditions that are most favorable to success, this method enables firms to focus on target countries, maximize returns, and global expansion with data, backed by accuracy.
By factoring in the projected importer demand gap that is currently unmet and could be potential opportunity, it identifies the potential for the Exporter (Country) among 190 countries, against the general trade analysis, which identifies the biggest importer or exporter.
To discover high-growth global markets and optimize your business strategy:
Click Here
Pricing
- Single User License$ 1,995
- Department License$ 2,400
- Site License$ 3,120
- Global License$ 3,795

Leadership Perspectives from Industry Events
Search
Thought Leadership and Analyst Meet


Our Clients
6WResearch In News
- India Export Attractiveness Tracker 2026
- India Air Conditioner Market Set for Strong Rebound in 2026 After Weather-Led Correction and GST-Driven Recovery: 6Wresearch
- ADAS in India: How Automatic Emergency Braking, Blind Spot Detection & Driver Monitoring are Transforming Road Safety
- Doha a strategic location for EV manufacturing hub: IPA Qatar
- Demand for luxury TVs surging in the GCC, says Samsung
- Empowering Growth: The Thriving Journey of Bangladesh’s Cable Industry
Latest Reports
- Nicaragua RPG Gaming Market (2026-2032)
- New Zealand RPG Gaming Market (2026-2032)
- Netherlands RPG Gaming Market (2026-2032)
- Nauru RPG Gaming Market (2026-2032)
- Namibia RPG Gaming Market (2026-2032)
- Mozambique RPG Gaming Market (2026-2032)
- Montenegro RPG Gaming Market (2026-2032)
- Mongolia RPG Gaming Market (2026-2032)
- Monaco RPG Gaming Market (2026-2032)
- Micronesia RPG Gaming Market (2026-2032)
Industry Events and Analyst Meet

EV India Expo 2026

HIMTEX 2026

India Refining Summit 2026

India EV Show 2026

EV tech India Expo 2026
Whitepaper
- Middle East & Africa Commercial Security Market Click here to view more.
- Middle East & Africa Fire Safety Systems & Equipment Market Click here to view more.
- GCC Drone Market Click here to view more.
- Middle East Lighting Fixture Market Click here to view more.
- GCC Physical & Perimeter Security Market Click here to view more.