India Low E Glass Market (2025-2031) | Companies, Industry, Demand, Segments, Analysis, Restraints, Competition, Supply, Size, Pricing Analysis, Forecast, Strategic Insights, Outlook, Segmentation, Consumer Insights, Share, Drivers, Challenges, Revenue, Growth, Competitive, Opportunities, Investment Trends, Trends, Strategy, Value
Market Forecast By Glazing (Single Glazing, Double Glazing, Triple Glazing), By Coating Type (Solar control low-E coating, Passive low-E coating, Others), By End use (Building and Construction, Automotive, Others) And Competitive Landscape
| Product Code: ETC12576078 | Publication Date: Apr 2025 | Updated Date: Nov 2025 | Product Type: Market Research Report | |
| Publisher: 6Wresearch | Author: Vasudha | No. of Pages: 65 | No. of Figures: 34 | No. of Tables: 19 |
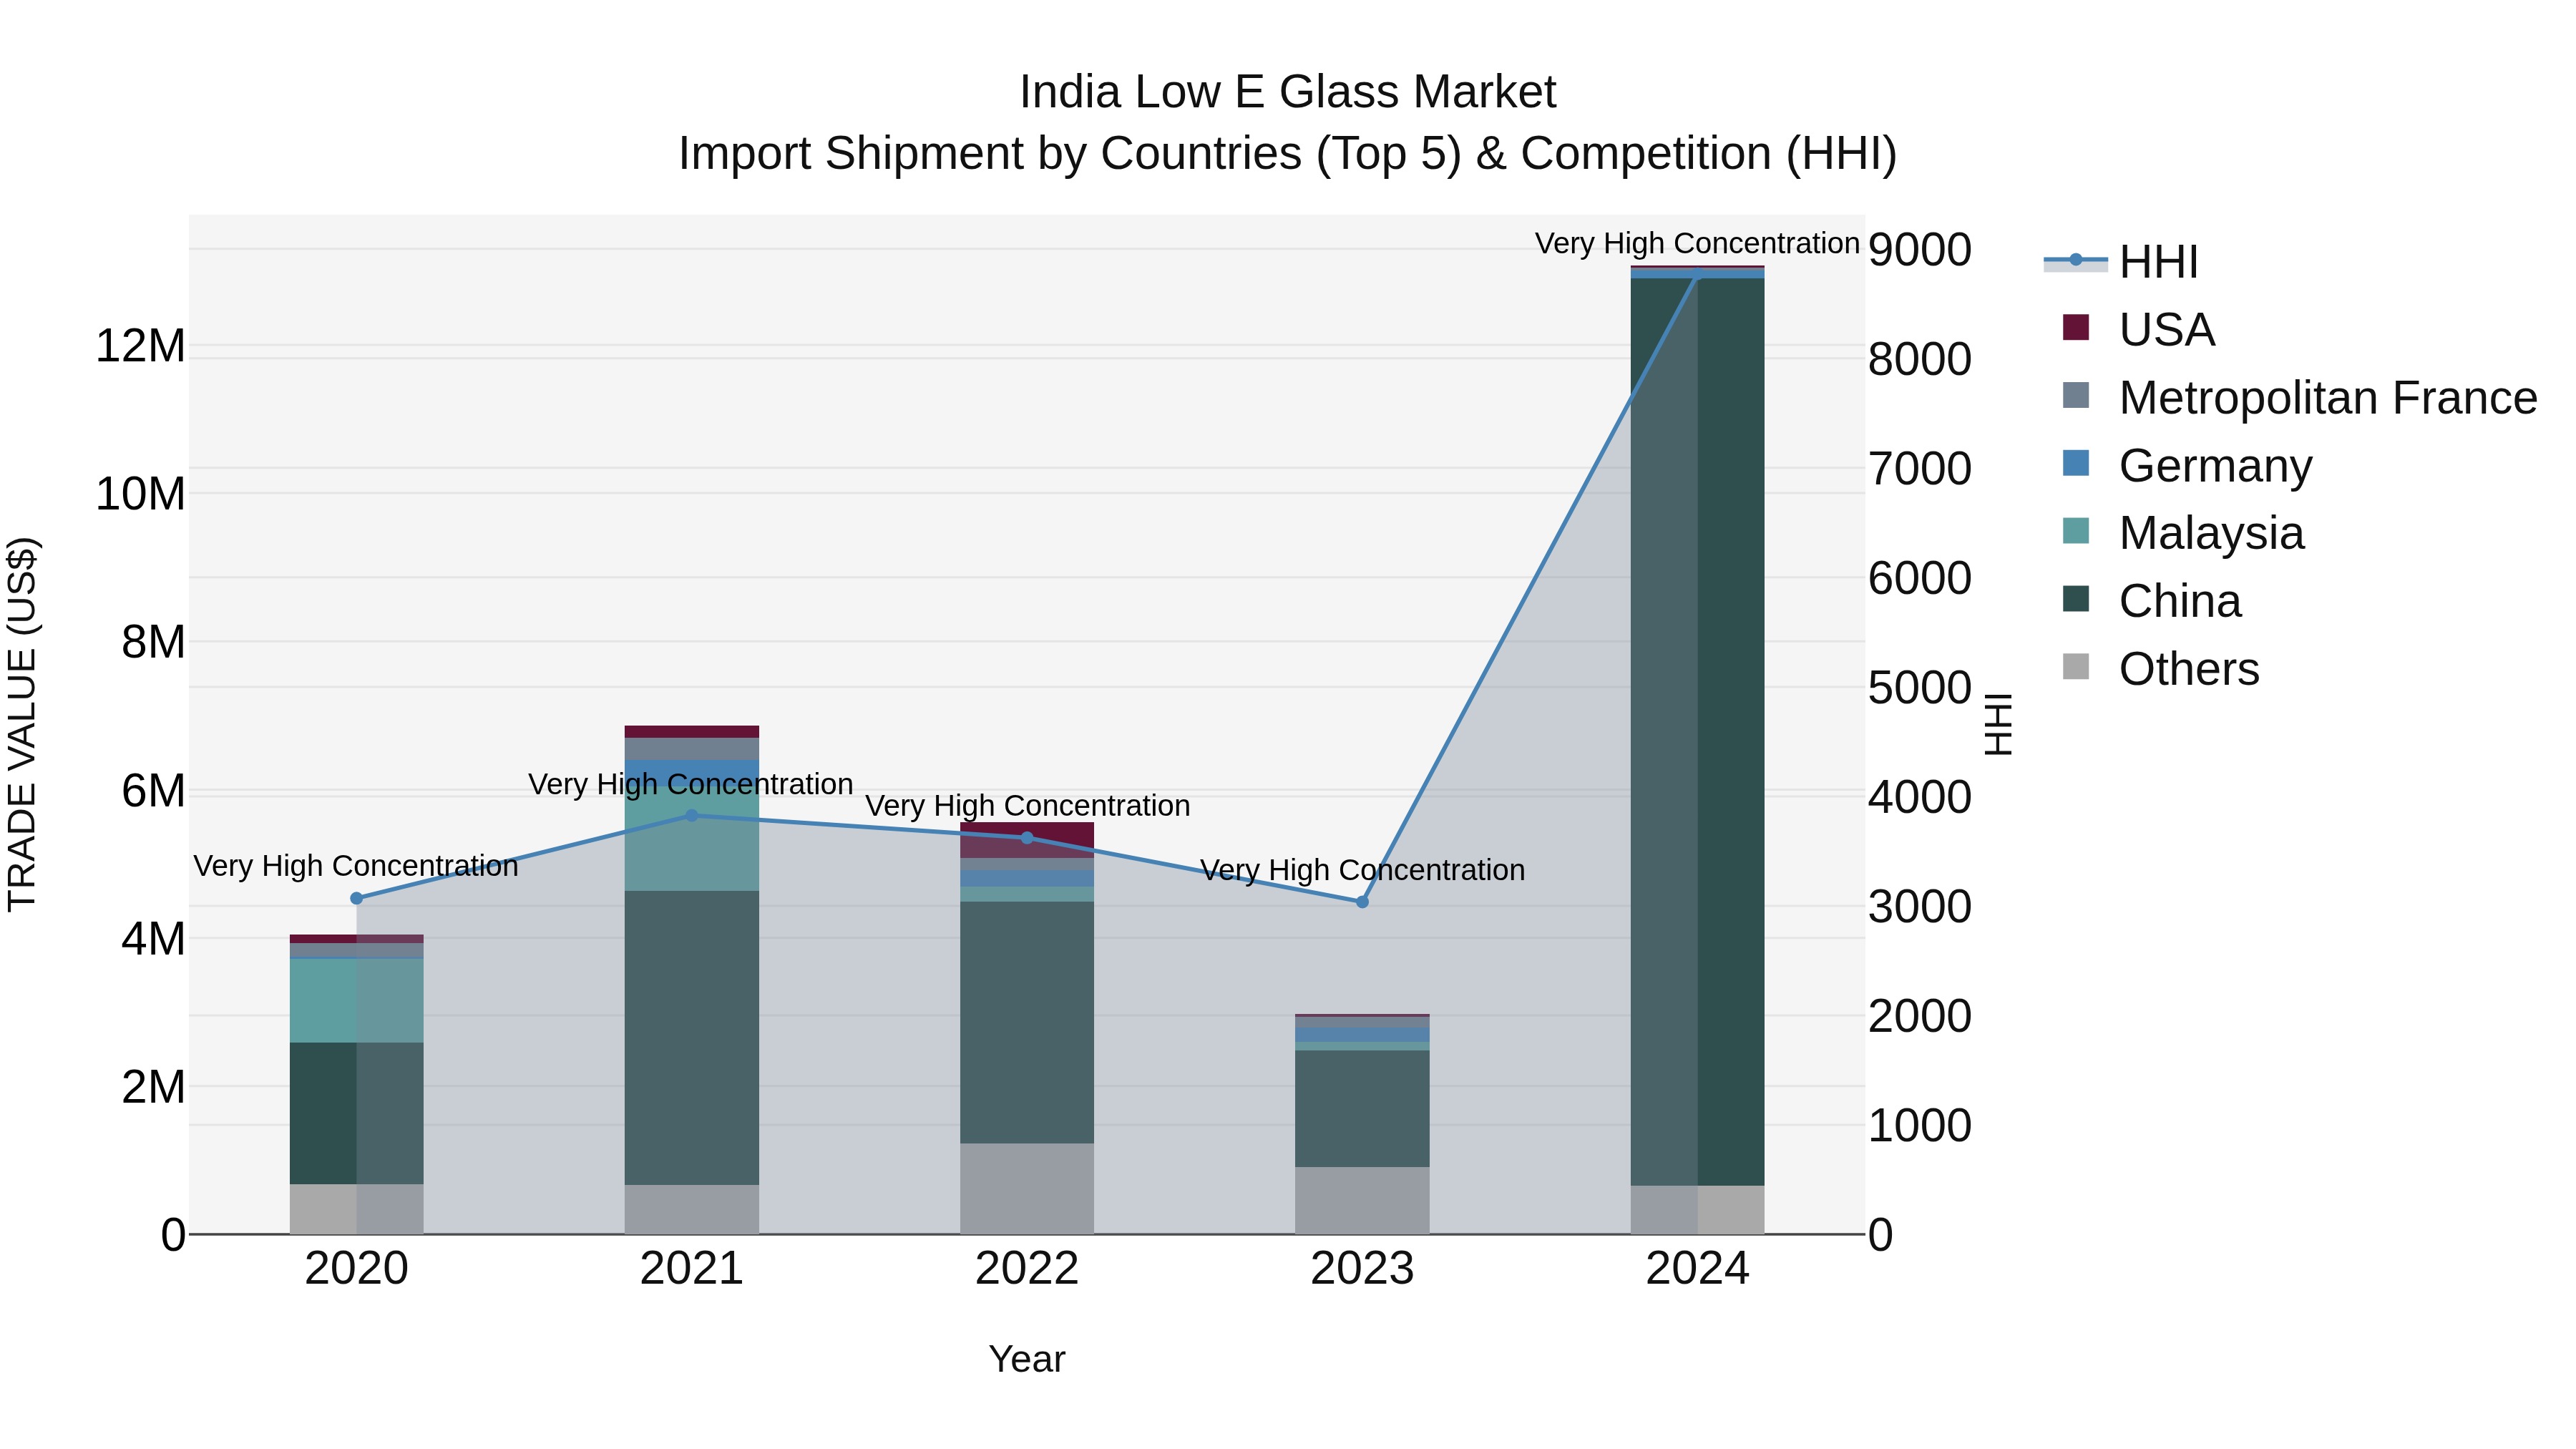
India Low E Glass Market Top 5 Importing Countries and Market Competition (HHI) Analysis
India`s low e glass import shipments in 2024 continued to see a significant influx from top exporting countries such as China, Colombia, Germany, Switzerland, and Japan. The Herfindahl-Hirschman Index (HHI) indicated a high concentration within the market. The impressive compound annual growth rate (CAGR) of 34.04% from 2020 to 2024 highlights the increasing demand for low e glass in India. Moreover, the remarkable growth rate of 340.07% from 2023 to 2024 suggests a rapid acceleration in imports, showcasing the industry`s momentum and potential for further expansion.
India Low E Glass Market Overview
The low e glass market in India is experiencing robust growth driven by increasing awareness about energy efficiency and sustainability in the construction sector. Low e glass, which helps in reducing heat transfer and improving insulation, is being widely adopted in residential and commercial buildings. The market is witnessing a surge in demand due to government initiatives promoting green buildings and energy-efficient practices. Key players in the industry are focusing on developing innovative products to meet the evolving needs of customers. The market is expected to continue expanding, supported by urbanization, infrastructure development, and growing awareness about the benefits of using low e glass in reducing energy consumption and carbon emissions.
India Low E Glass Market Trends
The India low e glass market is experiencing significant growth driven by the increasing focus on energy-efficient building solutions. Low e glass helps in reducing heat transfer and improving insulation, thereby lowering energy consumption for heating and cooling. The rising awareness about environmental sustainability and government initiatives promoting energy-efficient construction are key factors contributing to the market growth. Additionally, the rapid urbanization, growth in the construction sector, and increasing demand for green buildings are further fueling the adoption of low e glass in India. Manufacturers are focusing on product innovations, such as improved thermal performance and durability, to cater to the evolving needs of the market. Overall, the India low e glass market is expected to continue its upward trajectory in the coming years.
India Low E Glass Market Challenges
In the India low e glass market, several challenges are faced including high initial costs for manufacturing and installation, limited awareness among consumers about the benefits of low e glass in terms of energy efficiency, and the presence of cheaper alternatives in the market. Additionally, the lack of standardized quality control measures and variations in building regulations across different states pose challenges for manufacturers and suppliers. Competition from traditional glass manufacturers who offer standard glass products at lower prices also hinders the widespread adoption of low e glass in the Indian market. Overall, overcoming these challenges will require industry players to invest in education and awareness campaigns, innovate cost-effective manufacturing processes, and collaborate with policymakers to establish clear guidelines for promoting energy-efficient building materials.
India Low E Glass Market Investment Opportunities
The low e glass market in India presents promising investment opportunities due to factors such as increasing demand for energy-efficient building solutions, government initiatives promoting sustainable construction practices, and the growing awareness of environmental issues. Investing in companies involved in the production and distribution of low e glass products could be a lucrative option, as the market is expected to experience steady growth in the coming years. Additionally, with the construction sector in India witnessing rapid expansion, there is a significant potential for the adoption of low e glass in commercial and residential buildings, further driving the market`s growth. Investors looking to capitalize on the sustainability trend and the demand for energy-efficient solutions could find the India low e glass market a compelling opportunity for investment.
India Low E Glass Market Government Policy
The Indian government has implemented various policies to promote the adoption of low-emissivity (low-e) glass in the market. One of the key initiatives is the Energy Conservation Building Code (ECBC), which mandates the use of energy-efficient materials, including low-e glass, in new construction projects. Additionally, the Bureau of Energy Efficiency (BEE) has introduced star labeling programs for buildings, encouraging the use of energy-efficient materials like low-e glass to improve overall energy efficiency. Furthermore, the government has provided incentives and subsidies to manufacturers and consumers to promote the production and adoption of low-e glass, aligning with its goal of reducing carbon emissions and promoting sustainable development in the construction industry. These policies indicate a favorable regulatory environment for the growth of the low-e glass market in India.
India Low E Glass Market Future Outlook
The future outlook for the India low e glass market looks promising, with a projected steady growth trajectory driven by increasing awareness of energy efficiency and sustainability in the construction sector. The demand for low e glass is expected to rise as more architects, builders, and consumers prioritize eco-friendly building materials to reduce energy costs and carbon footprints. Additionally, government initiatives promoting energy-efficient building practices and the growing trend of green building certifications are likely to further boost the adoption of low e glass in the Indian market. Overall, the India low e glass market is poised for expansion in the coming years as the construction industry increasingly shifts towards environmentally conscious solutions.
Key Highlights of the Report:
- India Low E Glass Market Outlook
- Market Size of India Low E Glass Market,2024
- Forecast of India Low E Glass Market, 2031
- Historical Data and Forecast of India Low E Glass Revenues & Volume for the Period 2021-2031
- India Low E Glass Market Trend Evolution
- India Low E Glass Market Drivers and Challenges
- India Low E Glass Price Trends
- India Low E Glass Porter's Five Forces
- India Low E Glass Industry Life Cycle
- Historical Data and Forecast of India Low E Glass Market Revenues & Volume By Glazing for the Period 2021-2031
- Historical Data and Forecast of India Low E Glass Market Revenues & Volume By Single Glazing for the Period 2021-2031
- Historical Data and Forecast of India Low E Glass Market Revenues & Volume By Double Glazing for the Period 2021-2031
- Historical Data and Forecast of India Low E Glass Market Revenues & Volume By Triple Glazing for the Period 2021-2031
- Historical Data and Forecast of India Low E Glass Market Revenues & Volume By Coating Type for the Period 2021-2031
- Historical Data and Forecast of India Low E Glass Market Revenues & Volume By Solar control low-E coating for the Period 2021-2031
- Historical Data and Forecast of India Low E Glass Market Revenues & Volume By Passive low-E coating for the Period 2021-2031
- Historical Data and Forecast of India Low E Glass Market Revenues & Volume By Others for the Period 2021-2031
- Historical Data and Forecast of India Low E Glass Market Revenues & Volume By End use for the Period 2021-2031
- Historical Data and Forecast of India Low E Glass Market Revenues & Volume By Building and Construction for the Period 2021-2031
- Historical Data and Forecast of India Low E Glass Market Revenues & Volume By Automotive for the Period 2021-2031
- Historical Data and Forecast of India Low E Glass Market Revenues & Volume By Others for the Period 2021-2031
- India Low E Glass Import Export Trade Statistics
- Market Opportunity Assessment By Glazing
- Market Opportunity Assessment By Coating Type
- Market Opportunity Assessment By End use
- India Low E Glass Top Companies Market Share
- India Low E Glass Competitive Benchmarking By Technical and Operational Parameters
- India Low E Glass Company Profiles
- India Low E Glass Key Strategic Recommendations
Frequently Asked Questions About the Market Study (FAQs):
6Wresearch actively monitors the India Low E Glass Market and publishes its comprehensive annual report, highlighting emerging trends, growth drivers, revenue analysis, and forecast outlook. Our insights help businesses to make data-backed strategic decisions with ongoing market dynamics. Our analysts track relevent industries related to the India Low E Glass Market, allowing our clients with actionable intelligence and reliable forecasts tailored to emerging regional needs.
Yes, we provide customisation as per your requirements. To learn more, feel free to contact us on sales@6wresearch.com
1 Executive Summary |
2 Introduction |
2.1 Key Highlights of the Report |
2.2 Report Description |
2.3 Market Scope & Segmentation |
2.4 Research Methodology |
2.5 Assumptions |
3 India Low E Glass Market Overview |
3.1 India Country Macro Economic Indicators |
3.2 India Low E Glass Market Revenues & Volume, 2021 & 2031F |
3.3 India Low E Glass Market - Industry Life Cycle |
3.4 India Low E Glass Market - Porter's Five Forces |
3.5 India Low E Glass Market Revenues & Volume Share, By Glazing, 2021 & 2031F |
3.6 India Low E Glass Market Revenues & Volume Share, By Coating Type, 2021 & 2031F |
3.7 India Low E Glass Market Revenues & Volume Share, By End use, 2021 & 2031F |
4 India Low E Glass Market Dynamics |
4.1 Impact Analysis |
4.2 Market Drivers |
4.2.1 Increasing awareness about energy efficiency and sustainability in construction projects |
4.2.2 Growing demand for green buildings and eco-friendly materials |
4.2.3 Government initiatives promoting energy-efficient building practices |
4.3 Market Restraints |
4.3.1 High initial cost of low e glass compared to traditional glass |
4.3.2 Lack of awareness and education among consumers and builders about the benefits of low e glass |
4.3.3 Limited availability of skilled labor for installation and maintenance of low e glass products |
5 India Low E Glass Market Trends |
6 India Low E Glass Market, By Types |
6.1 India Low E Glass Market, By Glazing |
6.1.1 Overview and Analysis |
6.1.2 India Low E Glass Market Revenues & Volume, By Glazing, 2021 - 2031F |
6.1.3 India Low E Glass Market Revenues & Volume, By Single Glazing, 2021 - 2031F |
6.1.4 India Low E Glass Market Revenues & Volume, By Double Glazing, 2021 - 2031F |
6.1.5 India Low E Glass Market Revenues & Volume, By Triple Glazing, 2021 - 2031F |
6.2 India Low E Glass Market, By Coating Type |
6.2.1 Overview and Analysis |
6.2.2 India Low E Glass Market Revenues & Volume, By Solar control low-E coating, 2021 - 2031F |
6.2.3 India Low E Glass Market Revenues & Volume, By Passive low-E coating, 2021 - 2031F |
6.2.4 India Low E Glass Market Revenues & Volume, By Others, 2021 - 2031F |
6.3 India Low E Glass Market, By End use |
6.3.1 Overview and Analysis |
6.3.2 India Low E Glass Market Revenues & Volume, By Building and Construction, 2021 - 2031F |
6.3.3 India Low E Glass Market Revenues & Volume, By Automotive, 2021 - 2031F |
6.3.4 India Low E Glass Market Revenues & Volume, By Others, 2021 - 2031F |
7 India Low E Glass Market Import-Export Trade Statistics |
7.1 India Low E Glass Market Export to Major Countries |
7.2 India Low E Glass Market Imports from Major Countries |
8 India Low E Glass Market Key Performance Indicators |
8.1 Energy savings achieved by using low e glass in buildings |
8.2 Number of green building certifications achieved by projects using low e glass |
8.3 Adoption rate of low e glass in new construction projects |
8.4 Number of training programs conducted to educate consumers and builders about low e glass benefits |
8.5 Percentage increase in the use of low e glass in the construction industry |
9 India Low E Glass Market - Opportunity Assessment |
9.1 India Low E Glass Market Opportunity Assessment, By Glazing, 2021 & 2031F |
9.2 India Low E Glass Market Opportunity Assessment, By Coating Type, 2021 & 2031F |
9.3 India Low E Glass Market Opportunity Assessment, By End use, 2021 & 2031F |
10 India Low E Glass Market - Competitive Landscape |
10.1 India Low E Glass Market Revenue Share, By Companies, 2024 |
10.2 India Low E Glass Market Competitive Benchmarking, By Operating and Technical Parameters |
11 Company Profiles |
12 Recommendations |
13 Disclaimer |
Global Go To Market Strategy - 2030
Export potential enables firms to identify high-growth global markets with greater confidence by combining advanced trade intelligence with a structured quantitative methodology. The framework analyzes emerging demand trends and country-level import patterns while integrating macroeconomic and trade datasets such as GDP and population forecasts, bilateral import–export flows, tariff structures, elasticity differentials between developed and developing economies, geographic distance, and import demand projections. Using weighted trade values from 2020–2024 as the base period to project country-to-country export potential for 2030, these inputs are operationalized through calculated drivers such as gravity model parameters, tariff impact factors, and projected GDP per-capita growth. Through an analysis of hidden potentials, demand hotspots, and market conditions that are most favorable to success, this method enables firms to focus on target countries, maximize returns, and global expansion with data, backed by accuracy.
By factoring in the projected importer demand gap that is currently unmet and could be potential opportunity, it identifies the potential for the Exporter (Country) among 190 countries, against the general trade analysis, which identifies the biggest importer or exporter.
To discover high-growth global markets and optimize your business strategy:
Click Here
Pricing
- Single User License$ 1,995
- Department License$ 2,400
- Site License$ 3,120
- Global License$ 3,795

Leadership Perspectives from Industry Events
Search
Thought Leadership and Analyst Meet


Our Clients
6WResearch In News
- Doha a strategic location for EV manufacturing hub: IPA Qatar
- Demand for luxury TVs surging in the GCC, says Samsung
- Empowering Growth: The Thriving Journey of Bangladesh’s Cable Industry
- Demand for luxury TVs surging in the GCC, says Samsung
- Video call with a traditional healer? Once unthinkable, it’s now common in South Africa
- Intelligent Buildings To Smooth GCC’s Path To Net Zero
Latest Reports
- Cape Verde Portable Hand-Thrown Extinguisher Market (2026-2032)
- Canada Portable Hand-Thrown Extinguisher Market (2026-2032)
- Cameroon Portable Hand-Thrown Extinguisher Market (2026-2032)
- Burundi Portable Hand-Thrown Extinguisher Market (2026-2032)
- Burkina Faso Portable Hand-Thrown Extinguisher Market (2026-2032)
- Bulgaria Portable Hand-Thrown Extinguisher Market (2026-2032)
- Brunei Portable Hand-Thrown Extinguisher Market (2026-2032)
- Botswana Portable Hand-Thrown Extinguisher Market (2026-2032)
- Bosnia and Herzegovina Portable Hand-Thrown Extinguisher Market (2026-2032)
- Bolivia Portable Hand-Thrown Extinguisher Market (2026-2032)
Industry Events and Analyst Meet

HIMTEX 2026

India Refining Summit 2026

India EV Show 2026

EV tech India Expo 2026

Auto Tech Asia 2026
Whitepaper
- Middle East & Africa Commercial Security Market Click here to view more.
- Middle East & Africa Fire Safety Systems & Equipment Market Click here to view more.
- GCC Drone Market Click here to view more.
- Middle East Lighting Fixture Market Click here to view more.
- GCC Physical & Perimeter Security Market Click here to view more.