India Pulleys Market (2025-2031) | Size, Companies, Value, Analysis, Trends, Revenue, Growth, Industry, Forecast, Outlook & Share
Market Forecast By Type (Steel, Cast Iron, Glass Filled Polymer), By Applications (OEM, Aftermarket) And Competitive Landscape
| Product Code: ETC045244 | Publication Date: Jun 2023 | Updated Date: Aug 2025 | Product Type: Report | |
| Publisher: 6Wresearch | Author: Ravi Bhandari | No. of Pages: 70 | No. of Figures: 35 | No. of Tables: 5 |
India Pulleys Market Growth Rate Analysis (2021-2031)
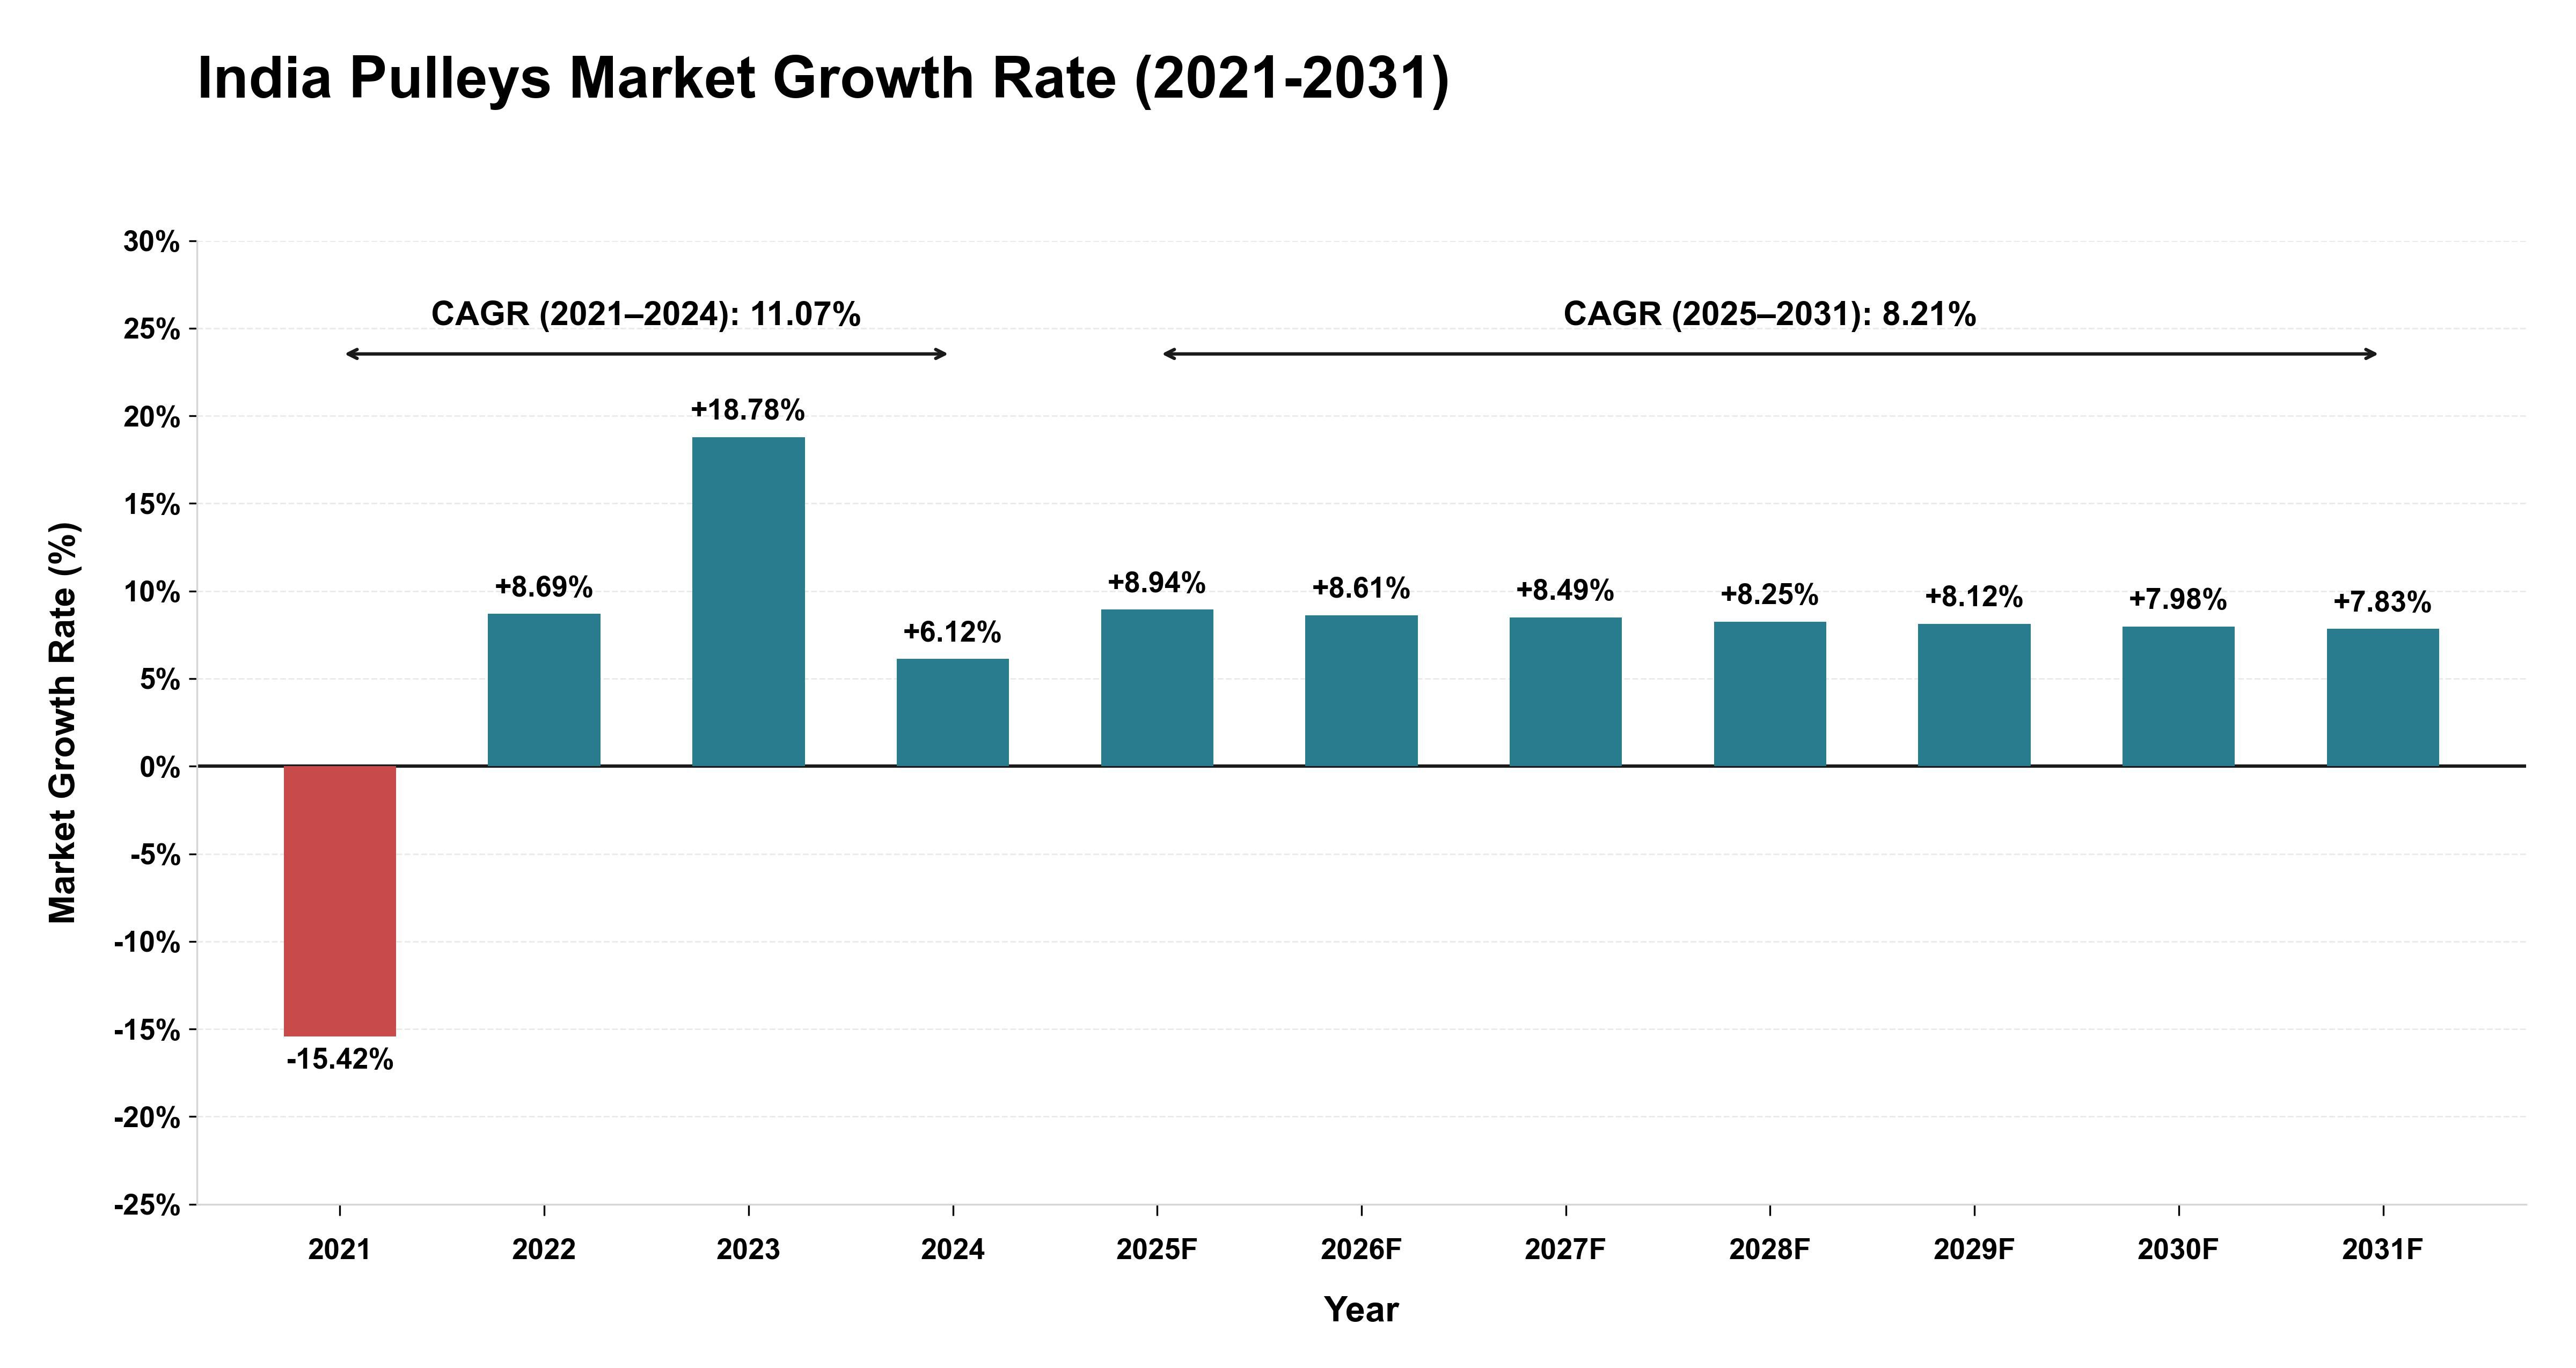
The India Pulleys market witnessed a tumultuous period from 2021 to 2024, marked by a significant contraction in 2021 followed by a strong recovery and robust growth trajectory, culminating in a CAGR of 11.07%. This phase was characterized by structural adjustments and demand corrections leading to a stabilization of the market. Looking ahead to the forecast period from 2025 to 2031, the market is expected to continue its expansion but at a more moderate pace, with a forecasted CAGR of 8.21%. The growth rates from 2025 onwards demonstrate a trend of stabilizing expansion as the market matures and adjusts to post-pandemic dynamics. The consistent positive growth rates indicate a steady and sustainable growth path for the India Pulleys market, reflecting increasing demand and market maturity.
India Pulleys Market Synopsis
The India Pulleys Market is projected to grow at a CAGR of 5.3% during the forecast period 2025-2031. The market has been witnessing steady growth due to its widespread application in numerous industries, such as automotive, textile, and food & beverage. It is used for driving belts in machines for smooth operation and to drive ancillary components like compressors or pumps that require power transmission from engines or motors. Growing demand for automation across numerous industries will create lucrative opportunities for pulley manufacturers in the near future.
Drivers of the Market:
Surge in Industrial Automation: Increasing industrial automation across several process industry verticals like chemical, oil & gas, and pharmaceuticals has propelled the usage of pulleys with high quality standards and adjustable speed drives (ASDs). This factor will propel the demand of pulleys over other competitors such as gears and chains which have lower efficiency than them, thus boosting the growth of India Pulleys Market over coming years. Rising Adoption In Automotive Sector: The automotive sector uses pulleys extensively for engine timing operations along with other functions like alternator belt tensioning which are integral part of any vehicle`s performance management system. Additionally rising number of vehicles on road especially commercial vehicles further stimulate the demand thereby augmenting market growth positively .
Challenges of the Market:
High Cost Of Maintenance And Replacement: Low-cost advantage offered by competing products such as chain sprockets may restrain the adoption rate among consumers leading to a decline in sales volume thereby restricting market size significantly. Availability Of Counterfeit Products: The presence of counterfeit products offering premium features at low price point can hamper sales revenue, challenging manufacturers` outlook towards profits.
Key Players of the Market:
Some key players operating in India Pulleys Market include SKF AB (Sweden), Martin Sprocket & Gear Inc.,(USA), Ametric Inc.(USA), Browning (UAE), Lovejoy Inc.(US), TB Woods Inc.(US). Timken Company (US). KHK Group Co., Ltd.(Japan )and others . These companies focus largely on innovation strategies coupled with increasing their presence through strategic acquisitions/mergers along with collaborations & partnerships amongst each other aiming to gain competitive edge over each other by offering superior customer service experience .
Key Highlights of the Report:
- India Pulleys Market Outlook
- Market Size of India Pulleys Market, 2024
- Forecast of India Pulleys Market, 2031
- Historical Data and Forecast of India Pulleys Revenues & Volume for the Period 2021-2031
- India Pulleys Market Trend Evolution
- India Pulleys Market Drivers and Challenges
- India Pulleys Price Trends
- India Pulleys Porter's Five Forces
- India Pulleys Industry Life Cycle
- Historical Data and Forecast of India Pulleys Market Revenues & Volume By Type for the Period 2021-2031
- Historical Data and Forecast of India Pulleys Market Revenues & Volume By Steel for the Period 2021-2031
- Historical Data and Forecast of India Pulleys Market Revenues & Volume By Cast Iron for the Period 2021-2031
- Historical Data and Forecast of India Pulleys Market Revenues & Volume By Glass Filled Polymer for the Period 2021-2031
- Historical Data and Forecast of India Pulleys Market Revenues & Volume By Applications for the Period 2021-2031
- Historical Data and Forecast of India Pulleys Market Revenues & Volume By OEM for the Period 2021-2031
- Historical Data and Forecast of India Pulleys Market Revenues & Volume By Aftermarket for the Period 2021-2031
- India Pulleys Import Export Trade Statistics
- Market Opportunity Assessment By Type
- Market Opportunity Assessment By Applications
- India Pulleys Top Companies Market Share
- India Pulleys Competitive Benchmarking By Technical and Operational Parameters
- India Pulleys Company Profiles
- India Pulleys Key Strategic Recommendations
Frequently Asked Questions About the Market Study (FAQs):
6Wresearch actively monitors the India Pulleys Market and publishes its comprehensive annual report, highlighting emerging trends, growth drivers, revenue analysis, and forecast outlook. Our insights help businesses to make data-backed strategic decisions with ongoing market dynamics. Our analysts track relevent industries related to the India Pulleys Market, allowing our clients with actionable intelligence and reliable forecasts tailored to emerging regional needs.
Yes, we provide customisation as per your requirements. To learn more, feel free to contact us on sales@6wresearch.com
1 Executive Summary |
2 Introduction |
2.1 Key Highlights of the Report |
2.2 Report Description |
2.3 Market Scope & Segmentation |
2.4 Research Methodology |
2.5 Assumptions |
3 India Pulleys Market Overview |
3.1 India Country Macro Economic Indicators |
3.2 India Pulleys Market Revenues & Volume, 2021 & 2031F |
3.3 India Pulleys Market - Industry Life Cycle |
3.4 India Pulleys Market - Porter's Five Forces |
3.5 India Pulleys Market Revenues & Volume Share, By Type, 2021 & 2031F |
3.6 India Pulleys Market Revenues & Volume Share, By Applications, 2021 & 2031F |
4 India Pulleys Market Dynamics |
4.1 Impact Analysis |
4.2 Market Drivers |
4.2.1 Growing industrialization and infrastructure development in India increasing the demand for pulleys. |
4.2.2 Rising adoption of automation and machinery in various sectors driving the need for pulleys. |
4.2.3 Government initiatives promoting manufacturing and industrial growth boosting the pulleys market. |
4.3 Market Restraints |
4.3.1 Fluctuating raw material prices impacting the production cost of pulleys. |
4.3.2 Intense competition among market players leading to pricing pressures. |
4.3.3 Technological advancements leading to the development of alternative solutions impacting the demand for traditional pulleys. |
5 India Pulleys Market Trends |
6 India Pulleys Market, By Types |
6.1 India Pulleys Market, By Type |
6.1.1 Overview and Analysis |
6.1.2 India Pulleys Market Revenues & Volume, By Type, 2021-2031F |
6.1.3 India Pulleys Market Revenues & Volume, By Steel, 2021-2031F |
6.1.4 India Pulleys Market Revenues & Volume, By Cast Iron, 2021-2031F |
6.1.5 India Pulleys Market Revenues & Volume, By Glass Filled Polymer, 2021-2031F |
6.2 India Pulleys Market, By Applications |
6.2.1 Overview and Analysis |
6.2.2 India Pulleys Market Revenues & Volume, By OEM, 2021-2031F |
6.2.3 India Pulleys Market Revenues & Volume, By Aftermarket, 2021-2031F |
7 India Pulleys Market Import-Export Trade Statistics |
7.1 India Pulleys Market Export to Major Countries |
7.2 India Pulleys Market Imports from Major Countries |
8 India Pulleys Market Key Performance Indicators |
8.1 Number of new industrial projects initiated in India. |
8.2 Growth rate of the manufacturing sector in India. |
8.3 Adoption rate of automation technologies in key industries. |
9 India Pulleys Market - Opportunity Assessment |
9.1 India Pulleys Market Opportunity Assessment, By Type, 2021 & 2031F |
9.2 India Pulleys Market Opportunity Assessment, By Applications, 2021 & 2031F |
10 India Pulleys Market - Competitive Landscape |
10.1 India Pulleys Market Revenue Share, By Companies, 2024 |
10.2 India Pulleys Market Competitive Benchmarking, By Operating and Technical Parameters |
11 Company Profiles |
12 Recommendations |
13 Disclaimer |
Global Go To Market Strategy - 2030
Export potential enables firms to identify high-growth global markets with greater confidence by combining advanced trade intelligence with a structured quantitative methodology. The framework analyzes emerging demand trends and country-level import patterns while integrating macroeconomic and trade datasets such as GDP and population forecasts, bilateral import–export flows, tariff structures, elasticity differentials between developed and developing economies, geographic distance, and import demand projections. Using weighted trade values from 2020–2024 as the base period to project country-to-country export potential for 2030, these inputs are operationalized through calculated drivers such as gravity model parameters, tariff impact factors, and projected GDP per-capita growth. Through an analysis of hidden potentials, demand hotspots, and market conditions that are most favorable to success, this method enables firms to focus on target countries, maximize returns, and global expansion with data, backed by accuracy.
By factoring in the projected importer demand gap that is currently unmet and could be potential opportunity, it identifies the potential for the Exporter (Country) among 190 countries, against the general trade analysis, which identifies the biggest importer or exporter.
To discover high-growth global markets and optimize your business strategy:
Click Here
Pricing
- Single User License$ 1,995
- Department License$ 2,400
- Site License$ 3,120
- Global License$ 3,795

Leadership Perspectives from Industry Events
Search
Thought Leadership and Analyst Meet


Our Clients
6WResearch In News
- India Air Conditioner Market Set for Strong Rebound in 2026 After Weather-Led Correction and GST-Driven Recovery: 6Wresearch
- ADAS in India: How Automatic Emergency Braking, Blind Spot Detection & Driver Monitoring are Transforming Road Safety
- Doha a strategic location for EV manufacturing hub: IPA Qatar
- Demand for luxury TVs surging in the GCC, says Samsung
- Empowering Growth: The Thriving Journey of Bangladesh’s Cable Industry
- Demand for luxury TVs surging in the GCC, says Samsung
Latest Reports
- Nicaragua RPG Gaming Market (2026-2032)
- New Zealand RPG Gaming Market (2026-2032)
- Netherlands RPG Gaming Market (2026-2032)
- Nauru RPG Gaming Market (2026-2032)
- Namibia RPG Gaming Market (2026-2032)
- Mozambique RPG Gaming Market (2026-2032)
- Montenegro RPG Gaming Market (2026-2032)
- Mongolia RPG Gaming Market (2026-2032)
- Monaco RPG Gaming Market (2026-2032)
- Micronesia RPG Gaming Market (2026-2032)
Industry Events and Analyst Meet

HIMTEX 2026

India Refining Summit 2026

India EV Show 2026

EV tech India Expo 2026

Auto Tech Asia 2026
Whitepaper
- Middle East & Africa Commercial Security Market Click here to view more.
- Middle East & Africa Fire Safety Systems & Equipment Market Click here to view more.
- GCC Drone Market Click here to view more.
- Middle East Lighting Fixture Market Click here to view more.
- GCC Physical & Perimeter Security Market Click here to view more.