India Purified Terephthalic Acid Market (2026-2032) | Size, Value, Outlook, Strategy, Supply, Demand, Revenue, Industry, Challenges, Companies, Share, Opportunities, Trends, Pricing Analysis, Growth, Consumer Insights, Forecast, Competitive, Competition, Strategic Insights, Restraints, Investment Trends, Segments, Analysis, Segmentation, Drivers
Market Forecast By Type (Virgin PTA, Recycled PTA, High-Purity PTA, Fiber Grade PTA, Industrial Grade PTA), By Application (Polyester Resins, Plastic Bottles, Films & Tapes, Paints & Coatings, Adhesives), By End-Use (Textile, Packaging, Electronics, Automotive, Construction), By Form (Powder, Granules, Liquid, Pellets, Others) And Competitive Landscape
| Product Code: ETC10242510 | Publication Date: Apr 2025 | Updated Date: Apr 2026 | Product Type: Market Research Report | |
| Publisher: 6Wresearch | Author: Bhawna Singh | No. of Pages: 65 | No. of Figures: 34 | No. of Tables: 19 |
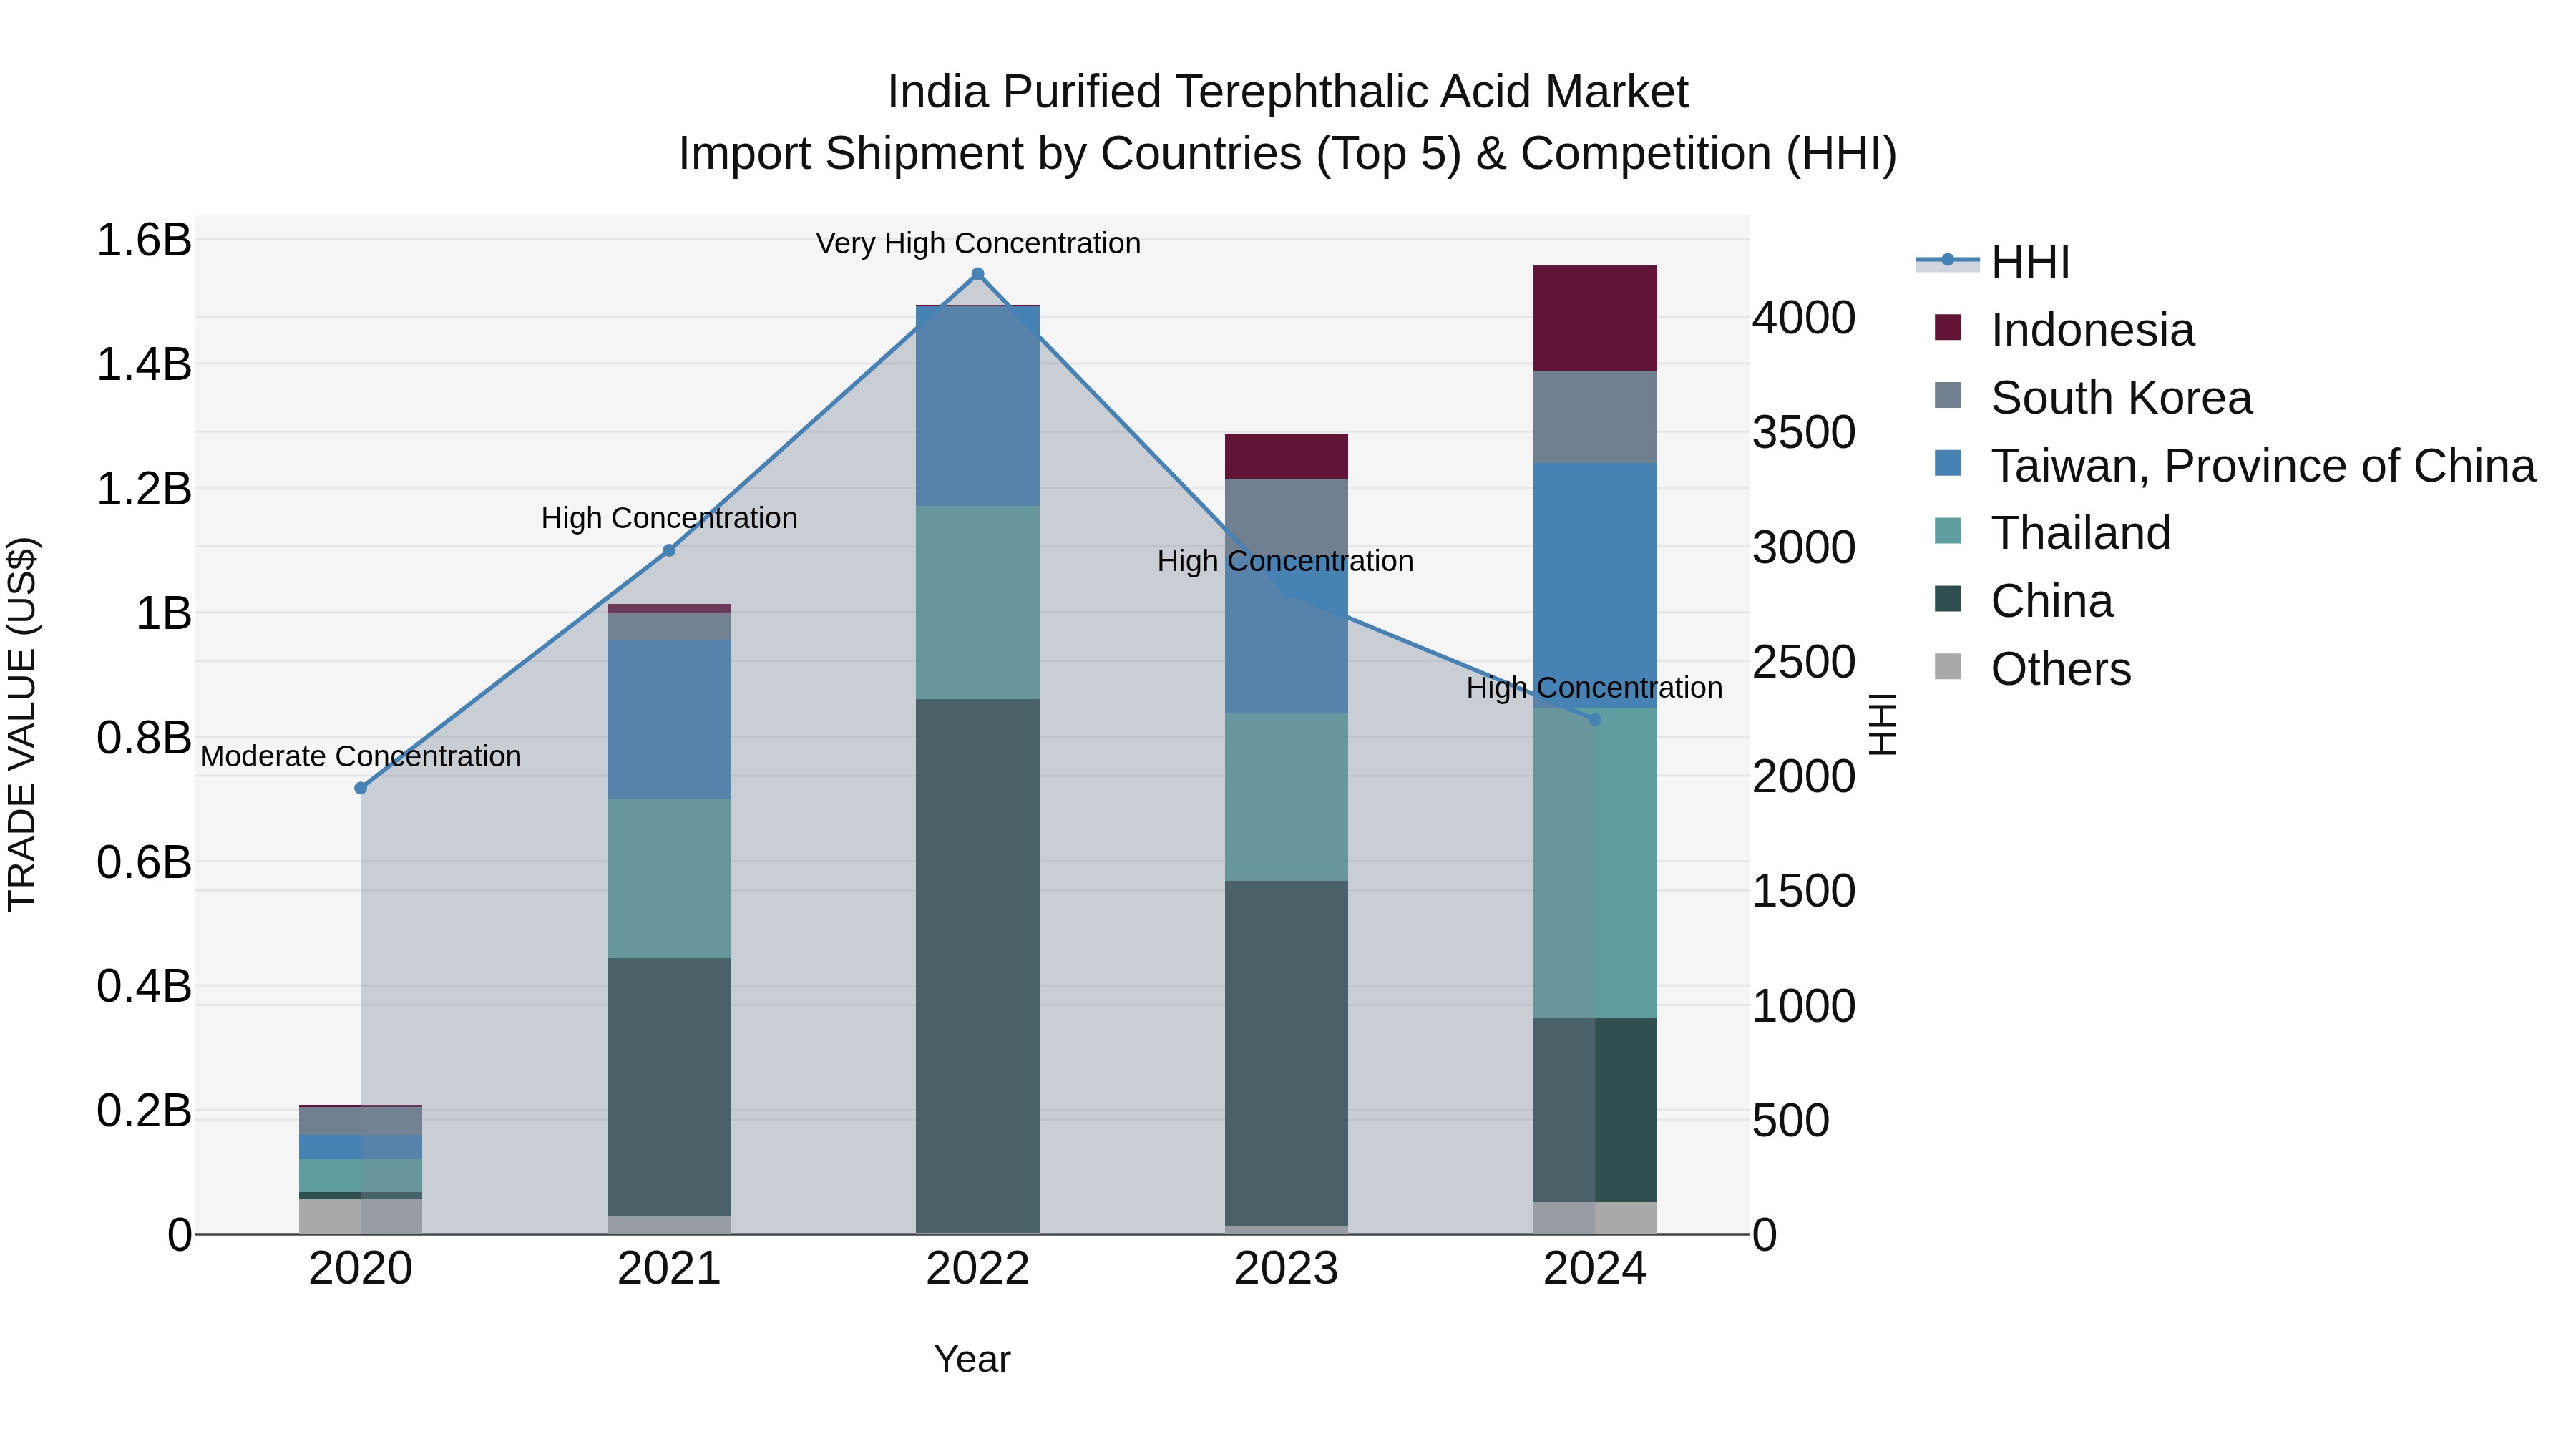
India Purified Terephthalic Acid Market Top 5 Importing Countries and Market Competition (HHI) Analysis
India`s import shipments of purified terephthalic acid in 2024 continued to showcase a high level of concentration, with top exporting countries including Thailand, Taiwan, China, Indonesia, and South Korea. The Herfindahl-Hirschman Index (HHI) remained at a high level, indicating significant market concentration. The compound annual growth rate (CAGR) from 2020 to 2024 was an impressive 65.37%, with a notable growth rate of 20.98% in 2024 alone. These figures suggest a strong demand for purified terephthalic acid in India and highlight the importance of these key exporting countries in meeting that demand.
Key Highlights of the Report:
- India Purified Terephthalic Acid Market Outlook
- Market Size of India Purified Terephthalic Acid Market, 2025
- Forecast of India Purified Terephthalic Acid Market, 2032
- Historical Data and Forecast of India Purified Terephthalic Acid Revenues & Volume for the Period 2022 - 2032F
- India Purified Terephthalic Acid Market Trend Evolution
- India Purified Terephthalic Acid Market Drivers and Challenges
- India Purified Terephthalic Acid Price Trends
- India Purified Terephthalic Acid Porter's Five Forces
- India Purified Terephthalic Acid Industry Life Cycle
- Historical Data and Forecast of India Purified Terephthalic Acid Market Revenues & Volume By Type for the Period 2022 - 2032F
- Historical Data and Forecast of India Purified Terephthalic Acid Market Revenues & Volume By Virgin PTA for the Period 2022 - 2032F
- Historical Data and Forecast of India Purified Terephthalic Acid Market Revenues & Volume By Recycled PTA for the Period 2022 - 2032F
- Historical Data and Forecast of India Purified Terephthalic Acid Market Revenues & Volume By High-Purity PTA for the Period 2022 - 2032F
- Historical Data and Forecast of India Purified Terephthalic Acid Market Revenues & Volume By Fiber Grade PTA for the Period 2022 - 2032F
- Historical Data and Forecast of India Purified Terephthalic Acid Market Revenues & Volume By Industrial Grade PTA for the Period 2022 - 2032F
- Historical Data and Forecast of India Purified Terephthalic Acid Market Revenues & Volume By Application for the Period 2022 - 2032F
- Historical Data and Forecast of India Purified Terephthalic Acid Market Revenues & Volume By Polyester Resins for the Period 2022 - 2032F
- Historical Data and Forecast of India Purified Terephthalic Acid Market Revenues & Volume By Plastic Bottles for the Period 2022 - 2032F
- Historical Data and Forecast of India Purified Terephthalic Acid Market Revenues & Volume By Films & Tapes for the Period 2022 - 2032F
- Historical Data and Forecast of India Purified Terephthalic Acid Market Revenues & Volume By Paints & Coatings for the Period 2022 - 2032F
- Historical Data and Forecast of India Purified Terephthalic Acid Market Revenues & Volume By Adhesives for the Period 2022 - 2032F
- Historical Data and Forecast of India Purified Terephthalic Acid Market Revenues & Volume By End-Use for the Period 2022 - 2032F
- Historical Data and Forecast of India Purified Terephthalic Acid Market Revenues & Volume By Textile for the Period 2022 - 2032F
- Historical Data and Forecast of India Purified Terephthalic Acid Market Revenues & Volume By Packaging for the Period 2022 - 2032F
- Historical Data and Forecast of India Purified Terephthalic Acid Market Revenues & Volume By Electronics for the Period 2022 - 2032F
- Historical Data and Forecast of India Purified Terephthalic Acid Market Revenues & Volume By Automotive for the Period 2022 - 2032F
- Historical Data and Forecast of India Purified Terephthalic Acid Market Revenues & Volume By Construction for the Period 2022 - 2032F
- Historical Data and Forecast of India Purified Terephthalic Acid Market Revenues & Volume By Form for the Period 2022 - 2032F
- Historical Data and Forecast of India Purified Terephthalic Acid Market Revenues & Volume By Powder for the Period 2022 - 2032F
- Historical Data and Forecast of India Purified Terephthalic Acid Market Revenues & Volume By Granules for the Period 2022 - 2032F
- Historical Data and Forecast of India Purified Terephthalic Acid Market Revenues & Volume By Liquid for the Period 2022 - 2032F
- Historical Data and Forecast of India Purified Terephthalic Acid Market Revenues & Volume By Pellets for the Period 2022 - 2032F
- Historical Data and Forecast of India Purified Terephthalic Acid Market Revenues & Volume By Others for the Period 2022 - 2032F
- India Purified Terephthalic Acid Import Export Trade Statistics
- Market Opportunity Assessment By Type
- Market Opportunity Assessment By Application
- Market Opportunity Assessment By End-Use
- Market Opportunity Assessment By Form
- India Purified Terephthalic Acid Top Companies Market Share
- India Purified Terephthalic Acid Competitive Benchmarking By Technical and Operational Parameters
- India Purified Terephthalic Acid Company Profiles
- India Purified Terephthalic Acid Key Strategic Recommendations
Frequently Asked Questions About the Market Study (FAQs):
6Wresearch actively monitors the India Purified Terephthalic Acid Market and publishes its comprehensive annual report, highlighting emerging trends, growth drivers, revenue analysis, and forecast outlook. Our insights help businesses to make data-backed strategic decisions with ongoing market dynamics. Our analysts track relevent industries related to the India Purified Terephthalic Acid Market, allowing our clients with actionable intelligence and reliable forecasts tailored to emerging regional needs.
Yes, we provide customisation as per your requirements. To learn more, feel free to contact us on sales@6wresearch.com
1 Executive Summary |
2 Introduction |
2.1 Key Highlights of the Report |
2.2 Report Description |
2.3 Market Scope & Segmentation |
2.4 Research Methodology |
2.5 Assumptions |
3 India Purified Terephthalic Acid Market Overview |
3.1 India Country Macro Economic Indicators |
3.2 India Purified Terephthalic Acid Market Revenues & Volume, 2022 & 2032F |
3.3 India Purified Terephthalic Acid Market - Industry Life Cycle |
3.4 India Purified Terephthalic Acid Market - Porter's Five Forces |
3.5 India Purified Terephthalic Acid Market Revenues & Volume Share, By Type, 2022 & 2032F |
3.6 India Purified Terephthalic Acid Market Revenues & Volume Share, By Application, 2022 & 2032F |
3.7 India Purified Terephthalic Acid Market Revenues & Volume Share, By End-Use, 2022 & 2032F |
3.8 India Purified Terephthalic Acid Market Revenues & Volume Share, By Form, 2022 & 2032F |
4 India Purified Terephthalic Acid Market Dynamics |
4.1 Impact Analysis |
4.2 Market Drivers |
4.2.1 Increasing demand for polyester in various industries such as textiles, packaging, and automotive |
4.2.2 Growth in population and urbanization leading to higher consumption of consumer goods |
4.2.3 Government initiatives to promote domestic manufacturing and reduce dependency on imports |
4.3 Market Restraints |
4.3.1 Fluctuating raw material prices, especially for feedstock such as paraxylene and ethylene glycol |
4.3.2 Environmental concerns and regulations related to the production of terephthalic acid |
4.3.3 Intense competition from other countries producing purified terephthalic acid |
5 India Purified Terephthalic Acid Market Trends |
6 India Purified Terephthalic Acid Market, By Types |
6.1 India Purified Terephthalic Acid Market, By Type |
6.1.1 Overview and Analysis |
6.1.2 India Purified Terephthalic Acid Market Revenues & Volume, By Type, 2022 - 2032F |
6.1.3 India Purified Terephthalic Acid Market Revenues & Volume, By Virgin PTA, 2022 - 2032F |
6.1.4 India Purified Terephthalic Acid Market Revenues & Volume, By Recycled PTA, 2022 - 2032F |
6.1.5 India Purified Terephthalic Acid Market Revenues & Volume, By High-Purity PTA, 2022 - 2032F |
6.1.6 India Purified Terephthalic Acid Market Revenues & Volume, By Fiber Grade PTA, 2022 - 2032F |
6.1.7 India Purified Terephthalic Acid Market Revenues & Volume, By Industrial Grade PTA, 2022 - 2032F |
6.2 India Purified Terephthalic Acid Market, By Application |
6.2.1 Overview and Analysis |
6.2.2 India Purified Terephthalic Acid Market Revenues & Volume, By Polyester Resins, 2022 - 2032F |
6.2.3 India Purified Terephthalic Acid Market Revenues & Volume, By Plastic Bottles, 2022 - 2032F |
6.2.4 India Purified Terephthalic Acid Market Revenues & Volume, By Films & Tapes, 2022 - 2032F |
6.2.5 India Purified Terephthalic Acid Market Revenues & Volume, By Paints & Coatings, 2022 - 2032F |
6.2.6 India Purified Terephthalic Acid Market Revenues & Volume, By Adhesives, 2022 - 2032F |
6.3 India Purified Terephthalic Acid Market, By End-Use |
6.3.1 Overview and Analysis |
6.3.2 India Purified Terephthalic Acid Market Revenues & Volume, By Textile, 2022 - 2032F |
6.3.3 India Purified Terephthalic Acid Market Revenues & Volume, By Packaging, 2022 - 2032F |
6.3.4 India Purified Terephthalic Acid Market Revenues & Volume, By Electronics, 2022 - 2032F |
6.3.5 India Purified Terephthalic Acid Market Revenues & Volume, By Automotive, 2022 - 2032F |
6.3.6 India Purified Terephthalic Acid Market Revenues & Volume, By Construction, 2022 - 2032F |
6.4 India Purified Terephthalic Acid Market, By Form |
6.4.1 Overview and Analysis |
6.4.2 India Purified Terephthalic Acid Market Revenues & Volume, By Powder, 2022 - 2032F |
6.4.3 India Purified Terephthalic Acid Market Revenues & Volume, By Granules, 2022 - 2032F |
6.4.4 India Purified Terephthalic Acid Market Revenues & Volume, By Liquid, 2022 - 2032F |
6.4.5 India Purified Terephthalic Acid Market Revenues & Volume, By Pellets, 2022 - 2032F |
6.4.6 India Purified Terephthalic Acid Market Revenues & Volume, By Others, 2022 - 2032F |
7 India Purified Terephthalic Acid Market Import-Export Trade Statistics |
7.1 India Purified Terephthalic Acid Market Export to Major Countries |
7.2 India Purified Terephthalic Acid Market Imports from Major Countries |
8 India Purified Terephthalic Acid Market Key Performance Indicators |
8.1 Capacity utilization rate of purified terephthalic acid plants in India |
8.2 Average selling price of purified terephthalic acid in the domestic market |
8.3 Energy efficiency and carbon footprint of the production process |
8.4 Investment in research and development for process improvements and cost reduction |
9 India Purified Terephthalic Acid Market - Opportunity Assessment |
9.1 India Purified Terephthalic Acid Market Opportunity Assessment, By Type, 2022 & 2032F |
9.2 India Purified Terephthalic Acid Market Opportunity Assessment, By Application, 2022 & 2032F |
9.3 India Purified Terephthalic Acid Market Opportunity Assessment, By End-Use, 2022 & 2032F |
9.4 India Purified Terephthalic Acid Market Opportunity Assessment, By Form, 2022 & 2032F |
10 India Purified Terephthalic Acid Market - Competitive Landscape |
10.1 India Purified Terephthalic Acid Market Revenue Share, By Companies, 2025 |
10.2 India Purified Terephthalic Acid Market Competitive Benchmarking, By Operating and Technical Parameters |
11 Company Profiles |
12 Recommendations |
13 Disclaimer |
Export potential assessment - trade Analytics for 2030
Export potential enables firms to identify high-growth global markets with greater confidence by combining advanced trade intelligence with a structured quantitative methodology. The framework analyzes emerging demand trends and country-level import patterns while integrating macroeconomic and trade datasets such as GDP and population forecasts, bilateral import–export flows, tariff structures, elasticity differentials between developed and developing economies, geographic distance, and import demand projections. Using weighted trade values from 2020–2024 as the base period to project country-to-country export potential for 2030, these inputs are operationalized through calculated drivers such as gravity model parameters, tariff impact factors, and projected GDP per-capita growth. Through an analysis of hidden potentials, demand hotspots, and market conditions that are most favorable to success, this method enables firms to focus on target countries, maximize returns, and global expansion with data, backed by accuracy.
By factoring in the projected importer demand gap that is currently unmet and could be potential opportunity, it identifies the potential for the Exporter (Country) among 190 countries, against the general trade analysis, which identifies the biggest importer or exporter.
To discover high-growth global markets and optimize your business strategy:
Click Here
Pricing
- Single User License$ 1,995
- Department License$ 2,400
- Site License$ 3,120
- Global License$ 3,795

Search
Thought Leadership and Analyst Meet


Our Clients
Latest Reports
- China Electric Appliance Rental Market (2026-2032) | Trends, Revenue, Growth, Challenges, Size, Value, Outlook, Pricing, Strategy, Insights, Restraints, segmentation, Companies, Investment Opportunities, Analysis, Demand, Drivers, Competition, Forecast, Share
- Chile Electric Appliance Rental Market (2026-2032) | Outlook, Competition, Drivers, Strategy, Revenue, Analysis, Value, Pricing, Restraints, Size, Demand, Share, Growth, Forecast, Challenges, Insights, Investment Opportunities, Companies, Trends, segmentation
- Cambodia Electric Appliance Rental Market (2026-2032) | Companies, Analysis, Restraints, Pricing, Insights, Challenges, Outlook, Strategy, Forecast, Trends, Competition, Value, Revenue, Investment Opportunities, segmentation, Drivers, Size, Demand, Growth, Share
- Brazil Electric Appliance Rental Market (2026-2032) | Revenue, Strategy, Forecast, Companies, segmentation, Competition, Size, Investment Opportunities, Pricing, Restraints, Outlook, Challenges, Analysis, Drivers, Value, Demand, Insights, Trends, Growth, Share
- Bangladesh Electric Appliance Rental Market (2026-2032) | Drivers, Forecast, Investment Opportunities, Strategy, Insights, Demand, Challenges, Outlook, Trends, Competition, Value, Revenue, Size, Pricing, Analysis, Companies, Restraints, segmentation, Share, Growth
- Bahrain Electric Appliance Rental Market (2026-2032) | Outlook, Size, Competition, Restraints, Drivers, Value, Trends, Investment Opportunities, Insights, Forecast, Revenue, Strategy, Growth, Share, Demand, Analysis, Challenges, Companies, segmentation, Pricing
- Azerbaijan Electric Appliance Rental Market (2026-2032) | Trends, Investment Opportunities, Restraints, Insights, Strategy, Competition, Value, Growth, Demand, Drivers, Analysis, Forecast, Size, Share, Outlook, segmentation, Pricing, Challenges, Revenue, Companies
- Australia Electric Appliance Rental Market (2026-2032) | Challenges, Restraints, Forecast, Demand, Size, Competition, Pricing, Investment Opportunities, Revenue, Trends, Drivers, Growth, Outlook, Analysis, Strategy, Value, segmentation, Insights, Companies, Share
- Argentina Electric Appliance Rental Market (2026-2032) | Growth, Trends, Insights, Outlook, Forecast, Size, Drivers, Analysis, Restraints, Challenges, Share, Revenue, Investment Opportunities, Strategy, Demand, Value, Companies, segmentation, Competition, Pricing
- Algeria Electric Appliance Rental Market (2026-2032) | Share, Size, Value, Strategy, Competition, Outlook, Challenges, Companies, Trends, Pricing, Insights, Forecast, Investment Opportunities, Revenue, Growth, Restraints, segmentation, Analysis, Demand, Drivers
Industry Events and Analyst Meet

HIMTEX 2026

India Refining Summit 2026

India EV Show 2026

EV tech India Expo 2026

Auto Tech Asia 2026
Whitepaper
- Middle East & Africa Commercial Security Market Click here to view more.
- Middle East & Africa Fire Safety Systems & Equipment Market Click here to view more.
- GCC Drone Market Click here to view more.
- Middle East Lighting Fixture Market Click here to view more.
- GCC Physical & Perimeter Security Market Click here to view more.
6WResearch In News
- Doha a strategic location for EV manufacturing hub: IPA Qatar
- Demand for luxury TVs surging in the GCC, says Samsung
- Empowering Growth: The Thriving Journey of Bangladesh’s Cable Industry
- Demand for luxury TVs surging in the GCC, says Samsung
- Video call with a traditional healer? Once unthinkable, it’s now common in South Africa
- Intelligent Buildings To Smooth GCC’s Path To Net Zero