1. Executive Summary
2. Introduction
2.1. Report Description
2.2 Key Highlights of The Report
2.3. Market Scope & Segmentation
2.4. Research Methodology
2.5. Assumptions
3. Global Telecom Tower Power Systems Market Overview
3.1. Global Telecom Tower Power Systems Market Revenues, 2014-2023F
4. India Telecom Tower Industry Overview
5. India Telecom Tower Power Systems Market Overview
5.1. India Telecom Tower Power Systems Market Revenues, 2014-2023F
5.2. India Telecom Tower Power Systems Market Volume, 2014-2023F
5.3. India Telecom Tower Power Systems Market Industry Life cycle
5.4. India Telecom Tower Power Systems Market Porter's Five Forces Model
5.5. India Telecom Tower Power Systems Market Revenue Share, By Types, 2016 & 2023F
5.6. India Telecom Tower Power Systems Market Revenue Share, By Regions, 2016 & 2023F
6. India Telecom Tower Power Systems Market Dynamics
6.1. Impact Analysis
6.2. Market Drivers
6.3. Market Restraints
7. India Telecom Tower Power Systems Market Trends
8. India Telecom Tower Power Systems Market, By Types
8.1. India Telecom Tower Diesel Genset Market Revenues & Volume, 2014-2023F
8.2. India Telecom Tower Battery System Market Revenues & Volume, 2014-2023F
8.2.1. India Telecom Tower Lead Acid Battery System Market Revenues & Volume, 2014-2023F
8.2.2. India Telecom Tower Lithium-ion Battery System Market Revenues & Volume, 2014-2023F
8.3. India Telecom Tower Solar Power System Market Revenues & Volume, 2014-2023F
9. India Telecom Tower Power Systems Market Overview, By Grid Type
9.1. India Reliable Grid Telecom Tower Power Systems Market Overview, By Types
9.1.1. India Reliable Grid Telecom Tower Power Systems Market Revenue & Volume Share,
By Types, 2016 & 2023F
9.1.2. India Reliable Grid Telecom Tower Power Systems Market Revenues, 2014-2023F
9.1.3. India Reliable Grid Telecom Tower Power Systems Market Volume, 2014-2023F
9.1.4. India Reliable Grid Telecom Tower Diesel Genset Market Revenues & Volume, 2014-2023F
9.1.5. India Reliable Grid Telecom Tower Battery System Market Revenues & Volume, 2014-2023F
9.1.6. India Reliable Grid Telecom Tower Solar Power System Market Revenues & Volume, 2014-2023F
9.2. India Unreliable Grid Telecom Tower Power Systems Market Overview, By Types
9.2.1. India Unreliable Grid Telecom Tower Power Systems Market Revenue & Volume Share,
By Types, 2016 & 2023F
9.2.2. India Unreliable Grid Telecom Tower Power Systems Market Revenues, 2014-2023F
9.2.3. India Unreliable Grid Telecom Tower Power Systems Market Volume, 2014-2023F
9.2.4. India Unreliable Grid Telecom Tower Diesel Genset Market Revenues & Volume, 2014-2023F
9.2.5. India Unreliable Grid Telecom Tower Battery System Market Revenues & Volume, 2014-2023F
9.2.6. India Unreliable Grid Telecom Tower Solar Power System Market Revenues & Volume, 2014-2023F
9.3. India Telecom Tower Power Systems Market Overview, By Off Grid
9.3.1. India Off Grid Telecom Tower Power Systems Market Revenue & Volume Share,
By Types, 2016 & 2023F
9.3.2. India Off Grid Telecom Tower Power Systems Market Revenues, 2014-2023F
9.3.3. India Off Grid Telecom Tower Power Systems Market Volume, 2014-2023F
9.3.4. India Off Grid Telecom Tower Diesel Genset Market Revenues & Volume, 2014-2023F
9.3.5. India Off Grid Telecom Tower Battery System Market Revenues & Volume, 2014-2023F
9.3.6. India Off Grid Telecom Tower Solar Power System Market Revenues & Volume, 2014-2023F
10. India Telecom Tower Power Systems Market Overview, By Regions
10.1. Northern Region Telecom Tower Power Systems Market Revenues, 2014-2023F
10.2. Western Region Telecom Tower Power Systems Market Revenues, 2014-2023F
10.3. Southern Region Telecom Tower Power Systems Market Revenues, 2014-2023F
10.4. Eastern Region Telecom Tower Power Systems Market Revenues, 2014-2023F
11. India Telecom Tower Power Systems Market Opportunity Assessment
11.1. India Telecom Tower Power Systems Market Opportunity Assessment, By Types
12. Competitive Landscape
12.1. India Telecom Tower Diesel Genset Market Revenue Share, By Company
12.2. India Telecom Tower Battery System Market Revenue Share, By Company
12.3. Competitive Benchmarking, By Product Type
13. Company Profiles
13.1. Ashok Leyland
13.2. Cummins India Ltd.
13.3. VE Commercial (Eicher)
13.4. Kirloskar Oil Engines Ltd.
13.5. Mahindra & Mahindra Ltd.
13.6. Amara Raja Power Systems
13.7. HBL Power Systems Limited
13.8. Exide Industries Limited
13.9. Coslight India Telecom Pvt Ltd
13.10. SAFT
14. Strategic Recommendations
15. Disclaimer
List of Figures
1. Global Telecom Tower Power Systems Market Revenues, 2014-2023F ($ Billion)
2. India Cumulative Telecom Towers, 2014-2023F (Thousand Units)
3. India New Installed Telecom Towers, 2014-2023F (Thousand Units)
4. India Telecom Towers Industry Ownership, 2016
5. India Base Transceiver Stations (BTS), By Technology (March 2017)
6. India Telecom Towers Distribution, By Grid Type, 2016 & 2023F
7. India Telecom Towers Distribution, By Grid Type, By Power Systems Combination, 2016 & 2023F
8. India Telecom Tower Power Systems Market Revenues, 2014-2023F ($ Million)
9. India Telecom Tower Power Systems Market Volume, 2014-2023F (Thousand units)
10. Telecom Tower Power Systems Market Industry Life Cycle
11. Telecom Tower Power Systems Market Porter's Five Forces Model
12. India Telecom Tower Power Systems Market Revenue Share, By Types, 2016 & 2023F
13. India Telecom Tower Power Systems Market Volume Share, By Types, 2016 & 2023F
14. India Telecom Tower Power Systems Market Revenue Share, By Regions, 2016 & 2023F
15. India Mobile Subscribers, 2015 & 2020 (Millions)
16. All India Total Cellular and GSM Cellular Subscribers, March 2017 (Million)
17. Rural Wireless Subscribers and Urban Wireless Subscribers Share, March 2017
18. Mobile Users In India By Network Connection 2016-2018
19. Smartphone Adoption Trend In India, 2014-2020F
20. Pre Solar and Post Solar OPEX Comparison For 1 BTS Site
21. India Telecom Tower Diesel Genset Market Revenues & Volume, 2014-2023F, ($ Million, Thousand Units)
22. India Telecom Tower Battery Systems Market Revenues & Volume, 2014-2023F, ($ Million, Thousand Units)
23. India Telecom Tower Lead Acid Battery System Market Revenues & Volume, 2014-2023F
($ Million, Thousand Units)
24. India Telecom Tower Lithium Ion Battery System Market Revenues & Volume, 2014-2023F
($ Million, Thousand Units)
25. India Telecom Tower Solar Power Systems Market Revenues & Volume, 2014-2023F ($ Million, Units)
26. Solar Power Map of India
27. India Telecom Tower Power Systems Market Revenue Share, By Reliable Grid, 2016 & 2023F
28. India Telecom Tower Power Systems Market Volume Share, By Reliable Grid, 2016 & 20123F
29. India Reliable Grid Telecom Tower Power Systems Market Revenues, 2014-2023F ($ Million)
30. India Reliable Grid Telecom Tower Power Systems Market Volume, 2014-2023F (Thousand Units)
31. India Reliable Grid Telecom Tower Diesel Genset Market Revenues & Volume, 2014-2023F
($ Million, Thousand Units)
32. India Reliable Grid Telecom Tower Battery Systems Market Revenues & Volume, 2014-2023F
($ Million, Thousand Units)
33. India Reliable Grid Telecom Tower Solar Power Systems Market Revenues & Volume, 2014-2023F ($ Million, Units)
34. India Telecom Tower Power Systems Market Revenue Share, By Unreliable Grid, 2016 & 2023F
35. India Telecom Tower Power Systems Market Volume Share, By Unreliable Grid, 2016 & 2023F
36. India Unreliable Grid Telecom Tower Power Systems Market Revenues, 2014-2023F ($ Million)
37. India Unreliable Grid Telecom Tower Power Systems Market Volume, 2014-2023F (Thousand Units)
38. India Unreliable Grid Telecom Tower Diesel Genset Market Revenues & Volume, 2014-2023F
($ Million, Thousand Units)
39. India Unreliable Grid Telecom Tower Battery Systems Market Revenues & Volume, 2014-2023F
($ Million, Thousand Units)
40. India Unreliable Grid Telecom Tower Solar Power Systems Market Revenues & Volume, 2014-2023F
($ Million, Units)
41. India Telecom Tower Power Systems Market Revenue Share, By Off Grid, 2016 & 2023F
42. India Telecom Tower Power Systems Market Volume Share, By Off Grid, 2016 & 2023F
43. India Off Grid Telecom Tower Power Systems Market Revenues, 2014-2023F ($ Million)
44. India Off Grid Telecom Tower Power Systems Market Volume, 2014-2023F (Thousand Units)
45. India Off Grid Telecom Tower Diesel Genset Market Revenues & Volume, 2014-2023F ($ Million, Thousand Units)
46. India Off Grid Telecom Tower Battery Systems Market Revenues & Volume, 2014-2023F ($ Million, Thousand Units)
47. India Off Grid Telecom Tower Solar Power Systems Market Revenues & Volume, 2014-2023F ($ Million, Units)
48. Northern Region Telecom Tower Power Systems Market Revenues, 2014-2023F ($ Million)
49. Western Region Telecom Tower Power Systems Market Revenues, 2014-2023F ($ Million)
50. Southern Region Telecom Tower Power Systems Market Revenues, 2014-2023F ($ Million)
51. Eastern Region Telecom Tower Power Systems Market Revenues, 2014-2023F ($ Million)
52. Overall Tele-density (Circle/State Wise), 2016
53. India Telecom Tower Power systems Market Opportunity Matrix
54. India Telecom Tower Diesel Genset Market Revenue Share, By Company, 2016
55. India Telecom Tower Lead Acid Battery System Market Revenue Share, By Company, 2016
56. Lithium-ion Battery Prices, 2017-2024 ($)
List of Tables
1. Telecom Tower Power Systems Analysis
2. FDI in Telecommunication Sector, 2012-2017
3. Direct Cost of Energy at the Site per Day
4. Diesel Generator Maintenance Cost Per Day
5. Battery Maintenance Cost Per Day
6. Diesel Genset Pros and Cons
7. Comparison Between Different Renewable Power Solutions For Telecom Towers
8. Comparison between Led acid And Lithium Ion Battery
9. Comparison Between Solar and Non Solar Telecom Towers
10. Region Wise BTS's Installed At Mobile Towers As On 29.02.2016
11. India Wireless Subscriber Base, 2016
Global Go To Market Strategy - 2030
Export potential enables firms to identify high-growth global markets with greater confidence by combining advanced trade intelligence with a structured quantitative methodology. The framework analyzes emerging demand trends and country-level import patterns while integrating macroeconomic and trade datasets such as GDP and population forecasts, bilateral import–export flows, tariff structures, elasticity differentials between developed and developing economies, geographic distance, and import demand projections. Using weighted trade values from 2020–2024 as the base period to project country-to-country export potential for 2030, these inputs are operationalized through calculated drivers such as gravity model parameters, tariff impact factors, and projected GDP per-capita growth. Through an analysis of hidden potentials, demand hotspots, and market conditions that are most favorable to success, this method enables firms to focus on target countries, maximize returns, and global expansion with data, backed by accuracy.
By factoring in the projected importer demand gap that is currently unmet and could be potential opportunity, it identifies the potential for the Exporter (Country) among 190 countries, against the general trade analysis, which identifies the biggest importer or exporter.
To discover high-growth global markets and optimize your business strategy:
Click Here
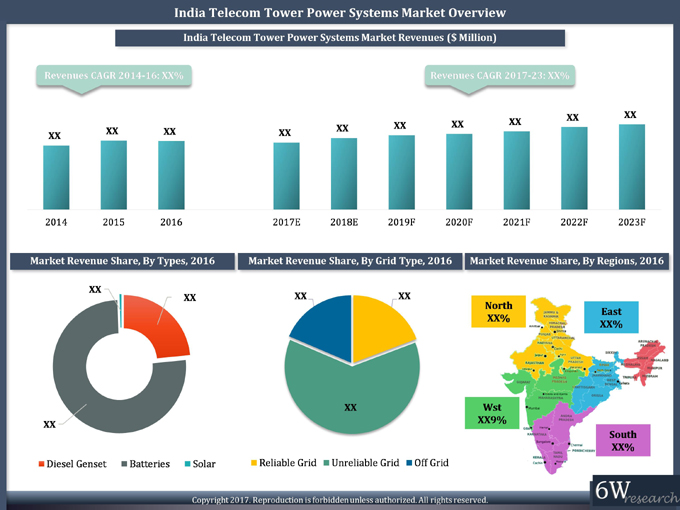 Tier 2 and tier 3 cities would experience the highest India telecom tower power systems market share due to the growing subscriber base and increasing internet penetration. Power systems installed in unreliable grid sites account for maximum revenue share followed by reliable grid sites due to improvement in power supply position. Advance technology such as lithium-ion batteries would also witness growth in the coming years.The India telecom tower power systems market report thoroughly covers the India telecom tower power systems market by types, grid type and by regions. The India telecom tower power systems market outlook report provides an unbiased and detailed analysis of the on-going India telecom tower power systems market trends, opportunities high growth areas, market drivers which would help the stakeholders to device and align their market strategies according to the current and future market dynamics.