India V-belts Market (2025-2031) Outlook | Revenue, Companies, Growth, Share, Industry, Size, Value, Analysis, Trends & Forecast
Market Forecast By Material Used (Rubber, Polymer, Neoprene, Urethane Synthetic Materials), By Types (Heavy Duty), By End-use Industries (Paper And Pulp, Cement, Power And Energy, Food And Beverage, Agricultural, Automotive, Metals And Mining) And Competitive Landscape
| Product Code: ETC351144 | Publication Date: Aug 2022 | Updated Date: Nov 2025 | Product Type: Market Research Report | |
| Publisher: 6Wresearch | Author: Ravi Bhandari | No. of Pages: 75 | No. of Figures: 35 | No. of Tables: 20 |
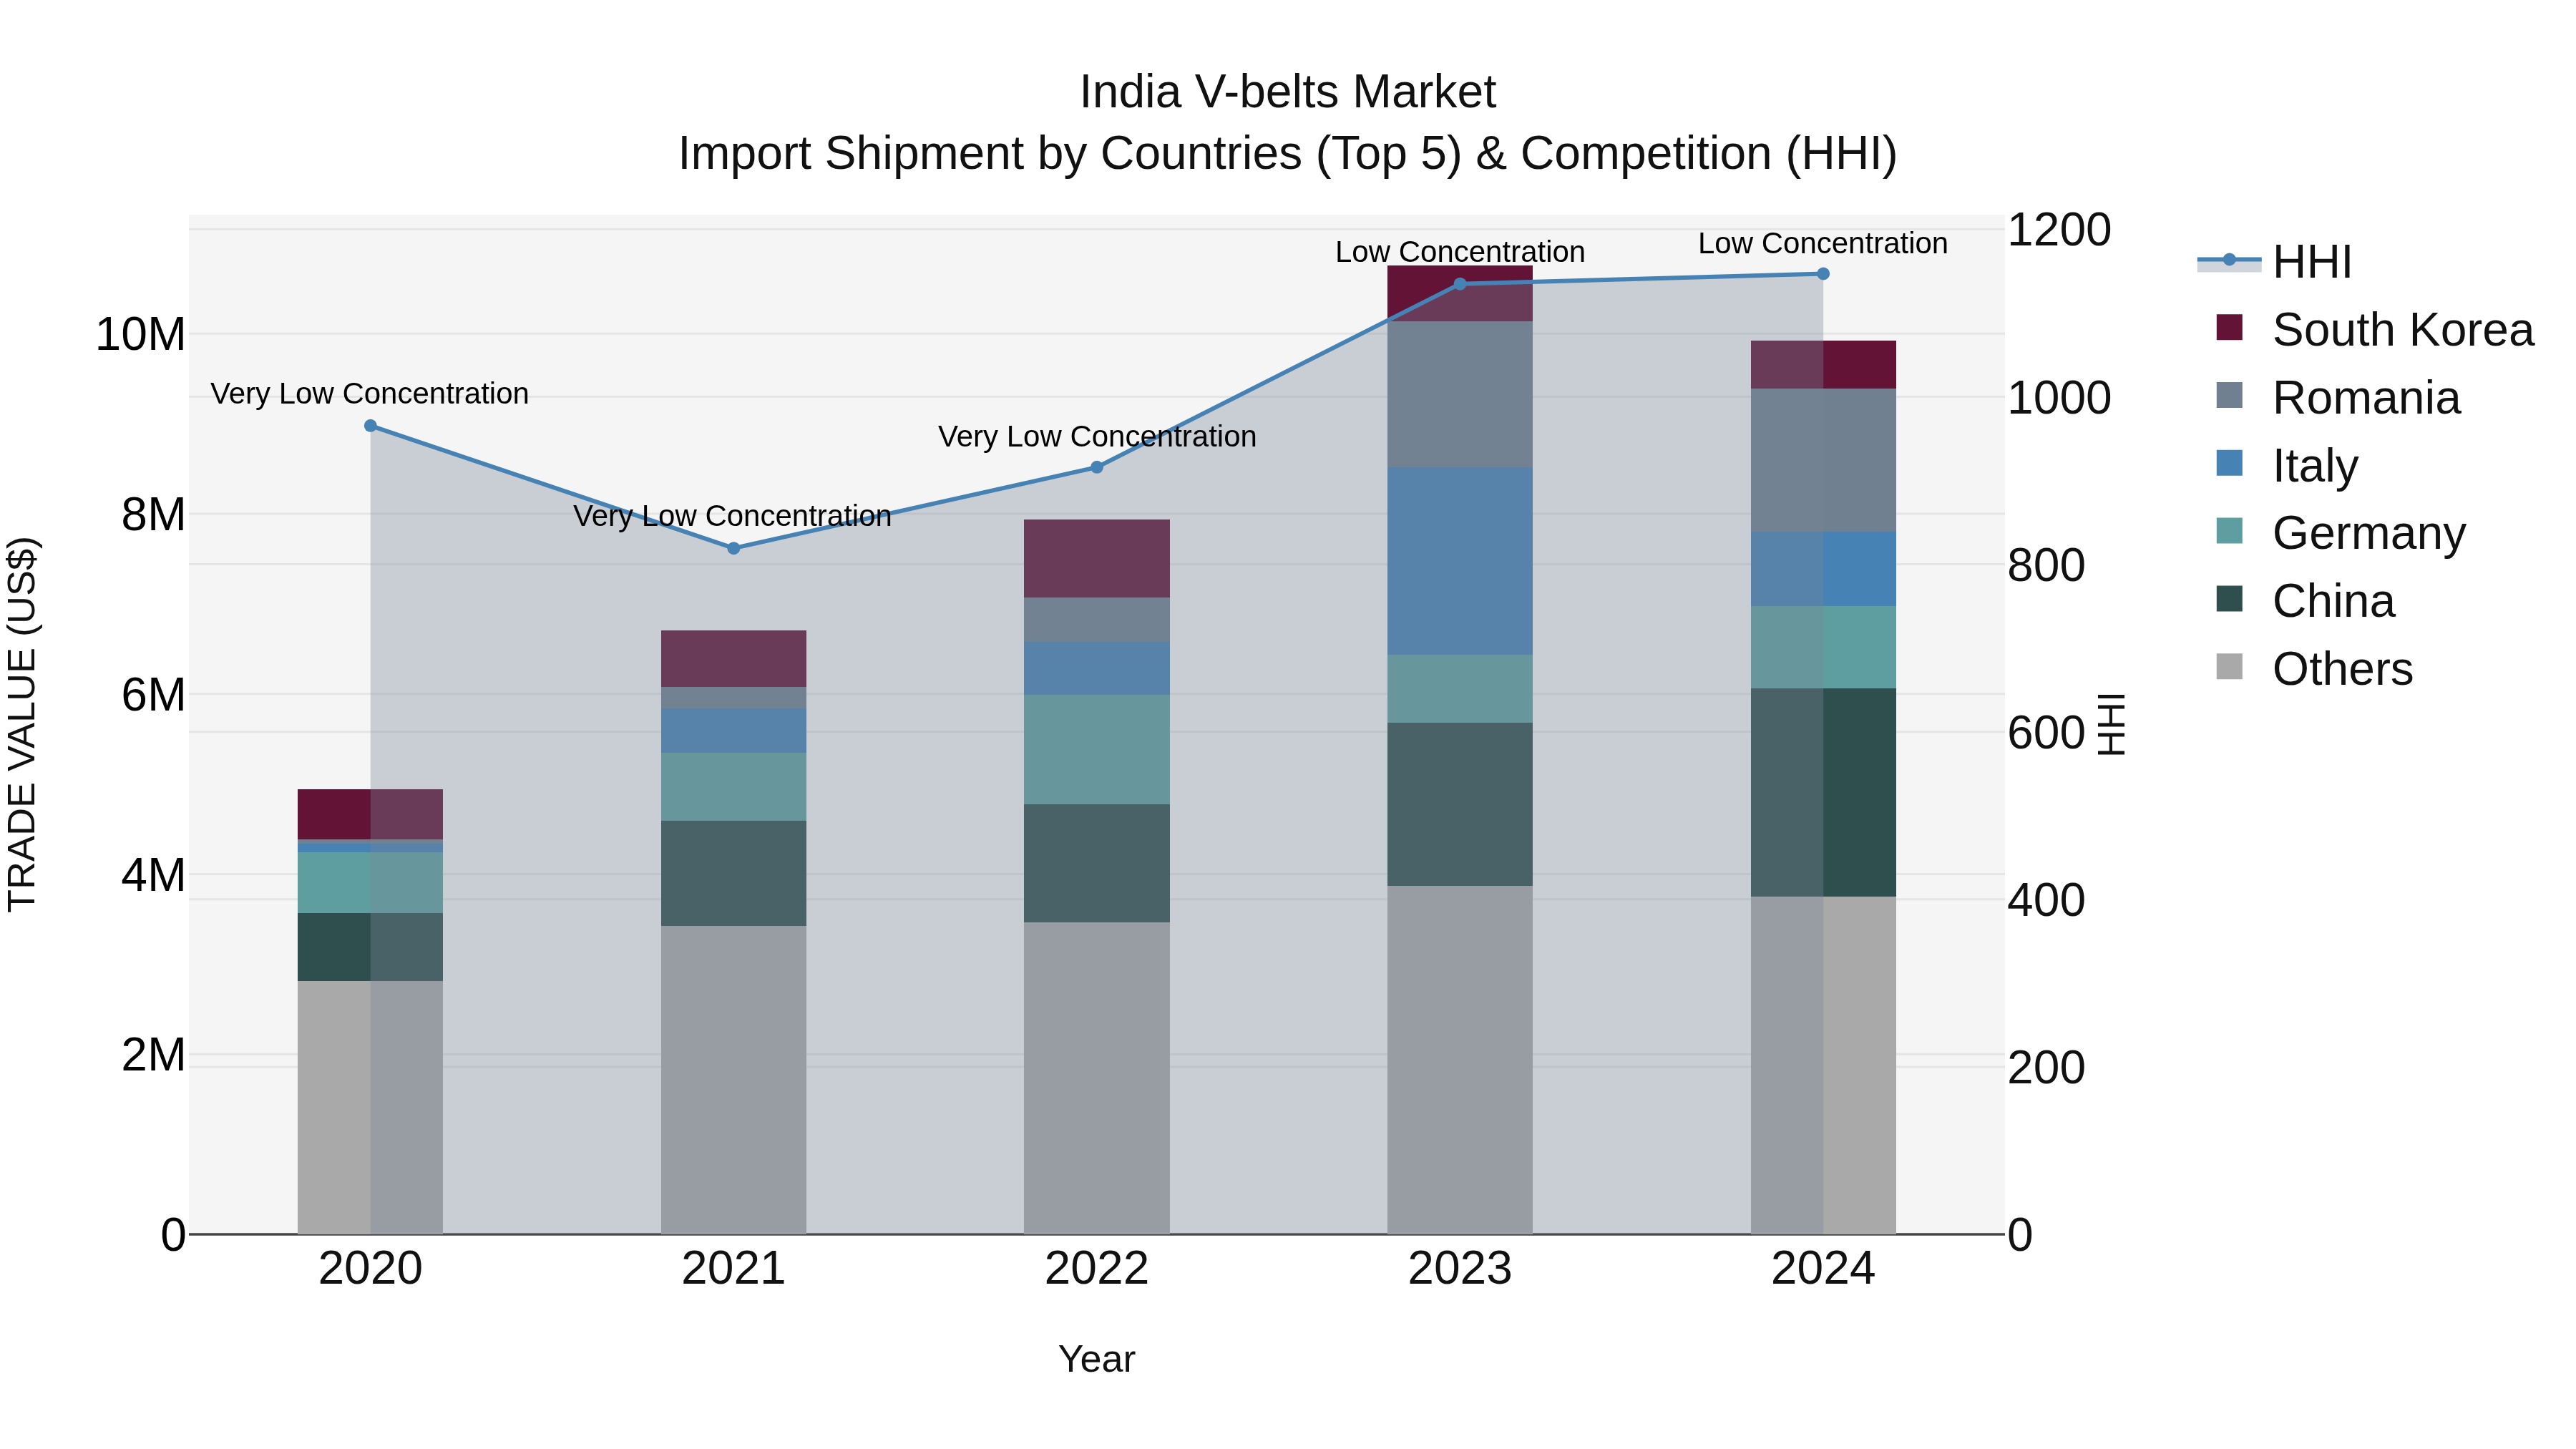
India V-belts Market Top 5 Importing Countries and Market Competition (HHI) Analysis
India`s V-belts import market in 2024 saw significant contributions from top exporting countries including China, Romania, Japan, Germany, and Italy. Despite the competitive landscape, the market remained relatively unconcentrated with a low Herfindahl-Hirschman Index (HHI). The compound annual growth rate (CAGR) from 2020 to 2024 stood at an impressive 19.03%, indicating a robust expansion. However, there was a slight decline in growth rate from 2023 to 2024 at -7.72%, which could be attributed to various factors influencing the market dynamics during that period.
India V-belts Market Synopsis
The India v belt market stood at US$ 199 million in 2025 and is projected to grow at a compound annual growth rate of 7%. Factors such as increasing industrial automation across various sectors such as automotive, healthcare, chemicals & petrochemicals etc., along with expanding vehicle production will drive increased demand for v belts throughout India.
Market Drivers of the market
The India V belts market is driven by several factors that contribute to its growth. One of the key drivers is the extensive usage of V belts in various industries, including automotive, agriculture, manufacturing, and mining, for power transmission applications. V belts are known for their high efficiency, reliability, and ability to transmit power over long distances, making them essential components in machinery and equipment. The growth of these industries, coupled with the expanding industrial sector, supports the demand for V belts in India. Additionally, the increasing focus on automation and mechanization in industries drives the need for high-performance power transmission solutions, further fueling market demand. Moreover, the rise of the automotive aftermarket and the need for replacement belts in vehicles contribute to market growth. Furthermore, the availability of V belts in different sizes and specifications meets the diverse requirements of end-users, supporting the market`s expansion in India.
Challenges of the Market
The India V belts market faces several challenges that impact its growth and sustainability. One of the key challenges is the competition from alternative power transmission solutions, such as synchronous belts and chain drives. These alternatives offer specific advantages in certain applications, and manufacturers of V belts need to emphasize the unique benefits of their products to remain competitive. Moreover, the market may encounter challenges related to the availability and cost of raw materials used in V belt production, such as rubber and polyester. Fluctuations in raw material prices can impact the cost-effectiveness of V belts, making it essential for manufacturers to manage supply chain dynamics efficiently. Additionally, counterfeit and low-quality V belts in the market can undermine the reputation of genuine manufacturers and pose safety risks to end-users. Ensuring product authenticity and implementing quality control measures are crucial to build consumer trust and promote safe usage. Furthermore, the adoption of advanced power transmission technologies and automation in industries may reduce the demand for V belts in certain applications. Manufacturers need to focus on innovation and product diversification to cater to changing industry requirements and maintain market relevance. Addressing these challenges through strategic planning, quality assurance, and product differentiation will be vital for the India V belts market to thrive in the face of competition and technological advancements.
Covid-19 Impact on the Market
The COVID-19 pandemic had a mixed impact on the India V belts market. With industrial activities and construction projects facing restrictions during lockdowns, demand for V belts in sectors like automotive, manufacturing, and construction experienced a temporary decline. The reduced production and limited mobility also impacted the replacement market for V belts. However, the pandemic also created new opportunities for V belts in essential sectors like agriculture, healthcare, and logistics. The demand for essential goods and services during the pandemic led to increased utilization of machinery and vehicles, driving the need for V belts in these applications. Additionally, the shift towards e-commerce and last-mile delivery services during the pandemic created demand for V belts in logistics and transportation. The market faced challenges in terms of supply chain disruptions and raw material availability, impacting manufacturing and distribution. Manufacturers had to adapt to changing market dynamics and optimize production to meet demand fluctuations. As the economy recovers and industries resume operations, the V belts market is expected to witness a gradual rebound, driven by the resumption of construction activities and the growing demand for automation and machinery in various sectors.
Key Players of the Market
The India V belts market comprises several key players that supply high-quality power transmission solutions for various industries. Companies such as Fenner India Limited, Pix Transmissions Ltd., and Gates India Pvt. Ltd. are among the leading players in this segment. These companies offer a wide range of V belts, including classical, narrow, and specialty designs, catering to diverse applications in automotive, industrial, and agricultural sectors. Their V belts are known for their reliability, durability, and efficiency in power transmission. Moreover, the key players actively invest in technology and manufacturing advancements to provide V belts with enhanced performance characteristics, such as high heat resistance and anti-static properties. They also maintain strong customer relationships and technical support to guide end-users in selecting the right V belts for their specific applications. By consistently delivering reliable and high-performance V belts, these key players continue to shape the growth and competitiveness of the V belts market in India.
Key Highlights of the Report:
- India V-belts Market Outlook
- Market Size of India V-belts Market, 2024
- Forecast of India V-belts Market, 2031
- Historical Data and Forecast of India V-belts Revenues & Volume for the Period 2021-2031
- India V-belts Market Trend Evolution
- India V-belts Market Drivers and Challenges
- India V-belts Price Trends
- India V-belts Porter's Five Forces
- India V-belts Industry Life Cycle
- Historical Data and Forecast of India V-belts Market Revenues & Volume By Material Used for the Period 2021-2031
- Historical Data and Forecast of India V-belts Market Revenues & Volume By Rubber for the Period 2021-2031
- Historical Data and Forecast of India V-belts Market Revenues & Volume By Polymer for the Period 2021-2031
- Historical Data and Forecast of India V-belts Market Revenues & Volume By Neoprene for the Period 2021-2031
- Historical Data and Forecast of India V-belts Market Revenues & Volume By Urethane Synthetic Materials for the Period 2021-2031
- Historical Data and Forecast of India V-belts Market Revenues & Volume By Types for the Period 2021-2031
- Historical Data and Forecast of India V-belts Market Revenues & Volume By Heavy Duty for the Period 2021-2031
- Historical Data and Forecast of India V-belts Market Revenues & Volume By End-use Industries for the Period 2021-2031
- Historical Data and Forecast of India V-belts Market Revenues & Volume By Paper And Pulp for the Period 2021-2031
- Historical Data and Forecast of India V-belts Market Revenues & Volume By Cement for the Period 2021-2031
- Historical Data and Forecast of India V-belts Market Revenues & Volume By Power And Energy for the Period 2021-2031
- Historical Data and Forecast of India V-belts Market Revenues & Volume By Food And Beverage for the Period 2021-2031
- Historical Data and Forecast of India V-belts Market Revenues & Volume By Agricultural for the Period 2021-2031
- Historical Data and Forecast of India V-belts Market Revenues & Volume By Automotive for the Period 2021-2031
- Historical Data and Forecast of India V-belts Market Revenues & Volume By Metals And Mining for the Period 2021-2031
- India V-belts Import Export Trade Statistics
- Market Opportunity Assessment By Material Used
- Market Opportunity Assessment By Types
- Market Opportunity Assessment By End-use Industries
- India V-belts Top Companies Market Share
- India V-belts Competitive Benchmarking By Technical and Operational Parameters
- India V-belts Company Profiles
- India V-belts Key Strategic Recommendations
Frequently Asked Questions About the Market Study (FAQs):
6Wresearch actively monitors the India V-belts Market and publishes its comprehensive annual report, highlighting emerging trends, growth drivers, revenue analysis, and forecast outlook. Our insights help businesses to make data-backed strategic decisions with ongoing market dynamics. Our analysts track relevent industries related to the India V-belts Market, allowing our clients with actionable intelligence and reliable forecasts tailored to emerging regional needs.
Yes, we provide customisation as per your requirements. To learn more, feel free to contact us on sales@6wresearch.com
1 Executive Summary |
2 Introduction |
2.1 Key Highlights of the Report |
2.2 Report Description |
2.3 Market Scope & Segmentation |
2.4 Research Methodology |
2.5 Assumptions |
3 India V-belts Market Overview |
3.1 India Country Macro Economic Indicators |
3.2 India V-belts Market Revenues & Volume, 2021 & 2031F |
3.3 India V-belts Market - Industry Life Cycle |
3.4 India V-belts Market - Porter's Five Forces |
3.5 India V-belts Market Revenues & Volume Share, By Material Used, 2021 & 2031F |
3.6 India V-belts Market Revenues & Volume Share, By Types, 2021 & 2031F |
3.7 India V-belts Market Revenues & Volume Share, By End-use Industries, 2021 & 2031F |
4 India V-belts Market Dynamics |
4.1 Impact Analysis |
4.2 Market Drivers |
4.2.1 Growth in industrial activities and manufacturing sectors in India |
4.2.2 Increasing demand for automobiles and agricultural machinery |
4.2.3 Focus on infrastructure development projects in the country |
4.3 Market Restraints |
4.3.1 Competition from alternative technologies such as timing belts and chain drives |
4.3.2 Fluctuating raw material prices impacting production costs |
4.3.3 Potential impact of economic slowdown on overall demand for v-belts |
5 India V-belts Market Trends |
6 India V-belts Market, By Types |
6.1 India V-belts Market, By Material Used |
6.1.1 Overview and Analysis |
6.1.2 India V-belts Market Revenues & Volume, By Material Used, 2021-2031F |
6.1.3 India V-belts Market Revenues & Volume, By Rubber, 2021-2031F |
6.1.4 India V-belts Market Revenues & Volume, By Polymer, 2021-2031F |
6.1.5 India V-belts Market Revenues & Volume, By Neoprene, 2021-2031F |
6.1.6 India V-belts Market Revenues & Volume, By Urethane Synthetic Materials, 2021-2031F |
6.2 India V-belts Market, By Types |
6.2.1 Overview and Analysis |
6.2.2 India V-belts Market Revenues & Volume, By Heavy Duty, 2021-2031F |
6.3 India V-belts Market, By End-use Industries |
6.3.1 Overview and Analysis |
6.3.2 India V-belts Market Revenues & Volume, By Paper And Pulp, 2021-2031F |
6.3.3 India V-belts Market Revenues & Volume, By Cement, 2021-2031F |
6.3.4 India V-belts Market Revenues & Volume, By Power And Energy, 2021-2031F |
6.3.5 India V-belts Market Revenues & Volume, By Food And Beverage, 2021-2031F |
6.3.6 India V-belts Market Revenues & Volume, By Agricultural, 2021-2031F |
6.3.7 India V-belts Market Revenues & Volume, By Automotive, 2021-2031F |
7 India V-belts Market Import-Export Trade Statistics |
7.1 India V-belts Market Export to Major Countries |
7.2 India V-belts Market Imports from Major Countries |
8 India V-belts Market Key Performance Indicators |
8.1 Average selling price of v-belts in the market |
8.2 Number of new product innovations and technological advancements in v-belts |
8.3 Adoption rate of v-belts in emerging industries like renewable energy and electric vehicles |
8.4 Number of partnerships and collaborations within the v-belts industry |
8.5 Market penetration rate of v-belts in rural areas and Tier 2/Tier 3 cities in India |
9 India V-belts Market - Opportunity Assessment |
9.1 India V-belts Market Opportunity Assessment, By Material Used, 2021 & 2031F |
9.2 India V-belts Market Opportunity Assessment, By Types, 2021 & 2031F |
9.3 India V-belts Market Opportunity Assessment, By End-use Industries, 2021 & 2031F |
10 India V-belts Market - Competitive Landscape |
10.1 India V-belts Market Revenue Share, By Companies, 2024 |
10.2 India V-belts Market Competitive Benchmarking, By Operating and Technical Parameters |
11 Company Profiles |
12 Recommendations |
13 Disclaimer |
Global Go To Market Strategy - 2030
Export potential enables firms to identify high-growth global markets with greater confidence by combining advanced trade intelligence with a structured quantitative methodology. The framework analyzes emerging demand trends and country-level import patterns while integrating macroeconomic and trade datasets such as GDP and population forecasts, bilateral import–export flows, tariff structures, elasticity differentials between developed and developing economies, geographic distance, and import demand projections. Using weighted trade values from 2020–2024 as the base period to project country-to-country export potential for 2030, these inputs are operationalized through calculated drivers such as gravity model parameters, tariff impact factors, and projected GDP per-capita growth. Through an analysis of hidden potentials, demand hotspots, and market conditions that are most favorable to success, this method enables firms to focus on target countries, maximize returns, and global expansion with data, backed by accuracy.
By factoring in the projected importer demand gap that is currently unmet and could be potential opportunity, it identifies the potential for the Exporter (Country) among 190 countries, against the general trade analysis, which identifies the biggest importer or exporter.
To discover high-growth global markets and optimize your business strategy:
Click Here
Pricing
- Single User License$ 1,995
- Department License$ 2,400
- Site License$ 3,120
- Global License$ 3,795

Leadership Perspectives from Industry Events
Search
Thought Leadership and Analyst Meet


Our Clients
6WResearch In News
- India Air Conditioner Market Set for Strong Rebound in 2026 After Weather-Led Correction and GST-Driven Recovery: 6Wresearch
- ADAS in India: How Automatic Emergency Braking, Blind Spot Detection & Driver Monitoring are Transforming Road Safety
- Doha a strategic location for EV manufacturing hub: IPA Qatar
- Demand for luxury TVs surging in the GCC, says Samsung
- Empowering Growth: The Thriving Journey of Bangladesh’s Cable Industry
- Demand for luxury TVs surging in the GCC, says Samsung
Latest Reports
- Poland Fire Protection Systems Market (2026-2032)
- Cape Verde Portable Hand-Thrown Extinguisher Market (2026-2032)
- Canada Portable Hand-Thrown Extinguisher Market (2026-2032)
- Cameroon Portable Hand-Thrown Extinguisher Market (2026-2032)
- Burundi Portable Hand-Thrown Extinguisher Market (2026-2032)
- Burkina Faso Portable Hand-Thrown Extinguisher Market (2026-2032)
- Bulgaria Portable Hand-Thrown Extinguisher Market (2026-2032)
- Brunei Portable Hand-Thrown Extinguisher Market (2026-2032)
- Botswana Portable Hand-Thrown Extinguisher Market (2026-2032)
- Bosnia and Herzegovina Portable Hand-Thrown Extinguisher Market (2026-2032)
Industry Events and Analyst Meet

HIMTEX 2026

India Refining Summit 2026

India EV Show 2026

EV tech India Expo 2026

Auto Tech Asia 2026
Whitepaper
- Middle East & Africa Commercial Security Market Click here to view more.
- Middle East & Africa Fire Safety Systems & Equipment Market Click here to view more.
- GCC Drone Market Click here to view more.
- Middle East Lighting Fixture Market Click here to view more.
- GCC Physical & Perimeter Security Market Click here to view more.