Indonesia Alcohol Ingredients Market (2026-2032) Outlook | Forecast, Industry, Analysis, Revenue, Value, Size, Trends, Share, Companies, Growth
Market Forecast By Ingredient Type (Yeast, Enzymes, Colorants, flavors & salts, Others), By Beverage Type (Beer, Spirits, Wine, Whisky, Brandy, Others) And Competitive Landscape
| Product Code: ETC4541129 | Publication Date: Jul 2023 | Updated Date: Mar 2026 | Product Type: Report | |
| Publisher: 6Wresearch | Author: Ravi Bhandari | No. of Pages: 85 | No. of Figures: 45 | No. of Tables: 25 |
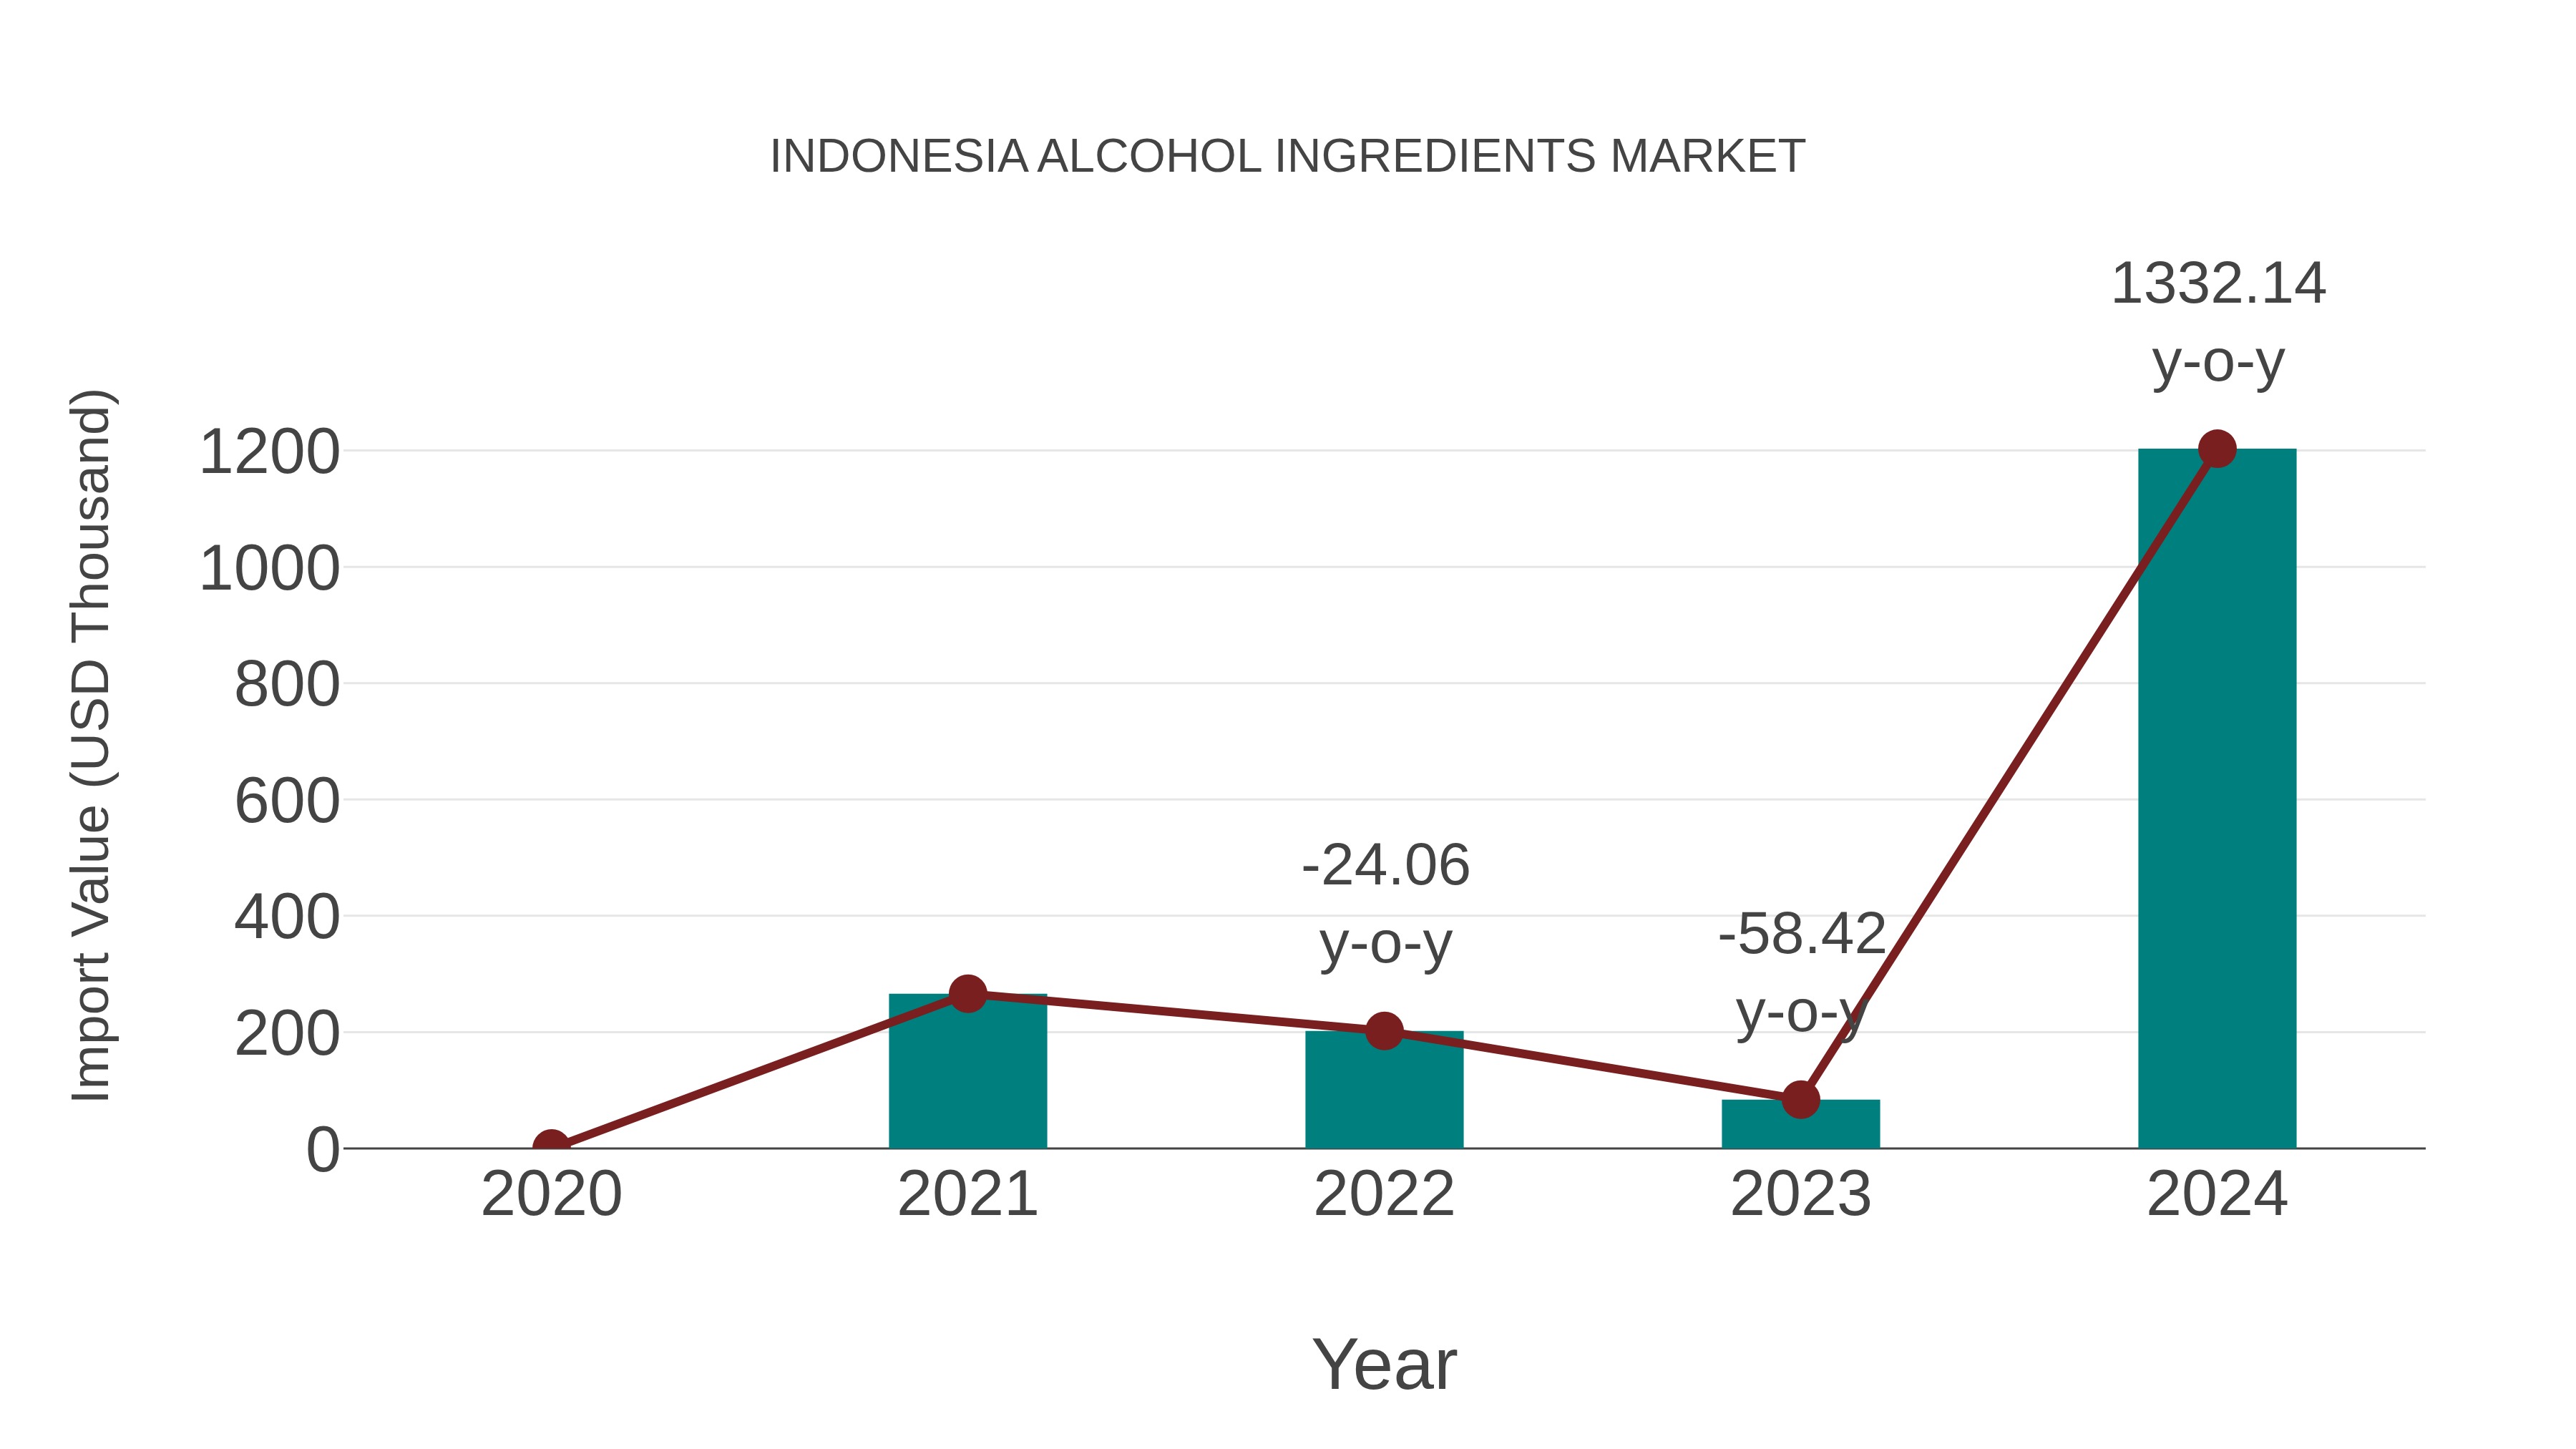
Indonesia Alcohol Ingredients Market: Import Trend Analysis
Indonesia`s alcohol ingredients market experienced a substantial import trend from 2023 to 2024, with a growth rate of 1332.14%. The compound annual growth rate (CAGR) for the period 2020-2024 stood at 65.37%. This surge in imports can be attributed to a notable shift in demand for alcohol products, indicating a significant market momentum and evolving consumer preferences in the industry.
Indonesia Alcohol Ingredients Market Overview
The alcohol ingredients market in Indonesia is primarily driven by the country`s burgeoning alcoholic beverage industry. With a growing young population and an increasing preference for premium and craft beverages, the demand for high-quality alcohol ingredients is on the rise. Ingredients such as yeasts, enzymes, and flavoring agents play a pivotal role in crafting unique and flavorful alcoholic beverages.
Drivers of the Market
The alcohol ingredients market is thriving due to the growing interest in alcoholic beverages, including beer and spirits. Craft breweries and distilleries are on the rise, creating a demand for various ingredients to create unique and high-quality alcoholic products.
Challenges of the Market
The Indonesia alcohol ingredients market is confronted with regulatory challenges, including licensing and labeling requirements. Additionally, ensuring the consistent supply of raw materials, such as grains for brewing, can be challenging due to factors like climate change and agricultural fluctuations.
COVID-19 Impacts on the Market
The COVID-19 pandemic had a complex impact on the alcohol ingredients market in Indonesia. On one hand, there was a shift in consumer preferences toward alcoholic beverages consumed at home, leading to increased demand for ingredients used in homemade cocktails and brewing. On the other hand, the pandemic disrupted the distribution of alcoholic beverages and, consequently, the demand for related ingredients. The market had to adapt to changing consumer behavior and address supply chain challenges.
Key Players of the Makret
The alcohol ingredients market in Indonesia is supported by companies like Archer Daniels Midland (ADM), a global player known for providing various ingredients to the food and beverage industry, including those used in the production of alcoholic beverages.
Key Highlights of the Report:
- Indonesia Alcohol Ingredients Market Outlook
- Market Size of Indonesia Alcohol Ingredients Market, 2025
- Forecast of Indonesia Alcohol Ingredients Market, 2032
- Historical Data and Forecast of Indonesia Alcohol Ingredients Revenues & Volume for the Period 2022-2032F
- Indonesia Alcohol Ingredients Market Trend Evolution
- Indonesia Alcohol Ingredients Market Drivers and Challenges
- Indonesia Alcohol Ingredients Price Trends
- Indonesia Alcohol Ingredients Porter's Five Forces
- Indonesia Alcohol Ingredients Industry Life Cycle
- Historical Data and Forecast of Indonesia Alcohol Ingredients Market Revenues & Volume By Ingredient Type for the Period 2022-2032F
- Historical Data and Forecast of Indonesia Alcohol Ingredients Market Revenues & Volume By Yeast for the Period 2022-2032F
- Historical Data and Forecast of Indonesia Alcohol Ingredients Market Revenues & Volume By Enzymes for the Period 2022-2032F
- Historical Data and Forecast of Indonesia Alcohol Ingredients Market Revenues & Volume By Colorants for the Period 2022-2032F
- Historical Data and Forecast of Indonesia Alcohol Ingredients Market Revenues & Volume By flavors & salts for the Period 2022-2032F
- Historical Data and Forecast of Indonesia Alcohol Ingredients Market Revenues & Volume By Others for the Period 2022-2032F
- Historical Data and Forecast of Indonesia Alcohol Ingredients Market Revenues & Volume By Beverage Type for the Period 2022-2032F
- Historical Data and Forecast of Indonesia Alcohol Ingredients Market Revenues & Volume By Beer for the Period 2022-2032F
- Historical Data and Forecast of Indonesia Alcohol Ingredients Market Revenues & Volume By Spirits for the Period 2022-2032F
- Historical Data and Forecast of Indonesia Alcohol Ingredients Market Revenues & Volume By Wine for the Period 2022-2032F
- Historical Data and Forecast of Indonesia Alcohol Ingredients Market Revenues & Volume By Whisky for the Period 2022-2032F
- Historical Data and Forecast of Indonesia Alcohol Ingredients Market Revenues & Volume By Brandy for the Period 2022-2032F
- Historical Data and Forecast of Indonesia Alcohol Ingredients Market Revenues & Volume By Others for the Period 2022-2032F
- Indonesia Alcohol Ingredients Import Export Trade Statistics
- Market Opportunity Assessment By Ingredient Type
- Market Opportunity Assessment By Beverage Type
- Indonesia Alcohol Ingredients Top Companies Market Share
- Indonesia Alcohol Ingredients Competitive Benchmarking By Technical and Operational Parameters
- Indonesia Alcohol Ingredients Company Profiles
- Indonesia Alcohol Ingredients Key Strategic Recommendations
Indonesia Alcohol Ingredients Market (2026-2032): FAQs
6Wresearch actively monitors the Indonesia Alcohol Ingredients Market and publishes its comprehensive annual report, highlighting emerging trends, growth drivers, revenue analysis, and forecast outlook. Our insights help businesses to make data-backed strategic decisions with ongoing market dynamics. Our analysts track relevent industries related to the Indonesia Alcohol Ingredients Market, allowing our clients with actionable intelligence and reliable forecasts tailored to emerging regional needs.
Yes, we provide customisation as per your requirements. To learn more, feel free to contact us on sales@6wresearch.com
1 Executive Summary |
2 Introduction |
2.1 Key Highlights of the Report |
2.2 Report Description |
2.3 Market Scope & Segmentation |
2.4 Research Methodology |
2.5 Assumptions |
3 Indonesia Alcohol Ingredients Market Overview |
3.1 Indonesia Country Macro Economic Indicators |
3.2 Indonesia Alcohol Ingredients Market Revenues & Volume, 2022 & 2032F |
3.3 Indonesia Alcohol Ingredients Market - Industry Life Cycle |
3.4 Indonesia Alcohol Ingredients Market - Porter's Five Forces |
3.5 Indonesia Alcohol Ingredients Market Revenues & Volume Share, By Ingredient Type, 2022 & 2032F |
3.6 Indonesia Alcohol Ingredients Market Revenues & Volume Share, By Beverage Type, 2022 & 2032F |
4 Indonesia Alcohol Ingredients Market Dynamics |
4.1 Impact Analysis |
4.2 Market Drivers |
4.2.1 Increasing disposable income in Indonesia leading to higher spending on alcohol products |
4.2.2 Growing popularity of craft and artisanal alcoholic beverages driving demand for premium ingredients |
4.2.3 Rising tourism industry in Indonesia boosting the consumption of alcohol products |
4.3 Market Restraints |
4.3.1 Stringent government regulations and taxes on alcohol production and sales |
4.3.2 Cultural and religious norms in Indonesia restricting the consumption of alcohol in certain regions |
5 Indonesia Alcohol Ingredients Market Trends |
6 Indonesia Alcohol Ingredients Market, By Types |
6.1 Indonesia Alcohol Ingredients Market, By Ingredient Type |
6.1.1 Overview and Analysis |
6.1.2 Indonesia Alcohol Ingredients Market Revenues & Volume, By Ingredient Type, 2022-2032F |
6.1.3 Indonesia Alcohol Ingredients Market Revenues & Volume, By Yeast, 2022-2032F |
6.1.4 Indonesia Alcohol Ingredients Market Revenues & Volume, By Enzymes, 2022-2032F |
6.1.5 Indonesia Alcohol Ingredients Market Revenues & Volume, By Colorants, 2022-2032F |
6.1.6 Indonesia Alcohol Ingredients Market Revenues & Volume, By flavors & salts, 2022-2032F |
6.1.7 Indonesia Alcohol Ingredients Market Revenues & Volume, By Others, 2022-2032F |
6.2 Indonesia Alcohol Ingredients Market, By Beverage Type |
6.2.1 Overview and Analysis |
6.2.2 Indonesia Alcohol Ingredients Market Revenues & Volume, By Beer, 2022-2032F |
6.2.3 Indonesia Alcohol Ingredients Market Revenues & Volume, By Spirits, 2022-2032F |
6.2.4 Indonesia Alcohol Ingredients Market Revenues & Volume, By Wine, 2022-2032F |
6.2.5 Indonesia Alcohol Ingredients Market Revenues & Volume, By Whisky, 2022-2032F |
6.2.6 Indonesia Alcohol Ingredients Market Revenues & Volume, By Brandy, 2022-2032F |
6.2.7 Indonesia Alcohol Ingredients Market Revenues & Volume, By Others, 2022-2032F |
7 Indonesia Alcohol Ingredients Market Import-Export Trade Statistics |
7.1 Indonesia Alcohol Ingredients Market Export to Major Countries |
7.2 Indonesia Alcohol Ingredients Market Imports from Major Countries |
8 Indonesia Alcohol Ingredients Market Key Performance Indicators |
8.1 Number of craft and artisanal breweries using premium alcohol ingredients in Indonesia |
8.2 Growth rate of the tourism industry in Indonesia |
8.3 Regulatory changes impacting the alcohol ingredients market |
9 Indonesia Alcohol Ingredients Market - Opportunity Assessment |
9.1 Indonesia Alcohol Ingredients Market Opportunity Assessment, By Ingredient Type, 2022 & 2032F |
9.2 Indonesia Alcohol Ingredients Market Opportunity Assessment, By Beverage Type, 2022 & 2032F |
10 Indonesia Alcohol Ingredients Market - Competitive Landscape |
10.1 Indonesia Alcohol Ingredients Market Revenue Share, By Companies, 2025 |
10.2 Indonesia Alcohol Ingredients Market Competitive Benchmarking, By Operating and Technical Parameters |
11 Company Profiles |
12 Recommendations |
13 Disclaimer |
Global Go To Market Strategy - 2030
Export potential enables firms to identify high-growth global markets with greater confidence by combining advanced trade intelligence with a structured quantitative methodology. The framework analyzes emerging demand trends and country-level import patterns while integrating macroeconomic and trade datasets such as GDP and population forecasts, bilateral import–export flows, tariff structures, elasticity differentials between developed and developing economies, geographic distance, and import demand projections. Using weighted trade values from 2020–2024 as the base period to project country-to-country export potential for 2030, these inputs are operationalized through calculated drivers such as gravity model parameters, tariff impact factors, and projected GDP per-capita growth. Through an analysis of hidden potentials, demand hotspots, and market conditions that are most favorable to success, this method enables firms to focus on target countries, maximize returns, and global expansion with data, backed by accuracy.
By factoring in the projected importer demand gap that is currently unmet and could be potential opportunity, it identifies the potential for the Exporter (Country) among 190 countries, against the general trade analysis, which identifies the biggest importer or exporter.
To discover high-growth global markets and optimize your business strategy:
Click Here
Pricing
- Single User License$ 1,995
- Department License$ 2,400
- Site License$ 3,120
- Global License$ 3,795

Leadership Perspectives from Industry Events
Search
Thought Leadership and Analyst Meet


Our Clients
6WResearch In News
- Doha a strategic location for EV manufacturing hub: IPA Qatar
- Demand for luxury TVs surging in the GCC, says Samsung
- Empowering Growth: The Thriving Journey of Bangladesh’s Cable Industry
- Demand for luxury TVs surging in the GCC, says Samsung
- Video call with a traditional healer? Once unthinkable, it’s now common in South Africa
- Intelligent Buildings To Smooth GCC’s Path To Net Zero
Latest Reports
- New Zealand Aseptic Manufacturing Market (2026-2032)
- Netherlands Aseptic Manufacturing Market (2026-2032)
- Nauru Aseptic Manufacturing Market (2026-2032)
- Namibia Aseptic Manufacturing Market (2026-2032)
- Mozambique Aseptic Manufacturing Market (2026-2032)
- Montenegro Aseptic Manufacturing Market (2026-2032)
- Mongolia Aseptic Manufacturing Market (2026-2032)
- Monaco Aseptic Manufacturing Market (2026-2032)
- Micronesia Aseptic Manufacturing Market (2026-2032)
- Mauritius Aseptic Manufacturing Market (2026-2032)
Industry Events and Analyst Meet

HIMTEX 2026

India Refining Summit 2026

India EV Show 2026

EV tech India Expo 2026

Auto Tech Asia 2026
Whitepaper
- Middle East & Africa Commercial Security Market Click here to view more.
- Middle East & Africa Fire Safety Systems & Equipment Market Click here to view more.
- GCC Drone Market Click here to view more.
- Middle East Lighting Fixture Market Click here to view more.
- GCC Physical & Perimeter Security Market Click here to view more.