Indonesia Aromatic Solvent Market (2026-2032) | Supply, Consumer Insights, Forecast, Challenges, Growth, Revenue, Segments, Value, Share, Restraints, Industry, Trends, Opportunities, Segmentation, Companies, Analysis, Competition, Pricing Analysis, Strategy, Size, Drivers, Competitive, Investment Trends, Outlook, Strategic Insights, Demand
Market Forecast By Type (Benzene-Based, Toluene-Based, Xylene-Based), By Application (Paints & Coatings, Pharmaceuticals, Adhesives & Sealants), By End Use Industry (Automotive, Healthcare, Construction) And Competitive Landscape
| Product Code: ETC11408719 | Publication Date: Apr 2025 | Updated Date: Mar 2026 | Product Type: Market Research Report | |
| Publisher: 6Wresearch | Author: Bhawna Singh | No. of Pages: 65 | No. of Figures: 34 | No. of Tables: 19 |
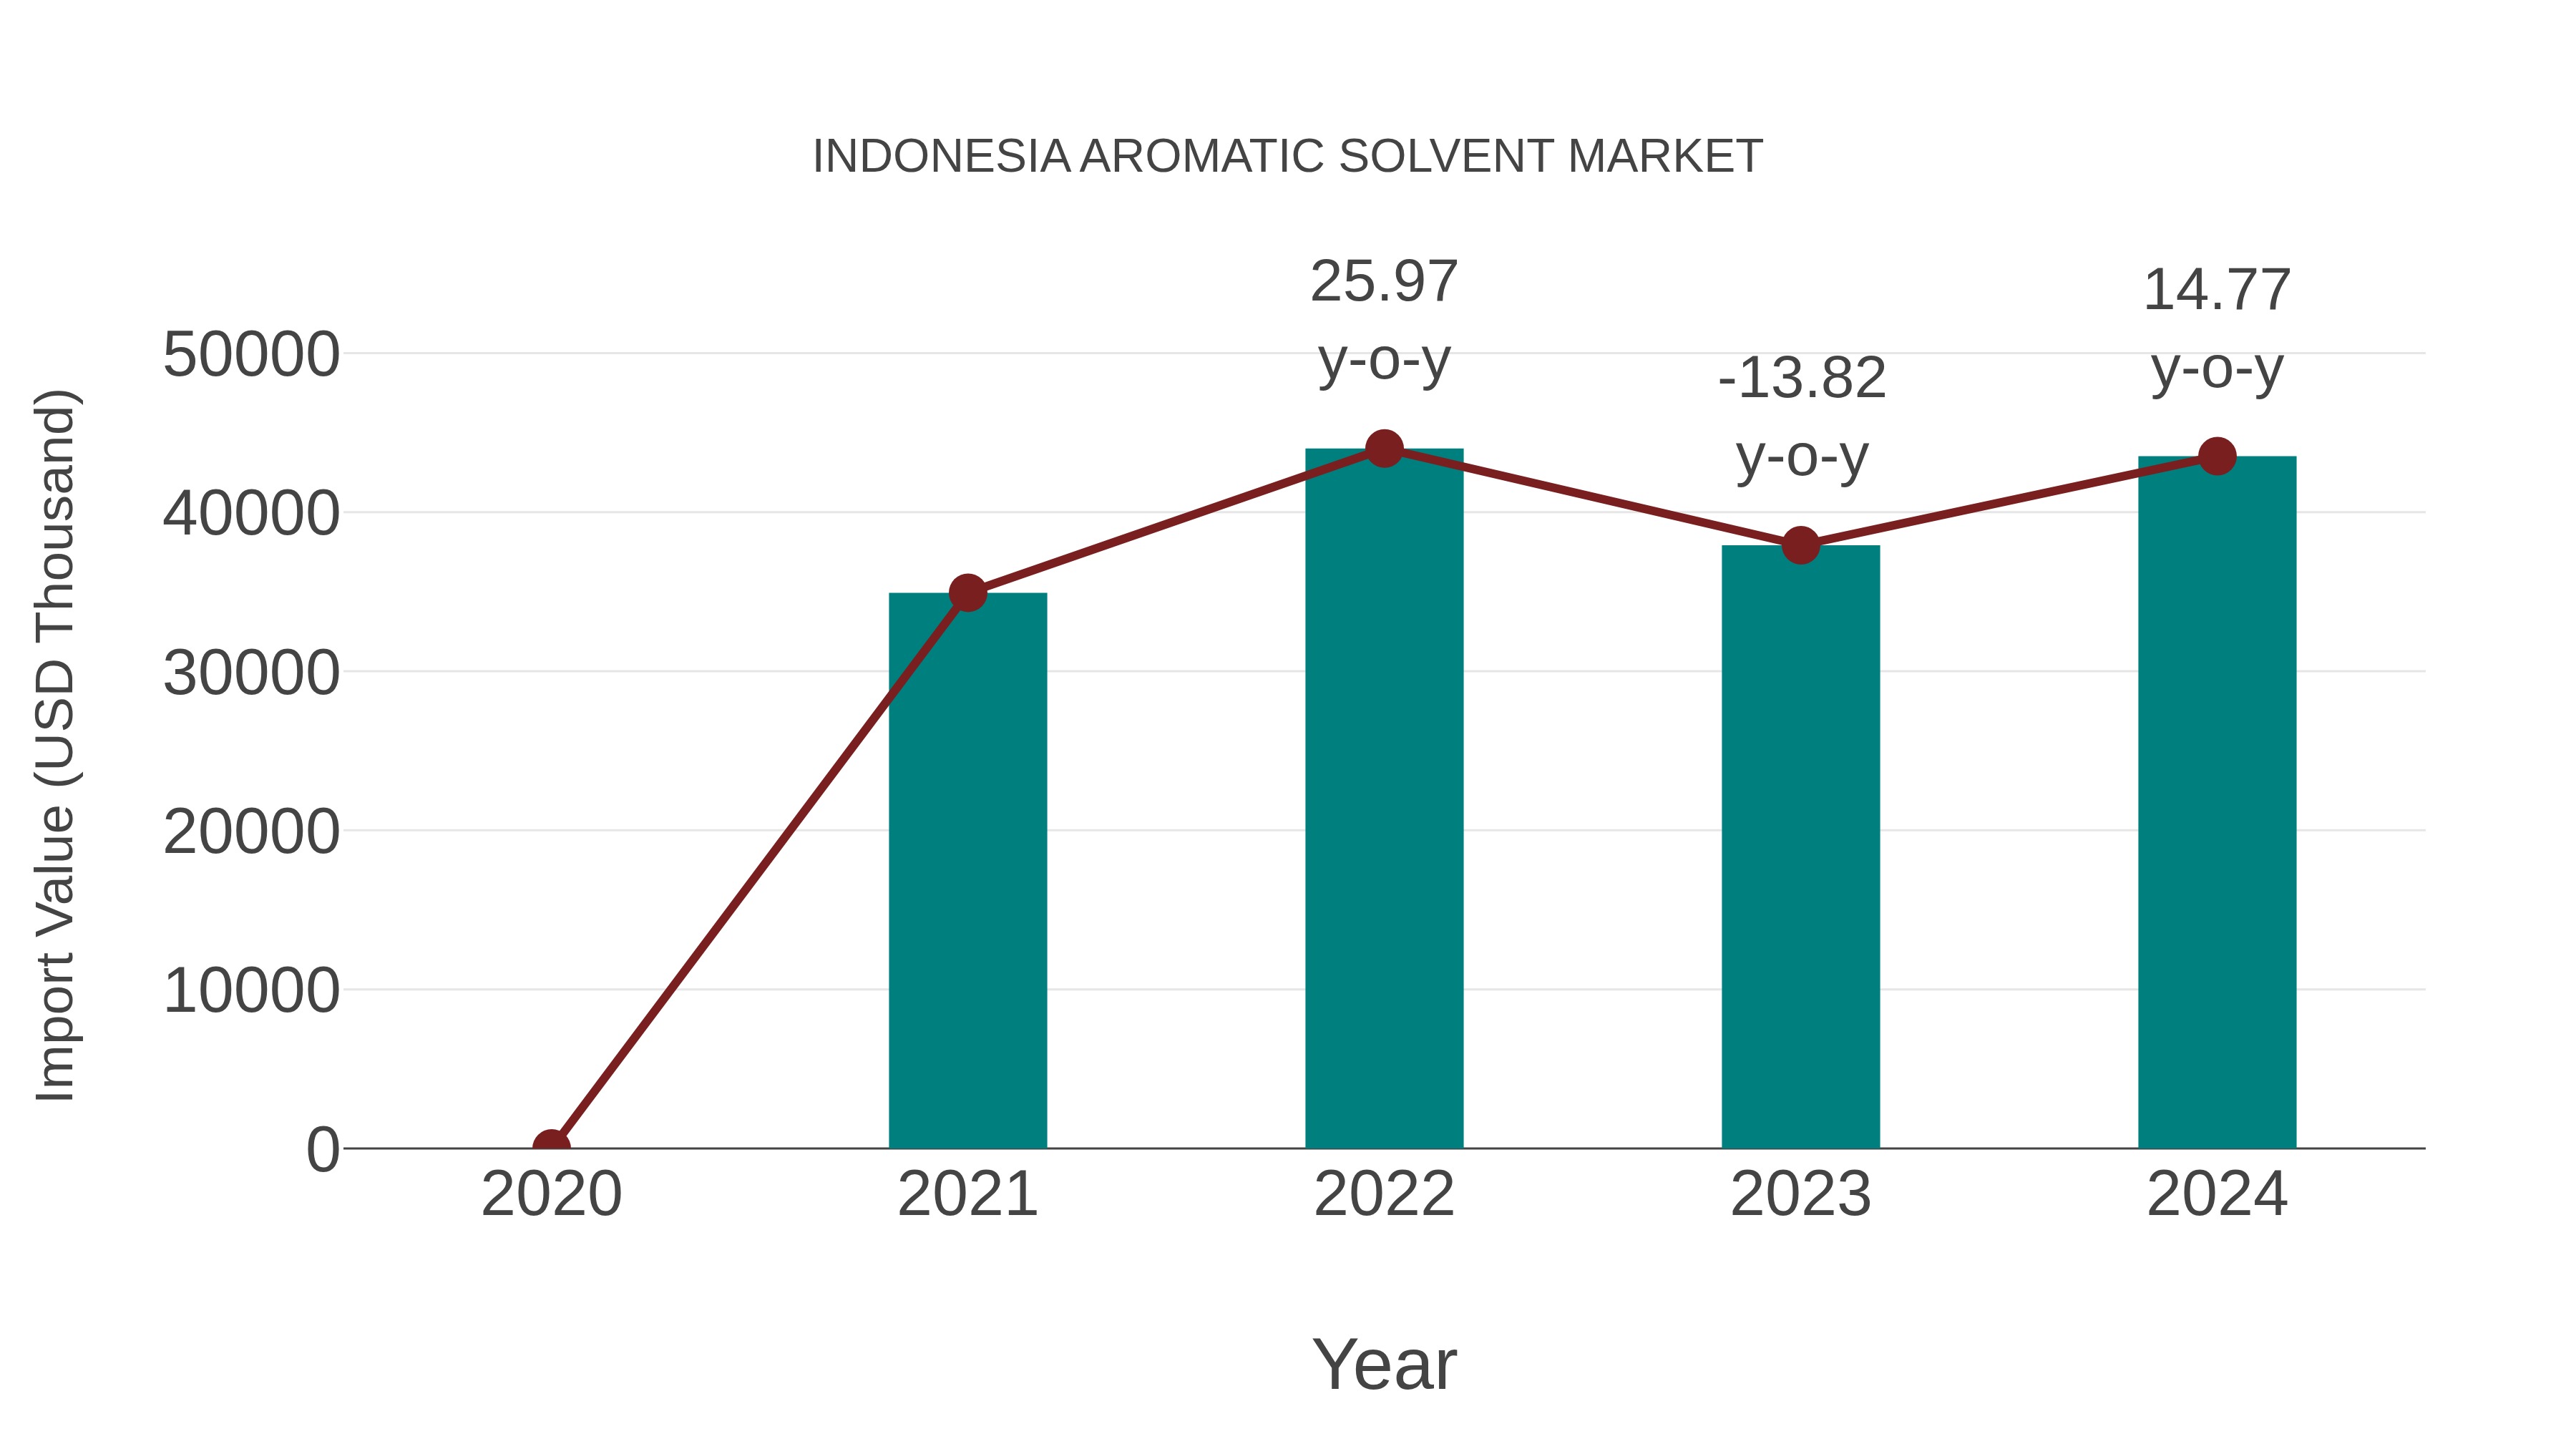
Indonesia Aromatic Solvent Market: Import Trend Analysis
In 2024, Indonesia`s import trend for aromatic solvents experienced a growth rate of 14.77%, with a compound annual growth rate (CAGR) of 7.6% from 2020 to 2024. This notable import momentum can be attributed to the increasing demand for aromatic solvents in various industries, indicating a positive market stability and sustained demand shift towards these products in the Indonesian market.
Indonesia Aromatic Solvent Market Overview
The Indonesia aromatic solvent market is experiencing steady growth driven by various industries such as paints and coatings, adhesives, and pharmaceuticals. Aromatic solvents, such as toluene and xylene, are widely used as diluents and solvents due to their excellent solvency properties. The increasing construction activities and infrastructure development projects in Indonesia are boosting the demand for aromatic solvents in the paints and coatings industry. Moreover, the growing automotive sector in the country is further fueling the demand for aromatic solvents for the production of coatings and adhesives. However, stringent regulations regarding emissions and environmental concerns are expected to challenge market growth. Overall, the Indonesia aromatic solvent market is poised for expansion with opportunities for innovation and sustainable practices to meet the evolving industry requirements.
Indonesia Aromatic Solvent Market Trends
The Indonesia aromatic solvent market is experiencing several key trends. One major trend is the increasing demand for eco-friendly and sustainable aromatic solvents due to growing environmental awareness and regulations. As a result, there is a shift towards bio-based and renewable aromatic solvents in the market. Another trend is the rising use of aromatic solvents in various end-use industries such as paints and coatings, adhesives, and pharmaceuticals, driving market growth. Additionally, the market is witnessing a surge in investments in research and development activities to develop innovative aromatic solvent products with enhanced performance characteristics. Overall, the Indonesia aromatic solvent market is evolving towards more sustainable practices and innovative solutions to meet the changing needs of industries and consumers.
Indonesia Aromatic Solvent Market Challenges
In the Indonesia aromatic solvent market, several challenges are faced, including fluctuating raw material prices, increasing environmental regulations, and competition from alternative solvents. The volatility of raw material prices, particularly crude oil, can impact the production costs of aromatic solvents, leading to pricing challenges for manufacturers. Additionally, as environmental concerns continue to rise, stricter regulations on emissions and waste disposal can impact the operations of companies within the industry, requiring them to invest in sustainable practices and technologies. Moreover, the growing popularity of bio-based and eco-friendly solvents poses a competitive threat to traditional aromatic solvents, prompting companies to innovate and adapt to changing market preferences. Overall, navigating these challenges requires strategic planning, innovation, and a commitment to sustainability in the Indonesia aromatic solvent market.
Indonesia Aromatic Solvent Market Investment Opportunities
The Indonesia aromatic solvent market presents promising investment opportunities due to the growing demand for these solvents in various industries such as paints and coatings, adhesives, and pharmaceuticals. With the country`s expanding industrial sector and increasing construction activities, the demand for aromatic solvents is expected to rise steadily. Additionally, the government`s initiatives to attract foreign investment and improve infrastructure are likely to further boost market growth. Investors can consider opportunities in manufacturing and supplying aromatic solvents, as well as exploring partnerships with local businesses to capitalize on the market potential. Conducting thorough market research, understanding regulatory frameworks, and establishing strong distribution networks will be key to successfully tapping into the Indonesia aromatic solvent market.
Indonesia Aromatic Solvent Market Government Policy
The Indonesian government has implemented various policies related to the aromatic solvent market to ensure environmental sustainability and regulatory compliance. These policies include regulations on the production, import, and distribution of aromatic solvents to minimize environmental impact and protect public health. Additionally, the government has imposed quality control standards to maintain product safety and promote industry best practices. Furthermore, there are guidelines in place to monitor and manage waste disposal practices within the aromatic solvent industry to prevent pollution and ensure sustainable development. Overall, these government policies aim to promote responsible and sustainable growth within the aromatic solvent market in Indonesia while prioritizing environmental protection and regulatory compliance.
Indonesia Aromatic Solvent Market Future Outlook
The Indonesia aromatic solvent market is expected to witness steady growth in the coming years, driven by the increasing demand from various end-use industries such as paints and coatings, adhesives, and printing inks. The growth of these industries, coupled with the rising investments in infrastructure development and construction projects in the country, is likely to fuel the demand for aromatic solvents. Additionally, the shift towards environmentally friendly and sustainable solvents is anticipated to create new opportunities for market players in Indonesia. However, challenges such as volatility in raw material prices and regulatory constraints related to environmental concerns may hinder the market growth to some extent. Overall, the Indonesia aromatic solvent market is poised for moderate growth in the foreseeable future.
Key Highlights of the Report:
- Indonesia Aromatic Solvent Market Outlook
- Market Size of Indonesia Aromatic Solvent Market, 2025
- Forecast of Indonesia Aromatic Solvent Market, 2032
- Historical Data and Forecast of Indonesia Aromatic Solvent Revenues & Volume for the Period 2022-2032F
- Indonesia Aromatic Solvent Market Trend Evolution
- Indonesia Aromatic Solvent Market Drivers and Challenges
- Indonesia Aromatic Solvent Price Trends
- Indonesia Aromatic Solvent Porter's Five Forces
- Indonesia Aromatic Solvent Industry Life Cycle
- Historical Data and Forecast of Indonesia Aromatic Solvent Market Revenues & Volume By Type for the Period 2022-2032F
- Historical Data and Forecast of Indonesia Aromatic Solvent Market Revenues & Volume By Benzene-Based for the Period 2022-2032F
- Historical Data and Forecast of Indonesia Aromatic Solvent Market Revenues & Volume By Toluene-Based for the Period 2022-2032F
- Historical Data and Forecast of Indonesia Aromatic Solvent Market Revenues & Volume By Xylene-Based for the Period 2022-2032F
- Historical Data and Forecast of Indonesia Aromatic Solvent Market Revenues & Volume By Application for the Period 2022-2032F
- Historical Data and Forecast of Indonesia Aromatic Solvent Market Revenues & Volume By Paints & Coatings for the Period 2022-2032F
- Historical Data and Forecast of Indonesia Aromatic Solvent Market Revenues & Volume By Pharmaceuticals for the Period 2022-2032F
- Historical Data and Forecast of Indonesia Aromatic Solvent Market Revenues & Volume By Adhesives & Sealants for the Period 2022-2032F
- Historical Data and Forecast of Indonesia Aromatic Solvent Market Revenues & Volume By End Use Industry for the Period 2022-2032F
- Historical Data and Forecast of Indonesia Aromatic Solvent Market Revenues & Volume By Automotive for the Period 2022-2032F
- Historical Data and Forecast of Indonesia Aromatic Solvent Market Revenues & Volume By Healthcare for the Period 2022-2032F
- Historical Data and Forecast of Indonesia Aromatic Solvent Market Revenues & Volume By Construction for the Period 2022-2032F
- Indonesia Aromatic Solvent Import Export Trade Statistics
- Market Opportunity Assessment By Type
- Market Opportunity Assessment By Application
- Market Opportunity Assessment By End Use Industry
- Indonesia Aromatic Solvent Top Companies Market Share
- Indonesia Aromatic Solvent Competitive Benchmarking By Technical and Operational Parameters
- Indonesia Aromatic Solvent Company Profiles
- Indonesia Aromatic Solvent Key Strategic Recommendations
Indonesia Aromatic Solvent Market (2026-2032): FAQs
6Wresearch actively monitors the Indonesia Aromatic Solvent Market and publishes its comprehensive annual report, highlighting emerging trends, growth drivers, revenue analysis, and forecast outlook. Our insights help businesses to make data-backed strategic decisions with ongoing market dynamics. Our analysts track relevent industries related to the Indonesia Aromatic Solvent Market, allowing our clients with actionable intelligence and reliable forecasts tailored to emerging regional needs.
Yes, we provide customisation as per your requirements. To learn more, feel free to contact us on sales@6wresearch.com
1 Executive Summary |
2 Introduction |
2.1 Key Highlights of the Report |
2.2 Report Description |
2.3 Market Scope & Segmentation |
2.4 Research Methodology |
2.5 Assumptions |
3 Indonesia Aromatic Solvent Market Overview |
3.1 Indonesia Country Macro Economic Indicators |
3.2 Indonesia Aromatic Solvent Market Revenues & Volume, 2022 & 2032F |
3.3 Indonesia Aromatic Solvent Market - Industry Life Cycle |
3.4 Indonesia Aromatic Solvent Market - Porter's Five Forces |
3.5 Indonesia Aromatic Solvent Market Revenues & Volume Share, By Type, 2022 & 2032F |
3.6 Indonesia Aromatic Solvent Market Revenues & Volume Share, By Application, 2022 & 2032F |
3.7 Indonesia Aromatic Solvent Market Revenues & Volume Share, By End Use Industry, 2022 & 2032F |
4 Indonesia Aromatic Solvent Market Dynamics |
4.1 Impact Analysis |
4.2 Market Drivers |
4.2.1 Increasing demand from end-use industries such as paints, coatings, and adhesives. |
4.2.2 Growth in the construction sector, leading to higher consumption of aromatic solvents for various applications. |
4.2.3 Rising awareness about the environmentally friendly nature of bio-based aromatic solvents. |
4.3 Market Restraints |
4.3.1 Volatility in raw material prices impacting production costs and pricing of aromatic solvents. |
4.3.2 Stringent regulations regarding emissions and environmental impact, leading to compliance challenges for manufacturers. |
4.3.3 Competition from substitutes like non-aromatic solvents affecting market penetration. |
5 Indonesia Aromatic Solvent Market Trends |
6 Indonesia Aromatic Solvent Market, By Types |
6.1 Indonesia Aromatic Solvent Market, By Type |
6.1.1 Overview and Analysis |
6.1.2 Indonesia Aromatic Solvent Market Revenues & Volume, By Type, 2022-2032F |
6.1.3 Indonesia Aromatic Solvent Market Revenues & Volume, By Benzene-Based, 2022-2032F |
6.1.4 Indonesia Aromatic Solvent Market Revenues & Volume, By Toluene-Based, 2022-2032F |
6.1.5 Indonesia Aromatic Solvent Market Revenues & Volume, By Xylene-Based, 2022-2032F |
6.2 Indonesia Aromatic Solvent Market, By Application |
6.2.1 Overview and Analysis |
6.2.2 Indonesia Aromatic Solvent Market Revenues & Volume, By Paints & Coatings, 2022-2032F |
6.2.3 Indonesia Aromatic Solvent Market Revenues & Volume, By Pharmaceuticals, 2022-2032F |
6.2.4 Indonesia Aromatic Solvent Market Revenues & Volume, By Adhesives & Sealants, 2022-2032F |
6.3 Indonesia Aromatic Solvent Market, By End Use Industry |
6.3.1 Overview and Analysis |
6.3.2 Indonesia Aromatic Solvent Market Revenues & Volume, By Automotive, 2022-2032F |
6.3.3 Indonesia Aromatic Solvent Market Revenues & Volume, By Healthcare, 2022-2032F |
6.3.4 Indonesia Aromatic Solvent Market Revenues & Volume, By Construction, 2022-2032F |
7 Indonesia Aromatic Solvent Market Import-Export Trade Statistics |
7.1 Indonesia Aromatic Solvent Market Export to Major Countries |
7.2 Indonesia Aromatic Solvent Market Imports from Major Countries |
8 Indonesia Aromatic Solvent Market Key Performance Indicators |
8.1 Adoption rate of bio-based aromatic solvents in the market. |
8.2 Percentage of market share held by key players in the aromatic solvent industry. |
8.3 Number of new product launches and innovations in the aromatic solvent market. |
8.4 Growth rate in demand for aromatic solvents from key end-use industries. |
8.5 Environmental certifications obtained by aromatic solvent manufacturers. |
9 Indonesia Aromatic Solvent Market - Opportunity Assessment |
9.1 Indonesia Aromatic Solvent Market Opportunity Assessment, By Type, 2022 & 2032F |
9.2 Indonesia Aromatic Solvent Market Opportunity Assessment, By Application, 2022 & 2032F |
9.3 Indonesia Aromatic Solvent Market Opportunity Assessment, By End Use Industry, 2022 & 2032F |
10 Indonesia Aromatic Solvent Market - Competitive Landscape |
10.1 Indonesia Aromatic Solvent Market Revenue Share, By Companies, 2025 |
10.2 Indonesia Aromatic Solvent Market Competitive Benchmarking, By Operating and Technical Parameters |
11 Company Profiles |
12 Recommendations |
13 Disclaimer |
Export potential assessment - trade Analytics for 2030
Export potential enables firms to identify high-growth global markets with greater confidence by combining advanced trade intelligence with a structured quantitative methodology. The framework analyzes emerging demand trends and country-level import patterns while integrating macroeconomic and trade datasets such as GDP and population forecasts, bilateral import–export flows, tariff structures, elasticity differentials between developed and developing economies, geographic distance, and import demand projections. Using weighted trade values from 2020–2024 as the base period to project country-to-country export potential for 2030, these inputs are operationalized through calculated drivers such as gravity model parameters, tariff impact factors, and projected GDP per-capita growth. Through an analysis of hidden potentials, demand hotspots, and market conditions that are most favorable to success, this method enables firms to focus on target countries, maximize returns, and global expansion with data, backed by accuracy.
By factoring in the projected importer demand gap that is currently unmet and could be potential opportunity, it identifies the potential for the Exporter (Country) among 190 countries, against the general trade analysis, which identifies the biggest importer or exporter.
To discover high-growth global markets and optimize your business strategy:
Click Here
Pricing
- Single User License$ 1,995
- Department License$ 2,400
- Site License$ 3,120
- Global License$ 3,795

Search
Thought Leadership and Analyst Meet


Our Clients
Latest Reports
- Philippines Polyhydroxybutyrate-co-Hydroxyvalerate Market (2026-2032) | Trends, Insights, Challenges, Restraints, Competition, Size, Value, Forecast, Pricing, Share, Outlook, Revenue, Investment Opportunities, Strategy, Drivers, Demand, Growth, segmentation, Analysis, Companies
- Peru Polyhydroxybutyrate-co-Hydroxyvalerate Market (2026-2032) | Growth, Demand, Challenges, Share, Trends, Analysis, Pricing, Investment Opportunities, Drivers, Value, Forecast, Competition, Size, Companies, Insights, Outlook, Restraints, segmentation, Revenue, Strategy
- Pakistan Polyhydroxybutyrate-co-Hydroxyvalerate Market (2026-2032) | Restraints, segmentation, Pricing, Forecast, Share, Strategy, Competition, Trends, Insights, Drivers, Challenges, Growth, Revenue, Outlook, Value, Investment Opportunities, Companies, Size, Analysis, Demand
- Oman Polyhydroxybutyrate-co-Hydroxyvalerate Market (2026-2032) | Drivers, segmentation, Insights, Competition, Pricing, Outlook, Size, Revenue, Challenges, Forecast, Analysis, Growth, Value, Share, Trends, Investment Opportunities, Strategy, Restraints, Companies, Demand
- Nigeria Polyhydroxybutyrate-co-Hydroxyvalerate Market (2026-2032) | Value, Investment Opportunities, Analysis, Revenue, Restraints, Pricing, Outlook, Competition, Demand, Growth, Forecast, Companies, Trends, Challenges, segmentation, Drivers, Insights, Share, Size, Strategy
- Nepal Polyhydroxybutyrate-co-Hydroxyvalerate Market (2026-2032) | Insights, Analysis, Drivers, Share, Revenue, Demand, segmentation, Investment Opportunities, Competition, Forecast, Growth, Pricing, Companies, Strategy, Trends, Restraints, Challenges, Outlook, Size, Value
- Myanmar Polyhydroxybutyrate-co-Hydroxyvalerate Market (2026-2032) | Outlook, Revenue, Strategy, Restraints, Drivers, segmentation, Share, Forecast, Competition, Insights, Growth, Pricing, Size, Demand, Value, Companies, Trends, Challenges, Investment Opportunities, Analysis
- Morocco Polyhydroxybutyrate-co-Hydroxyvalerate Market (2026-2032) | Outlook, Investment Opportunities, Restraints, Strategy, Forecast, Challenges, Drivers, Growth, Companies, segmentation, Trends, Size, Competition, Revenue, Demand, Insights, Share, Analysis, Value, Pricing
- Mexico Polyhydroxybutyrate-co-Hydroxyvalerate Market (2026-2032) | Size, Drivers, Outlook, Share, Strategy, Growth, Pricing, Challenges, Companies, Demand, Value, Investment Opportunities, Restraints, Trends, Forecast, segmentation, Analysis, Insights, Competition, Revenue
- Malaysia Polyhydroxybutyrate-co-Hydroxyvalerate Market (2026-2032) | Share, segmentation, Size, Companies, Analysis, Insights, Forecast, Value, Revenue, Drivers, Restraints, Challenges, Investment Opportunities, Trends, Competition, Strategy, Demand, Growth, Outlook, Pricing
Industry Events and Analyst Meet

HIMTEX 2026

India Refining Summit 2026

India EV Show 2026

EV tech India Expo 2026

Auto Tech Asia 2026
Whitepaper
- Middle East & Africa Commercial Security Market Click here to view more.
- Middle East & Africa Fire Safety Systems & Equipment Market Click here to view more.
- GCC Drone Market Click here to view more.
- Middle East Lighting Fixture Market Click here to view more.
- GCC Physical & Perimeter Security Market Click here to view more.
6WResearch In News
- Doha a strategic location for EV manufacturing hub: IPA Qatar
- Demand for luxury TVs surging in the GCC, says Samsung
- Empowering Growth: The Thriving Journey of Bangladesh’s Cable Industry
- Demand for luxury TVs surging in the GCC, says Samsung
- Video call with a traditional healer? Once unthinkable, it’s now common in South Africa
- Intelligent Buildings To Smooth GCC’s Path To Net Zero