Indonesia Bath and Shower Products Market (2024-2030) | Outlook, Analysis, Trends, Companies, Revenue, Industry, Size, Value, Forecast, Growth & Share
Market Forecast By Type (Shower Cream/Gel, Bar Soap, Shower Oil), By User (Adult, Baby), By Distribution Channel (Supermarkets/Hypermarkets, Convenience Stores, Online Retail Stores, Others) And Competitive Landscape
| Product Code: ETC018048 | Publication Date: Jul 2023 | Updated Date: Jan 2026 | Product Type: Report | |
| Publisher: 6Wresearch | Author: Ravi Bhandari | No. of Pages: 70 | No. of Figures: 35 | No. of Tables: 5 |
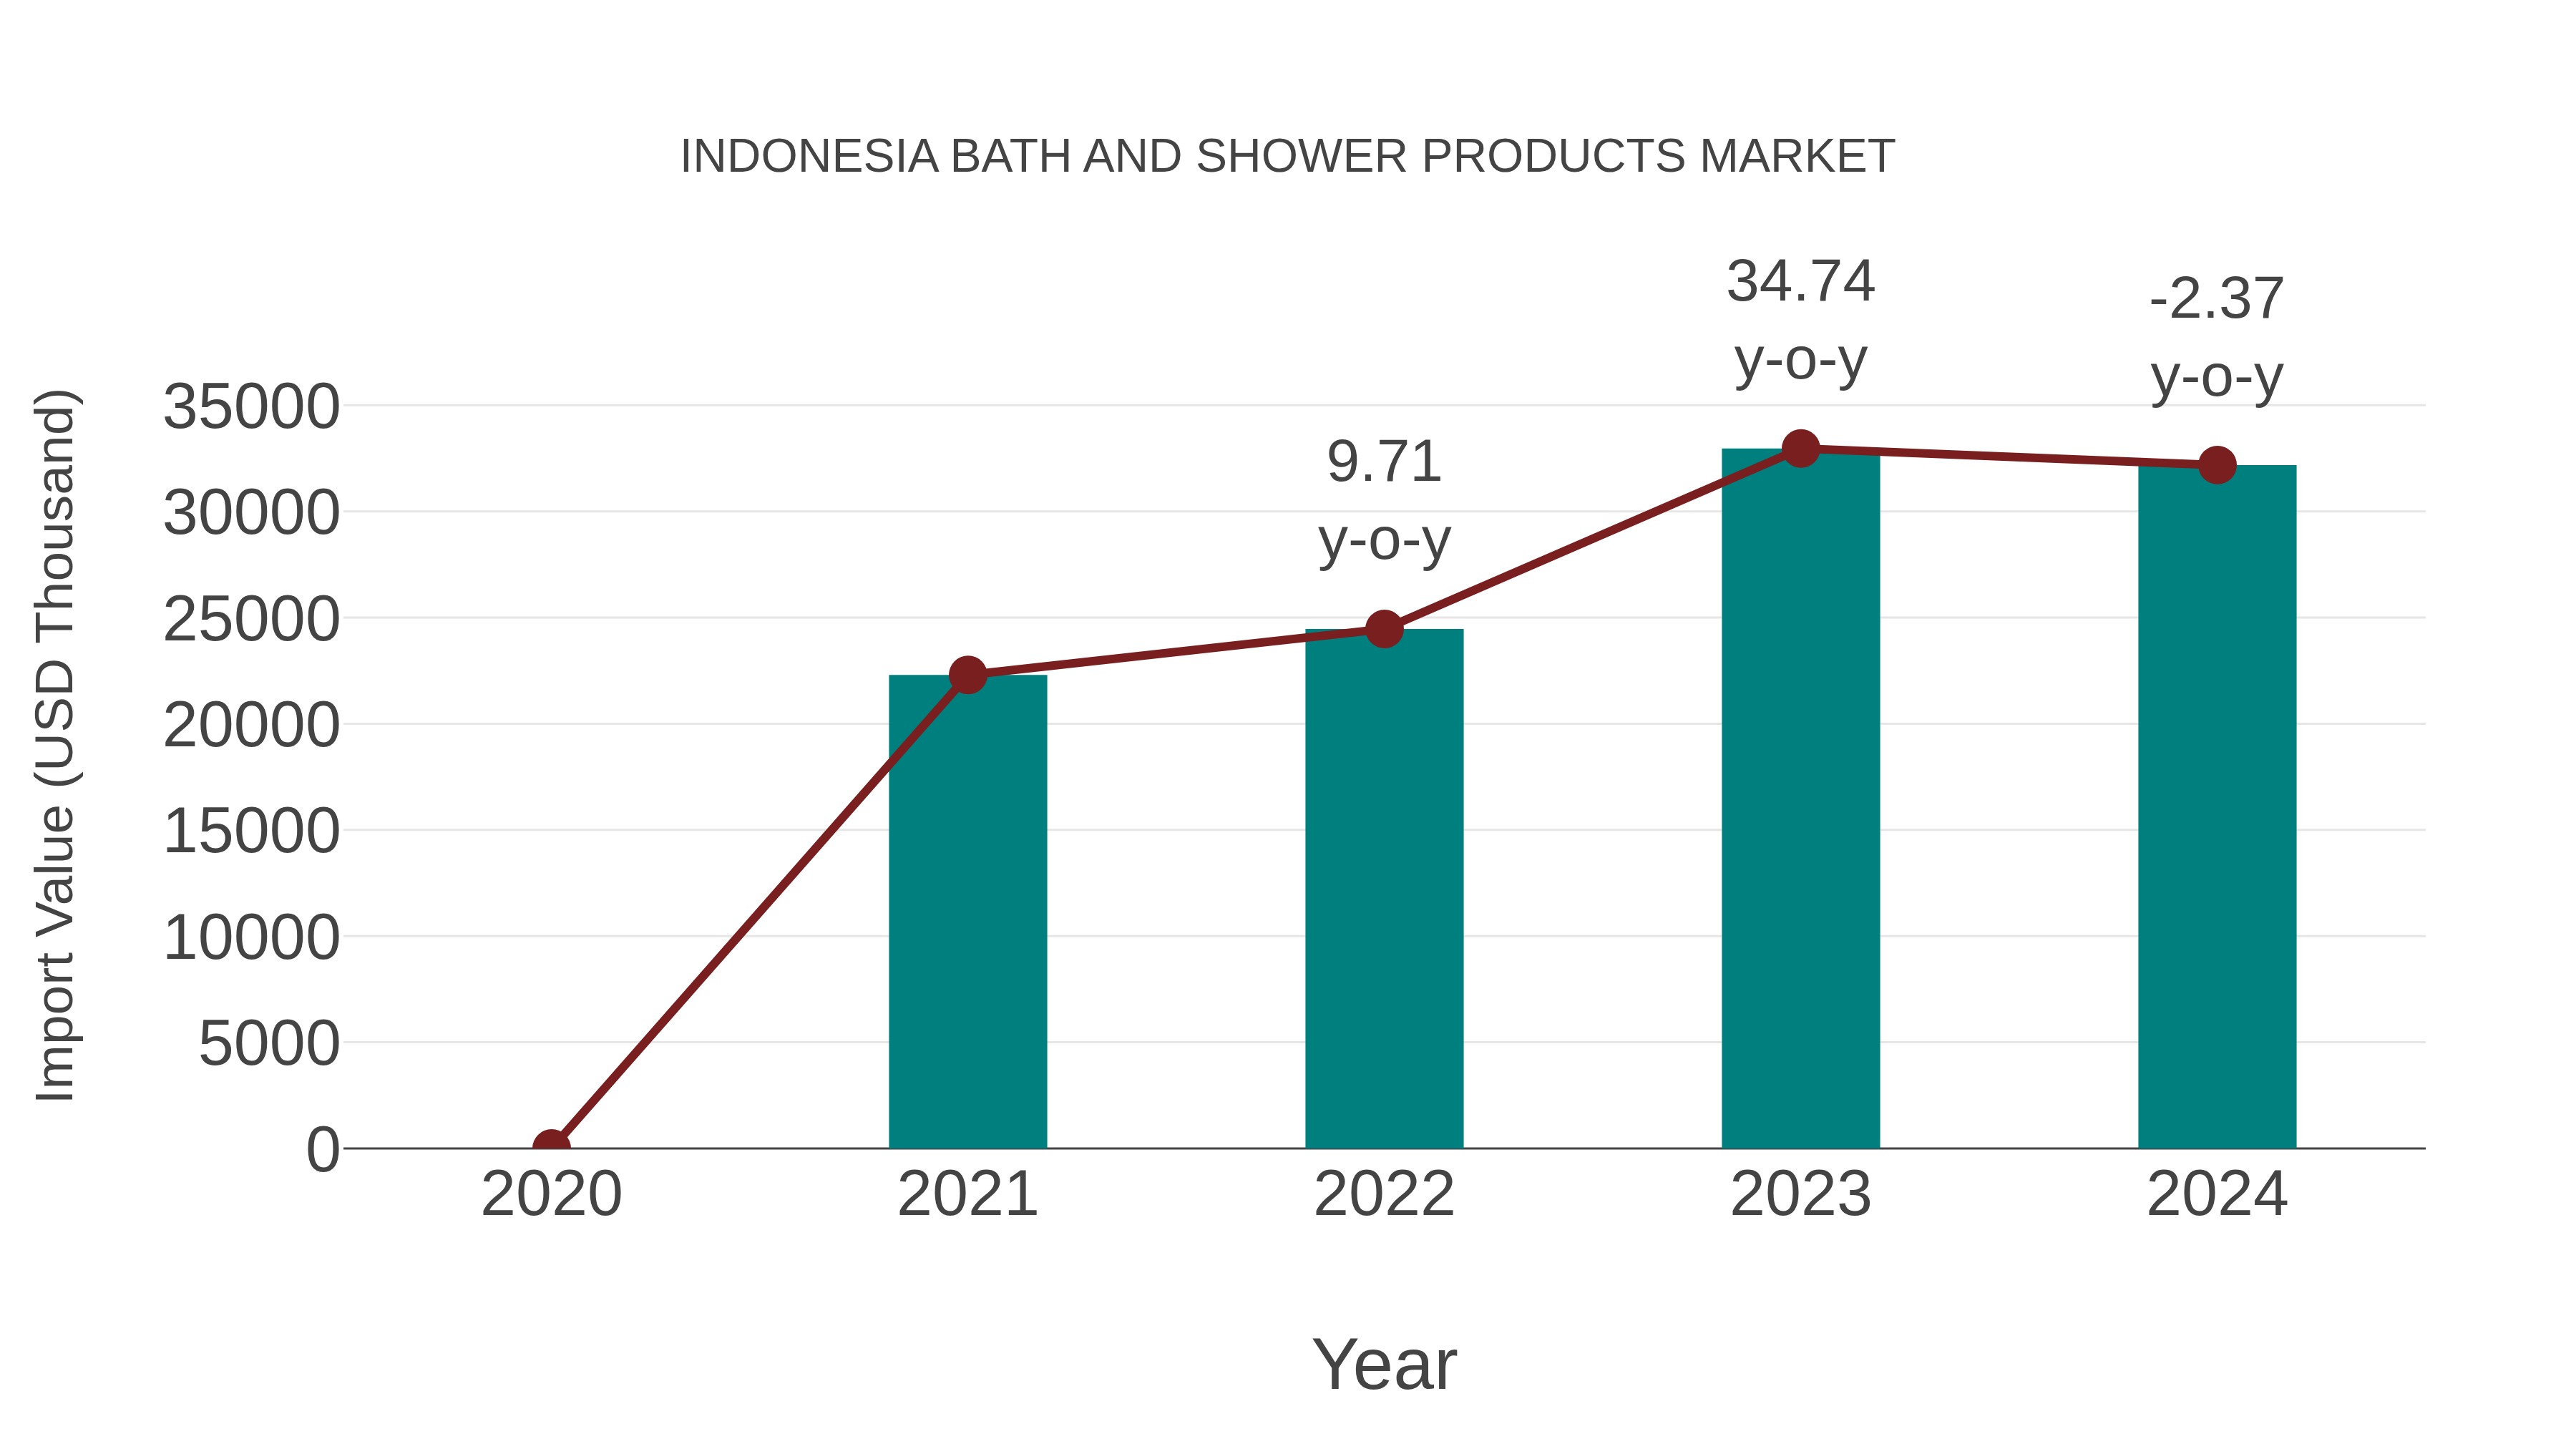
Indonesia Bath and Shower Products Market: Import Trend Analysis
In the Indonesia bath and shower products market, the import trend experienced a decline from 2023 to 2024, with a growth rate of -2.37%. However, the compound annual growth rate (CAGR) for imports from 2020 to 2024 stood at a healthy 13.01%. This dip in import momentum in 2024 may be attributed to shifting consumer preferences, changing trade policies, or market fluctuations.
Indonesia Bath and Shower Products Market Synopsis
The Indonesia bath and shower products market is expected to witness a CAGR of around 6.10% during theperiod 2020-2026. The increasing demand for aesthetically pleasing bath and shower products rising disposable income changing lifestyleamong millennials are some of the key factors that are driving theof this market in Indonesia. The country has huge potential as it is one of the major hubs for production and exports in Southeast Asia which makes it attractive to foreign investors resulting in more investments in local manufacturing plants that further boosts this market?sopportunities. In addition with an increase in living standards due to growing incomes among Indonesia citizens coupled with their preference for luxury goods including fragrant soaps body wash gels bubble baths etc. will also contribute towards itsover the coming years.
Drivers
Rising disposable income changing lifestyleamongst millennials Increasing demand for aesthetically pleasing bathroom accessories Expansion plans by leadingoperating within this sector Growing focus on product innovation promotional activities across nations such as Indonesia
Challenges Facing the Market
High prices associated with premium products Low penetration levels of these products within rural areas due to lack of awareness about usage benefits
Key Highlights of the Report:
- Indonesia Bath and Shower Products Market Outlook
- Market Size of Indonesia Bath and Shower Products Market, 2023
- Forecast of Indonesia Bath and Shower Products Market, 2030
- Historical Data and Forecast of Indonesia Bath and Shower Products Revenues & Volume for the Period 2020-2030
- Indonesia Bath and Shower Products Market Trend Evolution
- Indonesia Bath and Shower Products Market Drivers and Challenges
- Indonesia Bath and Shower Products Price Trends
- Indonesia Bath and Shower Products Porter's Five Forces
- Indonesia Bath and Shower Products Industry Life Cycle
- Historical Data and Forecast of Indonesia Bath and Shower Products Market Revenues & Volume By Type for the Period 2020-2030
- Historical Data and Forecast of Indonesia Bath and Shower Products Market Revenues & Volume By Shower Cream/Gel for the Period 2020-2030
- Historical Data and Forecast of Indonesia Bath and Shower Products Market Revenues & Volume By Bar Soap for the Period 2020-2030
- Historical Data and Forecast of Indonesia Bath and Shower Products Market Revenues & Volume By Shower Oil for the Period 2020-2030
- Historical Data and Forecast of Indonesia Bath and Shower Products Market Revenues & Volume By User for the Period 2020-2030
- Historical Data and Forecast of Indonesia Bath and Shower Products Market Revenues & Volume By Adult for the Period 2020-2030
- Historical Data and Forecast of Indonesia Bath and Shower Products Market Revenues & Volume By Baby for the Period 2020-2030
- Historical Data and Forecast of Indonesia Bath and Shower Products Market Revenues & Volume By Distribution Channel for the Period 2020-2030
- Historical Data and Forecast of Indonesia Bath and Shower Products Market Revenues & Volume By Supermarkets/Hypermarkets for the Period 2020-2030
- Historical Data and Forecast of Indonesia Bath and Shower Products Market Revenues & Volume By Convenience Stores for the Period 2020-2030
- Historical Data and Forecast of Indonesia Bath and Shower Products Market Revenues & Volume By Online Retail Stores for the Period 2020-2030
- Historical Data and Forecast of Indonesia Bath and Shower Products Market Revenues & Volume By Others for the Period 2020-2030
- Indonesia Bath and Shower Products Import Export Trade Statistics
- Market Opportunity Assessment By Type
- Market Opportunity Assessment By User
- Market Opportunity Assessment By Distribution Channel
- Indonesia Bath and Shower Products Top Companies Market Share
- Indonesia Bath and Shower Products Competitive Benchmarking By Technical and Operational Parameters
- Indonesia Bath and Shower Products Company Profiles
- Indonesia Bath and Shower Products Key Strategic Recommendations
Frequently Asked Questions About the Market Study (FAQs):
6Wresearch actively monitors the Indonesia Bath and Shower Products Market and publishes its comprehensive annual report, highlighting emerging trends, growth drivers, revenue analysis, and forecast outlook. Our insights help businesses to make data-backed strategic decisions with ongoing market dynamics. Our analysts track relevent industries related to the Indonesia Bath and Shower Products Market, allowing our clients with actionable intelligence and reliable forecasts tailored to emerging regional needs.
Yes, we provide customisation as per your requirements. To learn more, feel free to contact us on sales@6wresearch.com
1 Executive Summary |
2 Introduction |
2.1 Key Highlights of the Report |
2.2 Report Description |
2.3 Market Scope & Segmentation |
2.4 Research Methodology |
2.5 Assumptions |
3 Indonesia Bath and Shower Products Market Overview |
3.1 Indonesia Country Macro Economic Indicators |
3.2 Indonesia Bath and Shower Products Market Revenues & Volume, 2020 & 2030F |
3.3 Indonesia Bath and Shower Products Market - Industry Life Cycle |
3.4 Indonesia Bath and Shower Products Market - Porter's Five Forces |
3.5 Indonesia Bath and Shower Products Market Revenues & Volume Share, By Type, 2020 & 2030F |
3.6 Indonesia Bath and Shower Products Market Revenues & Volume Share, By User, 2020 & 2030F |
3.7 Indonesia Bath and Shower Products Market Revenues & Volume Share, By Distribution Channel, 2020 & 2030F |
4 Indonesia Bath and Shower Products Market Dynamics |
4.1 Impact Analysis |
4.2 Market Drivers |
4.2.1 Increasing disposable income levels in Indonesia leading to higher spending on personal care products. |
4.2.2 Growing awareness about personal hygiene and grooming among the Indonesian population. |
4.2.3 Influence of social media and digital marketing strategies by bath and shower product companies to reach a wider audience. |
4.3 Market Restraints |
4.3.1 Price sensitivity among consumers in Indonesia affecting the purchasing power for premium bath and shower products. |
4.3.2 Competition from local and international brands in the Indonesian market. |
4.3.3 Challenges in distribution and logistics, especially in reaching remote areas in Indonesia. |
5 Indonesia Bath and Shower Products Market Trends |
6 Indonesia Bath and Shower Products Market, By Types |
6.1 Indonesia Bath and Shower Products Market, By Type |
6.1.1 Overview and Analysis |
6.1.2 Indonesia Bath and Shower Products Market Revenues & Volume, By Type, 2020-2030F |
6.1.3 Indonesia Bath and Shower Products Market Revenues & Volume, By Shower Cream/Gel, 2020-2030F |
6.1.4 Indonesia Bath and Shower Products Market Revenues & Volume, By Bar Soap, 2020-2030F |
6.1.5 Indonesia Bath and Shower Products Market Revenues & Volume, By Shower Oil, 2020-2030F |
6.2 Indonesia Bath and Shower Products Market, By User |
6.2.1 Overview and Analysis |
6.2.2 Indonesia Bath and Shower Products Market Revenues & Volume, By Adult, 2020-2030F |
6.2.3 Indonesia Bath and Shower Products Market Revenues & Volume, By Baby, 2020-2030F |
6.3 Indonesia Bath and Shower Products Market, By Distribution Channel |
6.3.1 Overview and Analysis |
6.3.2 Indonesia Bath and Shower Products Market Revenues & Volume, By Supermarkets/Hypermarkets, 2020-2030F |
6.3.3 Indonesia Bath and Shower Products Market Revenues & Volume, By Convenience Stores, 2020-2030F |
6.3.4 Indonesia Bath and Shower Products Market Revenues & Volume, By Online Retail Stores, 2020-2030F |
6.3.5 Indonesia Bath and Shower Products Market Revenues & Volume, By Others, 2020-2030F |
7 Indonesia Bath and Shower Products Market Import-Export Trade Statistics |
7.1 Indonesia Bath and Shower Products Market Export to Major Countries |
7.2 Indonesia Bath and Shower Products Market Imports from Major Countries |
8 Indonesia Bath and Shower Products Market Key Performance Indicators |
8.1 Average order value per customer for bath and shower products in Indonesia. |
8.2 Customer retention rate for bath and shower product brands in the Indonesian market. |
8.3 Number of new product launches and innovations by bath and shower product companies in Indonesia. |
8.4 Consumer satisfaction scores and feedback on the quality and effectiveness of bath and shower products. |
9 Indonesia Bath and Shower Products Market - Opportunity Assessment |
9.1 Indonesia Bath and Shower Products Market Opportunity Assessment, By Type, 2020 & 2030F |
9.2 Indonesia Bath and Shower Products Market Opportunity Assessment, By User, 2020 & 2030F |
9.3 Indonesia Bath and Shower Products Market Opportunity Assessment, By Distribution Channel, 2020 & 2030F |
10 Indonesia Bath and Shower Products Market - Competitive Landscape |
10.1 Indonesia Bath and Shower Products Market Revenue Share, By Companies, 2023 |
10.2 Indonesia Bath and Shower Products Market Competitive Benchmarking, By Operating and Technical Parameters |
11 Company Profiles |
12 Recommendations |
13 Disclaimer |
Global Go To Market Strategy - 2030
Export potential enables firms to identify high-growth global markets with greater confidence by combining advanced trade intelligence with a structured quantitative methodology. The framework analyzes emerging demand trends and country-level import patterns while integrating macroeconomic and trade datasets such as GDP and population forecasts, bilateral import–export flows, tariff structures, elasticity differentials between developed and developing economies, geographic distance, and import demand projections. Using weighted trade values from 2020–2024 as the base period to project country-to-country export potential for 2030, these inputs are operationalized through calculated drivers such as gravity model parameters, tariff impact factors, and projected GDP per-capita growth. Through an analysis of hidden potentials, demand hotspots, and market conditions that are most favorable to success, this method enables firms to focus on target countries, maximize returns, and global expansion with data, backed by accuracy.
By factoring in the projected importer demand gap that is currently unmet and could be potential opportunity, it identifies the potential for the Exporter (Country) among 190 countries, against the general trade analysis, which identifies the biggest importer or exporter.
To discover high-growth global markets and optimize your business strategy:
Click Here
Pricing
- Single User License$ 1,995
- Department License$ 2,400
- Site License$ 3,120
- Global License$ 3,795

Leadership Perspectives from Industry Events
Search
Thought Leadership and Analyst Meet


Our Clients
6WResearch In News
- India Air Conditioner Market Set for Strong Rebound in 2026 After Weather-Led Correction and GST-Driven Recovery: 6Wresearch
- ADAS in India: How Automatic Emergency Braking, Blind Spot Detection & Driver Monitoring are Transforming Road Safety
- Doha a strategic location for EV manufacturing hub: IPA Qatar
- Demand for luxury TVs surging in the GCC, says Samsung
- Empowering Growth: The Thriving Journey of Bangladesh’s Cable Industry
- Demand for luxury TVs surging in the GCC, says Samsung
Latest Reports
- Nicaragua RPG Gaming Market (2026-2032)
- New Zealand RPG Gaming Market (2026-2032)
- Netherlands RPG Gaming Market (2026-2032)
- Nauru RPG Gaming Market (2026-2032)
- Namibia RPG Gaming Market (2026-2032)
- Mozambique RPG Gaming Market (2026-2032)
- Montenegro RPG Gaming Market (2026-2032)
- Mongolia RPG Gaming Market (2026-2032)
- Monaco RPG Gaming Market (2026-2032)
- Micronesia RPG Gaming Market (2026-2032)
Industry Events and Analyst Meet

EV India Expo 2026

HIMTEX 2026

India Refining Summit 2026

India EV Show 2026

EV tech India Expo 2026
Whitepaper
- Middle East & Africa Commercial Security Market Click here to view more.
- Middle East & Africa Fire Safety Systems & Equipment Market Click here to view more.
- GCC Drone Market Click here to view more.
- Middle East Lighting Fixture Market Click here to view more.
- GCC Physical & Perimeter Security Market Click here to view more.