Indonesia Chemical Packaging Market (2026-2032) | Size, Growth, Forecast, Companies, Trends, Industry, Analysis, Revenue, Share, Value & Outlook
Market Forecast By Product Types (Sacks, Drums, FIBC, Other), By Applications (Pharmaceutical Factory, Laboratory, Chemical Plant, Others) And Competitive Landscape
| Product Code: ETC006888 | Publication Date: Jul 2023 | Updated Date: Jun 2026 | Product Type: Report | |
| Publisher: 6Wresearch | Author: Ravi Bhandari | No. of Pages: 70 | No. of Figures: 35 | No. of Tables: 5 |
Indonesia Chemical Packaging Market Summary
The indonesia chemical packaging market was estimated at USD 193 Million in 2025 and is projected to reach USD 255 Million by 2032, growing at a CAGR of 5.2% from 2026 to 2032.
Indonesia Chemical Packaging Market Growth Rate Analysis (2021-2032)
The Indonesia chemical packaging market has shown a notable recovery and upward trend following a slight contraction of 0.5% in 2021. This shift can be attributed to increased industrial activities and an uptick in consumer demand, which saw growth rates of 4.6% in 2022 and 5.2% in 2023. As businesses invest in innovative and sustainable packaging solutions, the market is projected to maintain growth, peaking at 5.7% in 2024. Continued infrastructure development and a supportive policy environment foster this expansion. By 2032, the market is expected to stabilize at around 5.4%, signaling a robust adaptation to evolving industry standards and digitalization trends shaping the packaging landscape in Indonesia.
Indonesia Chemical Packaging Market Year-wise Growth Rate and Key Drivers
This graph highlights how the Indonesia Chemical Packaging Market has steadily grown over the past five years, supported by major growth factors.
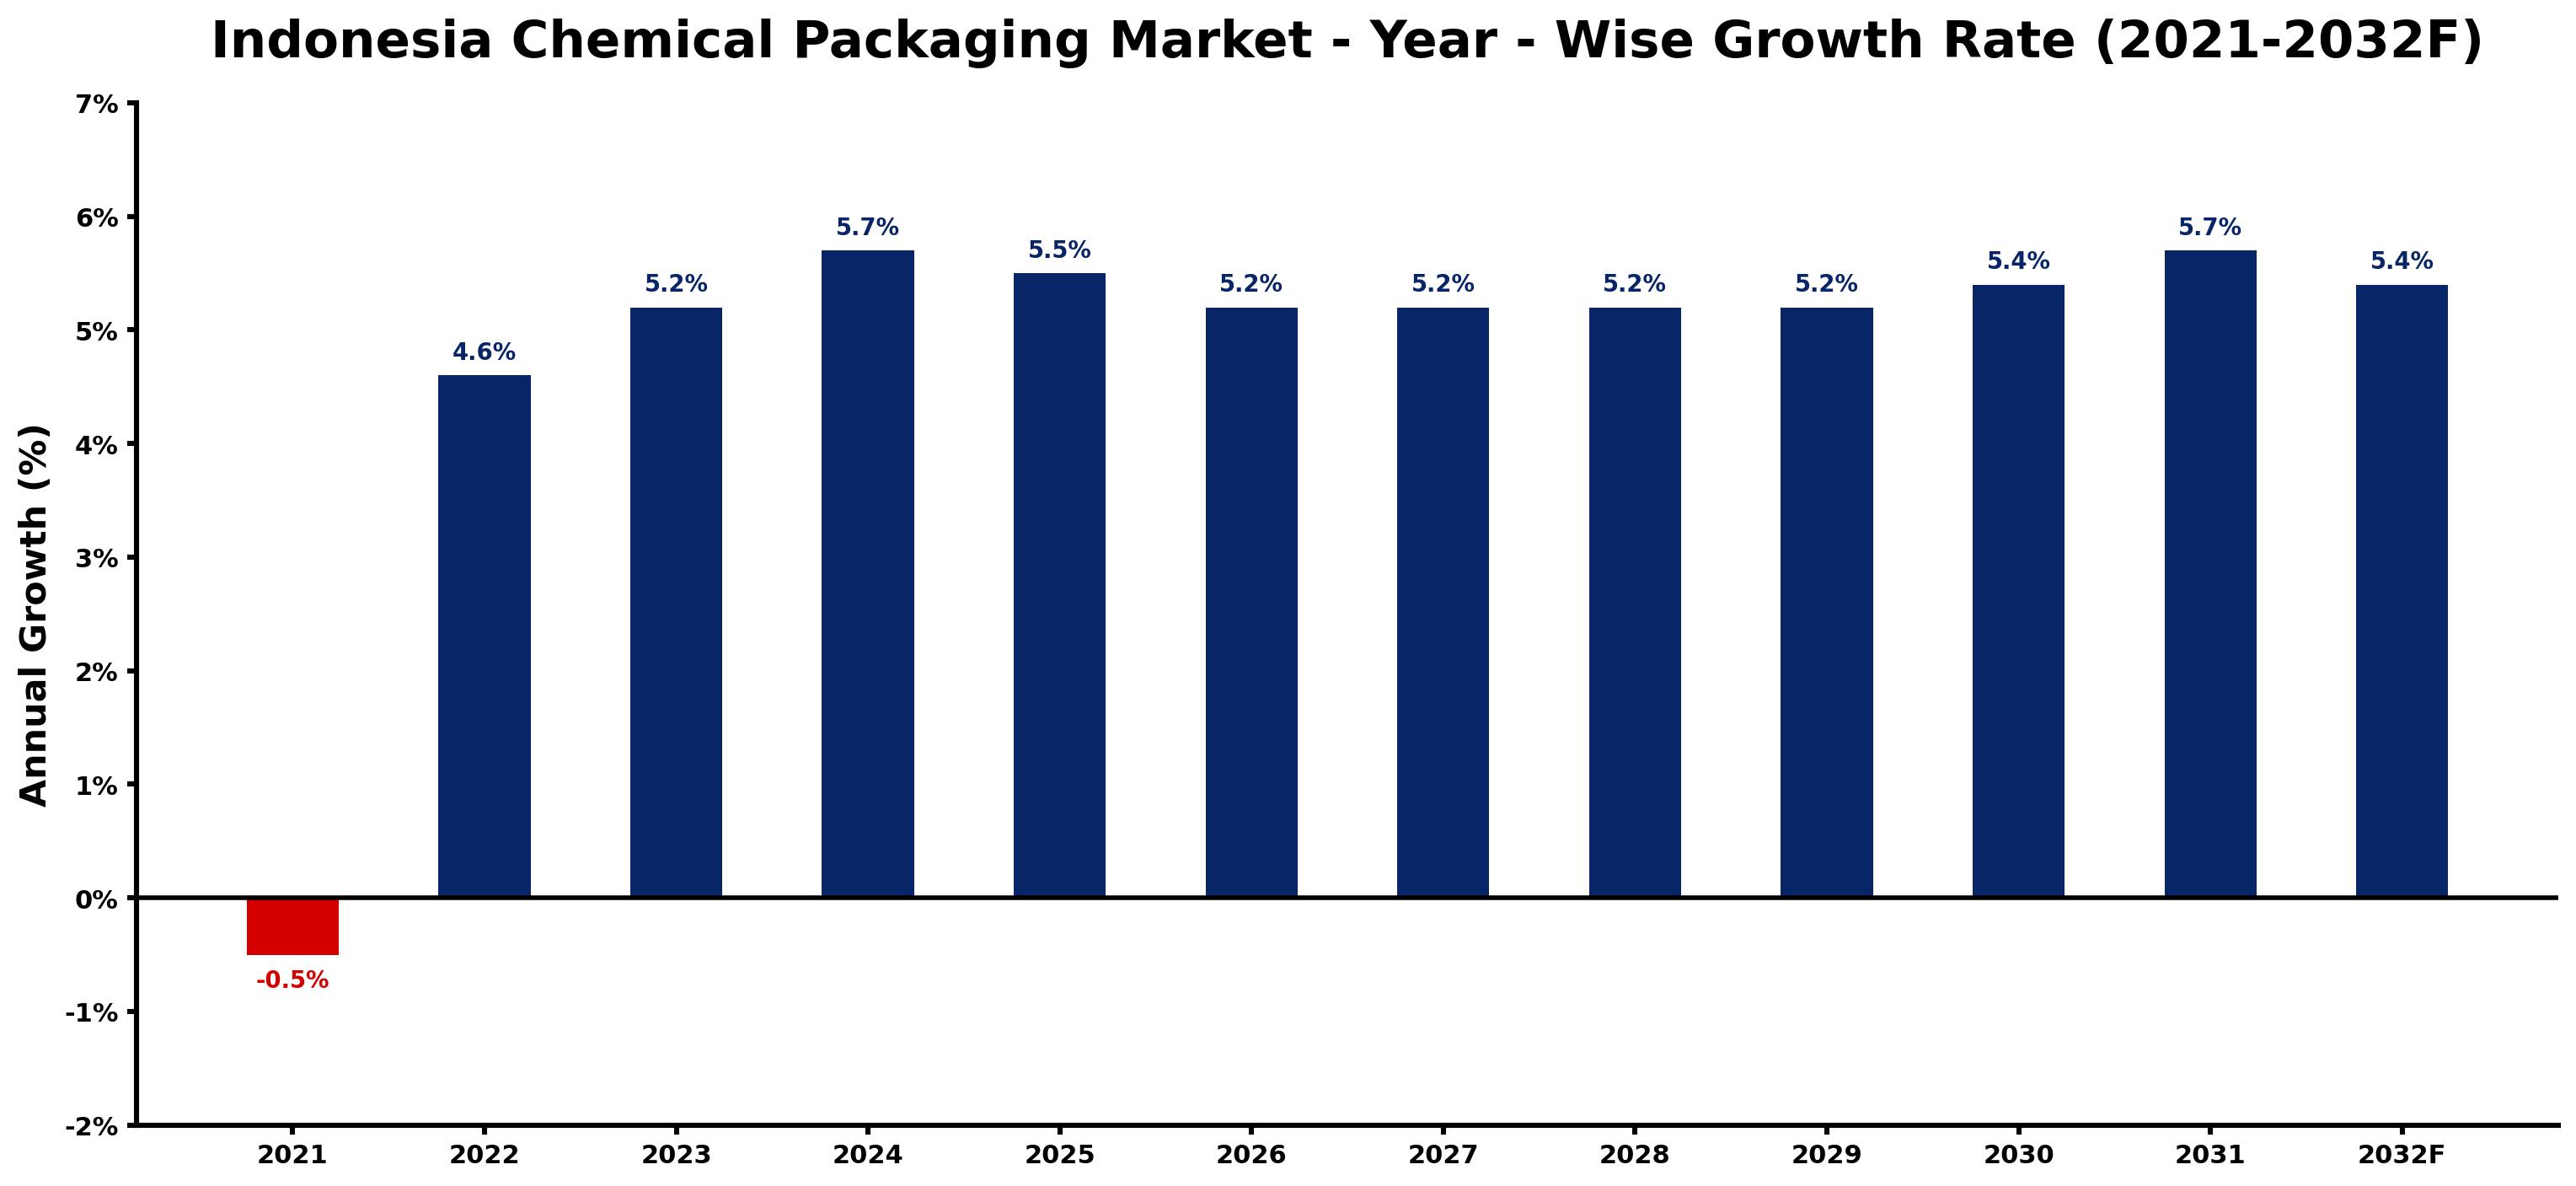
The table below presents the year wise growth rates along with the key drivers influencing the market
| Year | Growth Rate | Major Drivers |
| 2021 | -0.5% | Supply chain disruptions due to the pandemic hindered production efficiency and delayed product availability in the market. |
| 2022 | 4.6% | Consumer preference shifts toward sustainable packaging solutions shapes market dynamics significantly. |
| 2023 | 5.2% | Emerging middle-class demand for convenience fuels packaging innovation and customization efforts. |
| 2024 | 5.7% | Local manufacturers enhance capacity through technological upgrades and production efficiency improvements. |
| 2025 | 5.5% | E-commerce growth accelerates the need for durable packaging solutions across various sectors. |
| 2026 | 5.2% | Rising environmental awareness drives companies to adopt biodegradable and eco-friendly materials. |
| 2027 | 5.2% | Supply chain diversification leads to increased local sourcing of raw packaging materials. |
| 2028 | 5.2% | Investments in logistics infrastructure streamline distribution channels for chemical products. |
| 2029 | 5.2% | International collaborations enhance knowledge transfer, boosting domestic packaging technology advancements. |
| 2030 | 5.4% | Market consolidation occurs as key players pursue strategic mergers for competitive advantages. |
| 2031 | 5.7% | Regulatory changes prompt manufacturers to adapt to stricter safety and quality standards. |
| 2032 | 5.4% | Digital transformation initiatives support smart packaging solutions, enhancing consumer engagement and tracking. |
Note - Market size estimations and growth projections presented in this report are based on 6Wresearch's advanced forecasting approach, validated with industry datasets as of June 2026.
Indonesia Chemical Packaging Market Synopsis
The Indonesia Chemical Packaging Market is projected to reach 5.2% and witness significant growth during the forecast period (2026-2032). This growth is predominantly driven by increasing consumer preference for convenience and safety in packaging, coupled with rising demand from various end-user industries, including food and beverage, healthcare, agriculture, and personal care. The heightened awareness surrounding health among Indonesian consumers has resulted in increased spending on packaged products, thereby augmenting the chemical packaging materials market in the nation. Additionally, rising investments by multinational corporations to establish production facilities within Indonesia are anticipated to fuel market expansion over the forecast timeframe.
Indonesia Chemical Packaging Market Growth Drivers
Several factors are propelling the Indonesia Chemical Packaging Market forward:
- Rising demand from various end-user industries directly influences the growth of the Indonesia chemical packaging market. The food and beverage sector is particularly notable, as the increased consumption of ready-to-eat foods has driven higher acceptance of packaged products.
- Consumer health consciousness is on the rise, largely due to urbanization and lifestyle changes, leading to greater demand for organic and naturally sourced products that require effective packaging solutions for preservation.
- The increasing importance placed on food safety and product integrity has resulted in higher adoption rates of advanced chemical packaging materials that provide enhanced protection and shelf life.
- Innovations in packaging technology, including the development of biodegradable and eco-friendly materials, cater to the growing segment of environmentally conscious consumers, further stimulating market demand.
- The robust growth trajectory of the healthcare sector in Indonesia, amplified by the ongoing emphasis on personal care products, contributes significantly to the rising need for specialized chemical packaging solutions.
Indonesia Chemical Packaging Market Challenges and Restraints
Despite the promising growth prospects, the Indonesia Chemical Packaging Market faces several challenges:
- The high costs associated with chemical packaging materials pose a significant barrier for manufacturers, impacting their ability to maintain profitability while meeting quality standards in a price-sensitive market.
- Availability issues surrounding quality chemicals can hinder manufacturers' supply chains, complicating production processes and increasing operational inefficiencies.
- The fluctuating prices of raw materials, driven by global supply chain dynamics, can adversely affect manufacturing costs and ultimately the pricing strategies of packaged goods.
- Strict regulatory guidelines surrounding the use of certain chemicals and materials in packaging can complicate compliance for manufacturers, potentially leading to increased operational expenses.
- Competition from unregulated and low-cost alternatives may challenge market players, particularly in a developing economy like Indonesia, where price sensitivity among consumers is a major concern.
Indonesia Chemical Packaging Market Investment Opportunities
With the expected growth of the market, several investment opportunities emerge within the Indonesia Chemical Packaging Market:
- Investment in innovative packaging solutions, especially those integrating smart technology for enhanced safety and traceability, can attract consumer interest and ultimately drive sales.
- Developing biodegradable and sustainable packaging options presents a significant opportunity for companies aiming to align with environmental regulations and meet consumer expectations for eco-friendly products.
- Establishing strategic partnerships with local businesses can enhance distribution channels, allowing for better penetration in the growing regional markets across Indonesia.
- Investing in research and development to create advanced chemical formulations that improve product shelf life and reduce spoilage will bolster competitive advantage in the chemical packaging space.
- Exploring government incentives aimed at manufacturing and exporting chemical packaging materials can provide financial advantages, further increasing the attractiveness of market entry.
Indonesia Chemical Packaging Market Government Investment and Initiatives
The Indonesian government is taking significant steps to bolster the chemical packaging sector through various initiatives:
- Public spending on infrastructure improvements is designed to enhance the manufacturing capabilities within the country, thereby attracting investments from both local and foreign entities.
- Government incentives for environmentally friendly practices in the packaging industry encourage manufacturers to adopt sustainable materials and processes, aligning with global environmental standards.
- Development plans focusing on strengthening the supply chain for locally sourced raw materials aim to reduce dependence on imports, thus stabilizing prices and ensuring consistent quality.
- Policy support for small and medium enterprises (SMEs) involved in chemical packaging fosters innovation and competition, contributing to the overall growth of the industry.
- Regulatory frameworks are being established to ensure the quality and safety standards of packaging materials, enhancing consumer trust and industry credibility.
Indonesia Chemical Packaging Market Latest Developments (May 2025 - June 2026)
Recent developments in the Indonesia Chemical Packaging Market indicate a shift towards modernization and sustainability:
- Increasing collaborations between local manufacturers and international players have been observed, aimed at enhancing technology transfer and expertise in advanced packaging solutions.
- The emergence of new startups focusing on innovative packaging designs and materials reflects a growing entrepreneurial spirit within the sector, contributing to diverse product offerings.
- Heightened focus on consumer education about packaging safety and sustainability is likely to shape purchasing behaviors, urging companies to adapt their packaging strategies accordingly.
- Investments in automation and smart manufacturing technologies are on the rise, enabling companies to streamline operations and reduce costs associated with labor and material waste.
- Development of regulations related to waste management and recycling practices in packaging is being prioritized, aligning the industry with global sustainability goals.
Indonesia Chemical Packaging Market - Key Attractiveness of the Report
- 10 Years of Market Numbers
- Historical Data Starting from 2022 to 2025
- Base Year: 2025
- Forecast Data until 2032
- Key Performance Indicators Impacting the Market
- Major Upcoming Developments and Projects
Key Highlights of the Report:
- Indonesia Chemical Packaging Market Outlook
- Market Size of Indonesia Chemical Packaging Market, 2025
- Forecast of Indonesia Chemical Packaging Market, 2032
- Historical Data and Forecast of Indonesia Chemical Packaging Revenues & Volume for the Period 2022-2032F
- Indonesia Chemical Packaging Market Trend Evolution
- Indonesia Chemical Packaging Market Drivers and Challenges
- Indonesia Chemical Packaging Price Trends
- Indonesia Chemical Packaging Porter's Five Forces
- Indonesia Chemical Packaging Industry Life Cycle
- Historical Data and Forecast of Indonesia Chemical Packaging Market Revenues & Volume By Product Types for the Period 2022-2032F
- Historical Data and Forecast of Indonesia Chemical Packaging Market Revenues & Volume By Sacks for the Period 2022-2032F
- Historical Data and Forecast of Indonesia Chemical Packaging Market Revenues & Volume By Drums for the Period 2022-2032F
- Historical Data and Forecast of Indonesia Chemical Packaging Market Revenues & Volume By FIBC for the Period 2022-2032F
- Historical Data and Forecast of Indonesia Chemical Packaging Market Revenues & Volume By Other for the Period 2022-2032F
- Historical Data and Forecast of Indonesia Chemical Packaging Market Revenues & Volume By Applications for the Period 2022-2032F
- Historical Data and Forecast of Indonesia Chemical Packaging Market Revenues & Volume By Pharmaceutical Factory? for the Period 2022-2032F
- Historical Data and Forecast of Indonesia Chemical Packaging Market Revenues & Volume By Laboratory for the Period 2022-2032F
- Historical Data and Forecast of Indonesia Chemical Packaging Market Revenues & Volume By Chemical Plant? for the Period 2022-2032F
- Historical Data and Forecast of Indonesia Chemical Packaging Market Revenues & Volume By Others for the Period 2022-2032F
- Indonesia Chemical Packaging Import Export Trade Statistics
- Market Opportunity Assessment By Product Types
- Market Opportunity Assessment By Applications
- Indonesia Chemical Packaging Top Companies Market Share
- Indonesia Chemical Packaging Competitive Benchmarking By Technical and Operational Parameters
- Indonesia Chemical Packaging Company Profiles
- Indonesia Chemical Packaging Key Strategic Recommendations
Frequently Asked Questions About the Market Study (FAQs):
The growth is driven by rising consumer demand for packaged products across various sectors, including food, healthcare, and personal care, alongside increasing health awareness among the population.
High costs associated with chemical packaging materials and fluctuating raw material prices are among the primary challenges affecting manufacturers in this sector.
The government is supporting the industry through public spending on infrastructure, incentives for sustainable practices, and establishing regulatory frameworks to ensure quality and safety standards.
Recent trends include increased collaboration with international firms, a focus on sustainable packaging solutions, and the adoption of automation in manufacturing processes.
6Wresearch actively monitors the Indonesia Chemical Packaging Market and publishes its comprehensive annual report, highlighting emerging trends, growth drivers, revenue analysis, and forecast outlook. Our insights help businesses to make data-backed strategic decisions with ongoing market dynamics. Our analysts track relevent industries related to the Indonesia Chemical Packaging Market, allowing our clients with actionable intelligence and reliable forecasts tailored to emerging regional needs.
Yes, we provide customisation as per your requirements. To learn more, feel free to contact us on sales@6wresearch.com
1 Executive Summary |
2 Introduction |
2.1 Key Highlights of the Report |
2.2 Report Description |
2.3 Market Scope & Segmentation |
2.4 Research Methodology |
2.5 Assumptions |
3 Indonesia Chemical Packaging Market Overview |
3.1 Indonesia Country Macro Economic Indicators |
3.2 Indonesia Chemical Packaging Market Revenues & Volume, 2022 & 2032F |
3.3 Indonesia Chemical Packaging Market - Industry Life Cycle |
3.4 Indonesia Chemical Packaging Market - Porter's Five Forces |
3.5 Indonesia Chemical Packaging Market Revenues & Volume Share, By Product Types, 2022 & 2032F |
3.6 Indonesia Chemical Packaging Market Revenues & Volume Share, By Applications, 2022 & 2032F |
4 Indonesia Chemical Packaging Market Dynamics |
4.1 Impact Analysis |
4.2 Market Drivers |
4.2.1 Growth in the chemical industry in Indonesia |
4.2.2 Increasing demand for sustainable and eco-friendly packaging solutions |
4.2.3 Government initiatives promoting the use of safe and compliant packaging materials |
4.3 Market Restraints |
4.3.1 Fluctuating raw material prices impacting production costs |
4.3.2 Stringent regulations and compliance requirements for chemical packaging |
4.3.3 Competition from alternative packaging materials like biodegradable or compostable options |
5 Indonesia Chemical Packaging Market Trends |
6 Indonesia Chemical Packaging Market, By Types |
6.1 Indonesia Chemical Packaging Market, By Product Types |
6.1.1 Overview and Analysis |
6.1.2 Indonesia Chemical Packaging Market Revenues & Volume, By Product Types, 2022-2032F |
6.1.3 Indonesia Chemical Packaging Market Revenues & Volume, By Sacks, 2022-2032F |
6.1.4 Indonesia Chemical Packaging Market Revenues & Volume, By Drums, 2022-2032F |
6.1.5 Indonesia Chemical Packaging Market Revenues & Volume, By FIBC, 2022-2032F |
6.1.6 Indonesia Chemical Packaging Market Revenues & Volume, By Other, 2022-2032F |
6.2 Indonesia Chemical Packaging Market, By Applications |
6.2.1 Overview and Analysis |
6.2.2 Indonesia Chemical Packaging Market Revenues & Volume, By Pharmaceutical Factory , 2022-2032F |
6.2.3 Indonesia Chemical Packaging Market Revenues & Volume, By Laboratory, 2022-2032F |
6.2.4 Indonesia Chemical Packaging Market Revenues & Volume, By Chemical Plant , 2022-2032F |
6.2.5 Indonesia Chemical Packaging Market Revenues & Volume, By Others, 2022-2032F |
7 Indonesia Chemical Packaging Market Import-Export Trade Statistics |
7.1 Indonesia Chemical Packaging Market Export to Major Countries |
7.2 Indonesia Chemical Packaging Market Imports from Major Countries |
8 Indonesia Chemical Packaging Market Key Performance Indicators |
8.1 Percentage of chemical companies adopting environmentally friendly packaging solutions |
8.2 Compliance rate with packaging regulations and standards in the chemical industry |
8.3 Number of new product innovations in chemical packaging to meet sustainability goals |
8.4 Adoption rate of advanced technologies in chemical packaging production |
8.5 Customer satisfaction and feedback on the quality and safety of chemical packaging solutions |
9 Indonesia Chemical Packaging Market - Opportunity Assessment |
9.1 Indonesia Chemical Packaging Market Opportunity Assessment, By Product Types, 2022 & 2032F |
9.2 Indonesia Chemical Packaging Market Opportunity Assessment, By Applications, 2022 & 2032F |
10 Indonesia Chemical Packaging Market - Competitive Landscape |
10.1 Indonesia Chemical Packaging Market Revenue Share, By Companies, 2025 |
10.2 Indonesia Chemical Packaging Market Competitive Benchmarking, By Operating and Technical Parameters |
11 Company Profiles |
12 Recommendations |
13 Disclaimer |
Global Go To Market Strategy - 2030
Export potential enables firms to identify high-growth global markets with greater confidence by combining advanced trade intelligence with a structured quantitative methodology. The framework analyzes emerging demand trends and country-level import patterns while integrating macroeconomic and trade datasets such as GDP and population forecasts, bilateral import–export flows, tariff structures, elasticity differentials between developed and developing economies, geographic distance, and import demand projections. Using weighted trade values from 2020–2024 as the base period to project country-to-country export potential for 2030, these inputs are operationalized through calculated drivers such as gravity model parameters, tariff impact factors, and projected GDP per-capita growth. Through an analysis of hidden potentials, demand hotspots, and market conditions that are most favorable to success, this method enables firms to focus on target countries, maximize returns, and global expansion with data, backed by accuracy.
By factoring in the projected importer demand gap that is currently unmet and could be potential opportunity, it identifies the potential for the Exporter (Country) among 190 countries, against the general trade analysis, which identifies the biggest importer or exporter.
To discover high-growth global markets and optimize your business strategy:
Click Here
Pricing
- Single User License$ 1,995
- Department License$ 2,400
- Site License$ 3,120
- Global License$ 3,795

Leadership Perspectives from Industry Events
Search
Thought Leadership and Analyst Meet


Our Clients
6WResearch In News
- India Air Conditioner Market Set for Strong Rebound in 2026 After Weather-Led Correction and GST-Driven Recovery: 6Wresearch
- ADAS in India: How Automatic Emergency Braking, Blind Spot Detection & Driver Monitoring are Transforming Road Safety
- Doha a strategic location for EV manufacturing hub: IPA Qatar
- Demand for luxury TVs surging in the GCC, says Samsung
- Empowering Growth: The Thriving Journey of Bangladesh’s Cable Industry
- Demand for luxury TVs surging in the GCC, says Samsung
Latest Reports
- Nicaragua RPG Gaming Market (2026-2032)
- New Zealand RPG Gaming Market (2026-2032)
- Netherlands RPG Gaming Market (2026-2032)
- Nauru RPG Gaming Market (2026-2032)
- Namibia RPG Gaming Market (2026-2032)
- Mozambique RPG Gaming Market (2026-2032)
- Montenegro RPG Gaming Market (2026-2032)
- Mongolia RPG Gaming Market (2026-2032)
- Monaco RPG Gaming Market (2026-2032)
- Micronesia RPG Gaming Market (2026-2032)
Industry Events and Analyst Meet

HIMTEX 2026

India Refining Summit 2026

India EV Show 2026

EV tech India Expo 2026

Auto Tech Asia 2026
Whitepaper
- Middle East & Africa Commercial Security Market Click here to view more.
- Middle East & Africa Fire Safety Systems & Equipment Market Click here to view more.
- GCC Drone Market Click here to view more.
- Middle East Lighting Fixture Market Click here to view more.
- GCC Physical & Perimeter Security Market Click here to view more.