Indonesia Contactless Payment Market Size & Growth Rate (2026-2032)
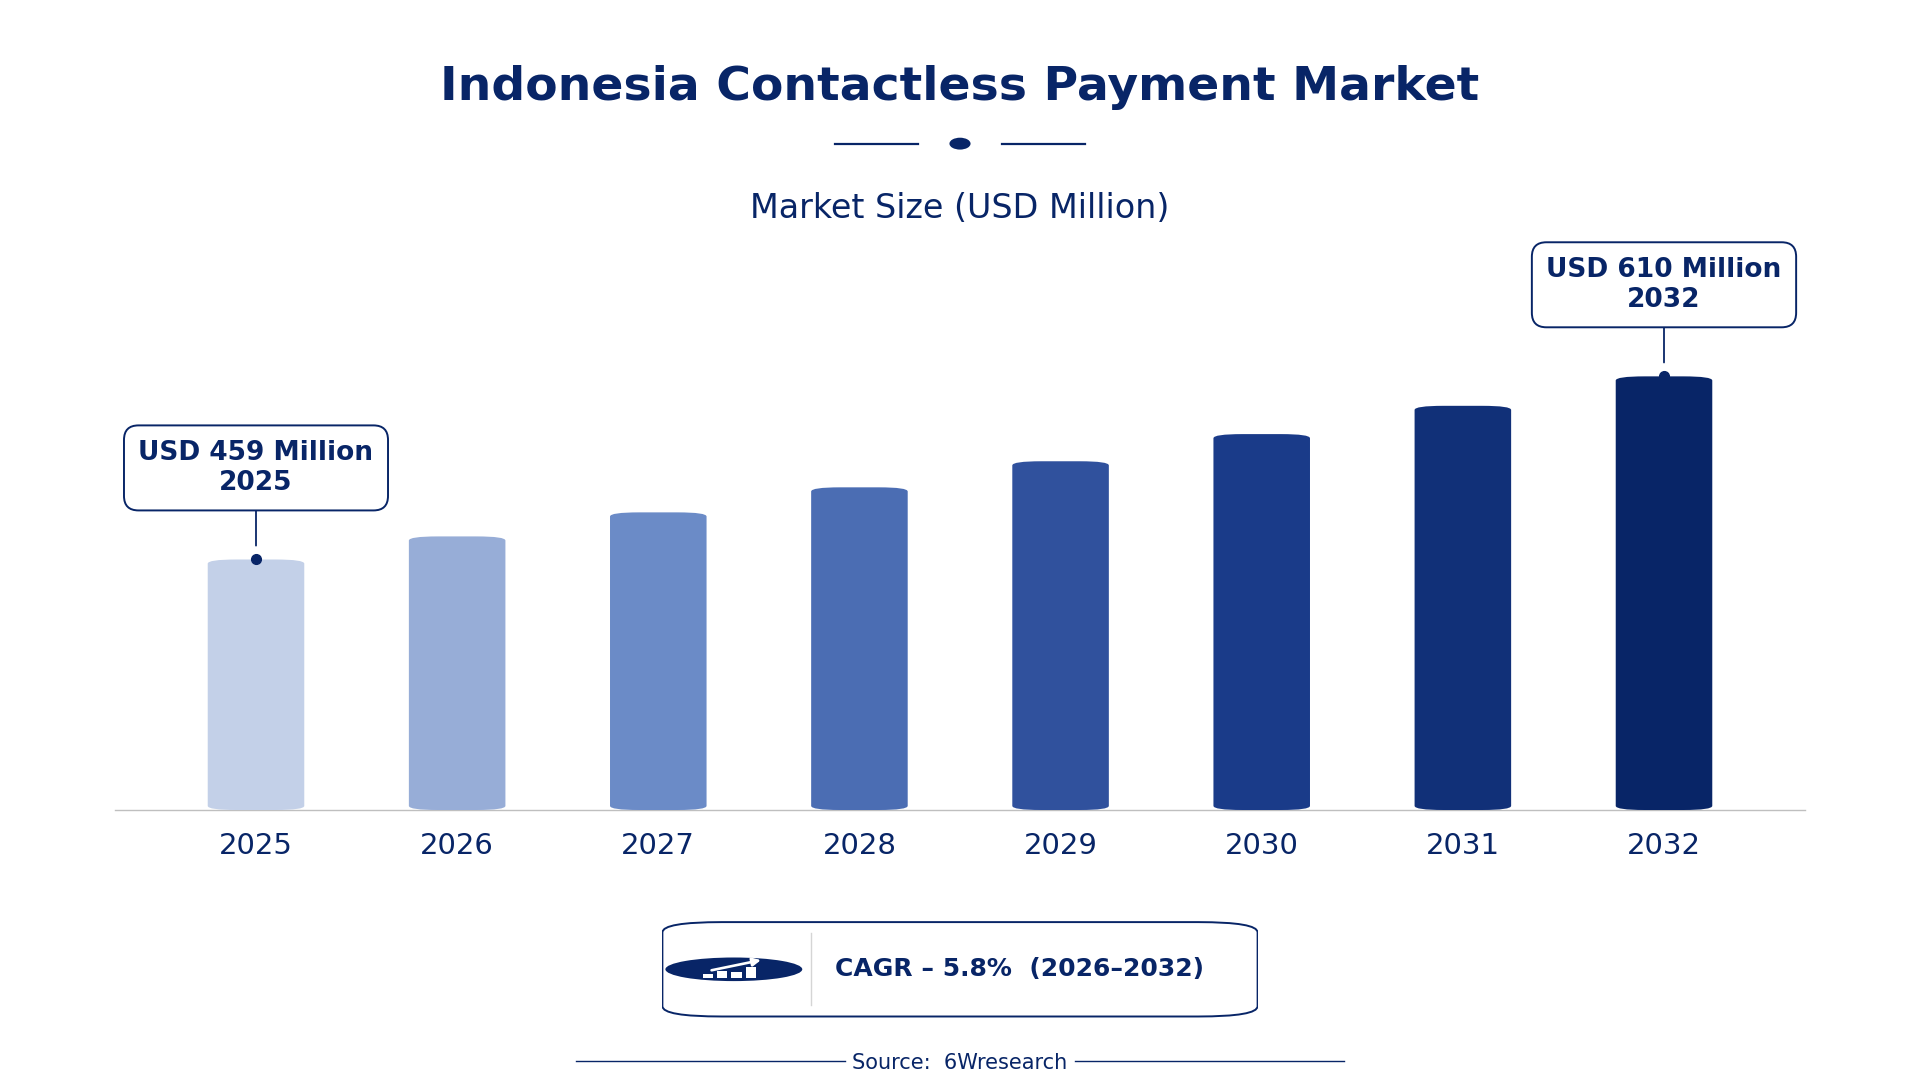
The Indonesia Contactless Payment Market was estimated at USD 459 Million in 2025 and is projected to reach USD 610 Million by 2032, growing at a CAGR of 5.8% from 2026 to 2032.
Indonesia Contactless Payment Market Synopsis
The rise of mobile wallets in Indonesia has dramatically transformed the payment experience for consumers. With a substantial portion of the population now equipped with smartphones, the demand for contactless payment methods has surged, fostering a shift from cash transactions to digital alternatives.
As urbanization accelerates and internet penetration deepens, contactless payment systems are becoming integral to everyday transactions. This trend is not just limited to urban centers; even in rural areas, the increasing availability of mobile banking solutions is driving adoption rates higher.
Indonesia Contactless Payment Market Year-wise Growth Rate and Key Drivers
This graph illustrates the annual growth rates of the Indonesia Contactless Payment Market from 2021 to 2032, highlighting a steady upward trajectory and projected expansion over the forecast period.
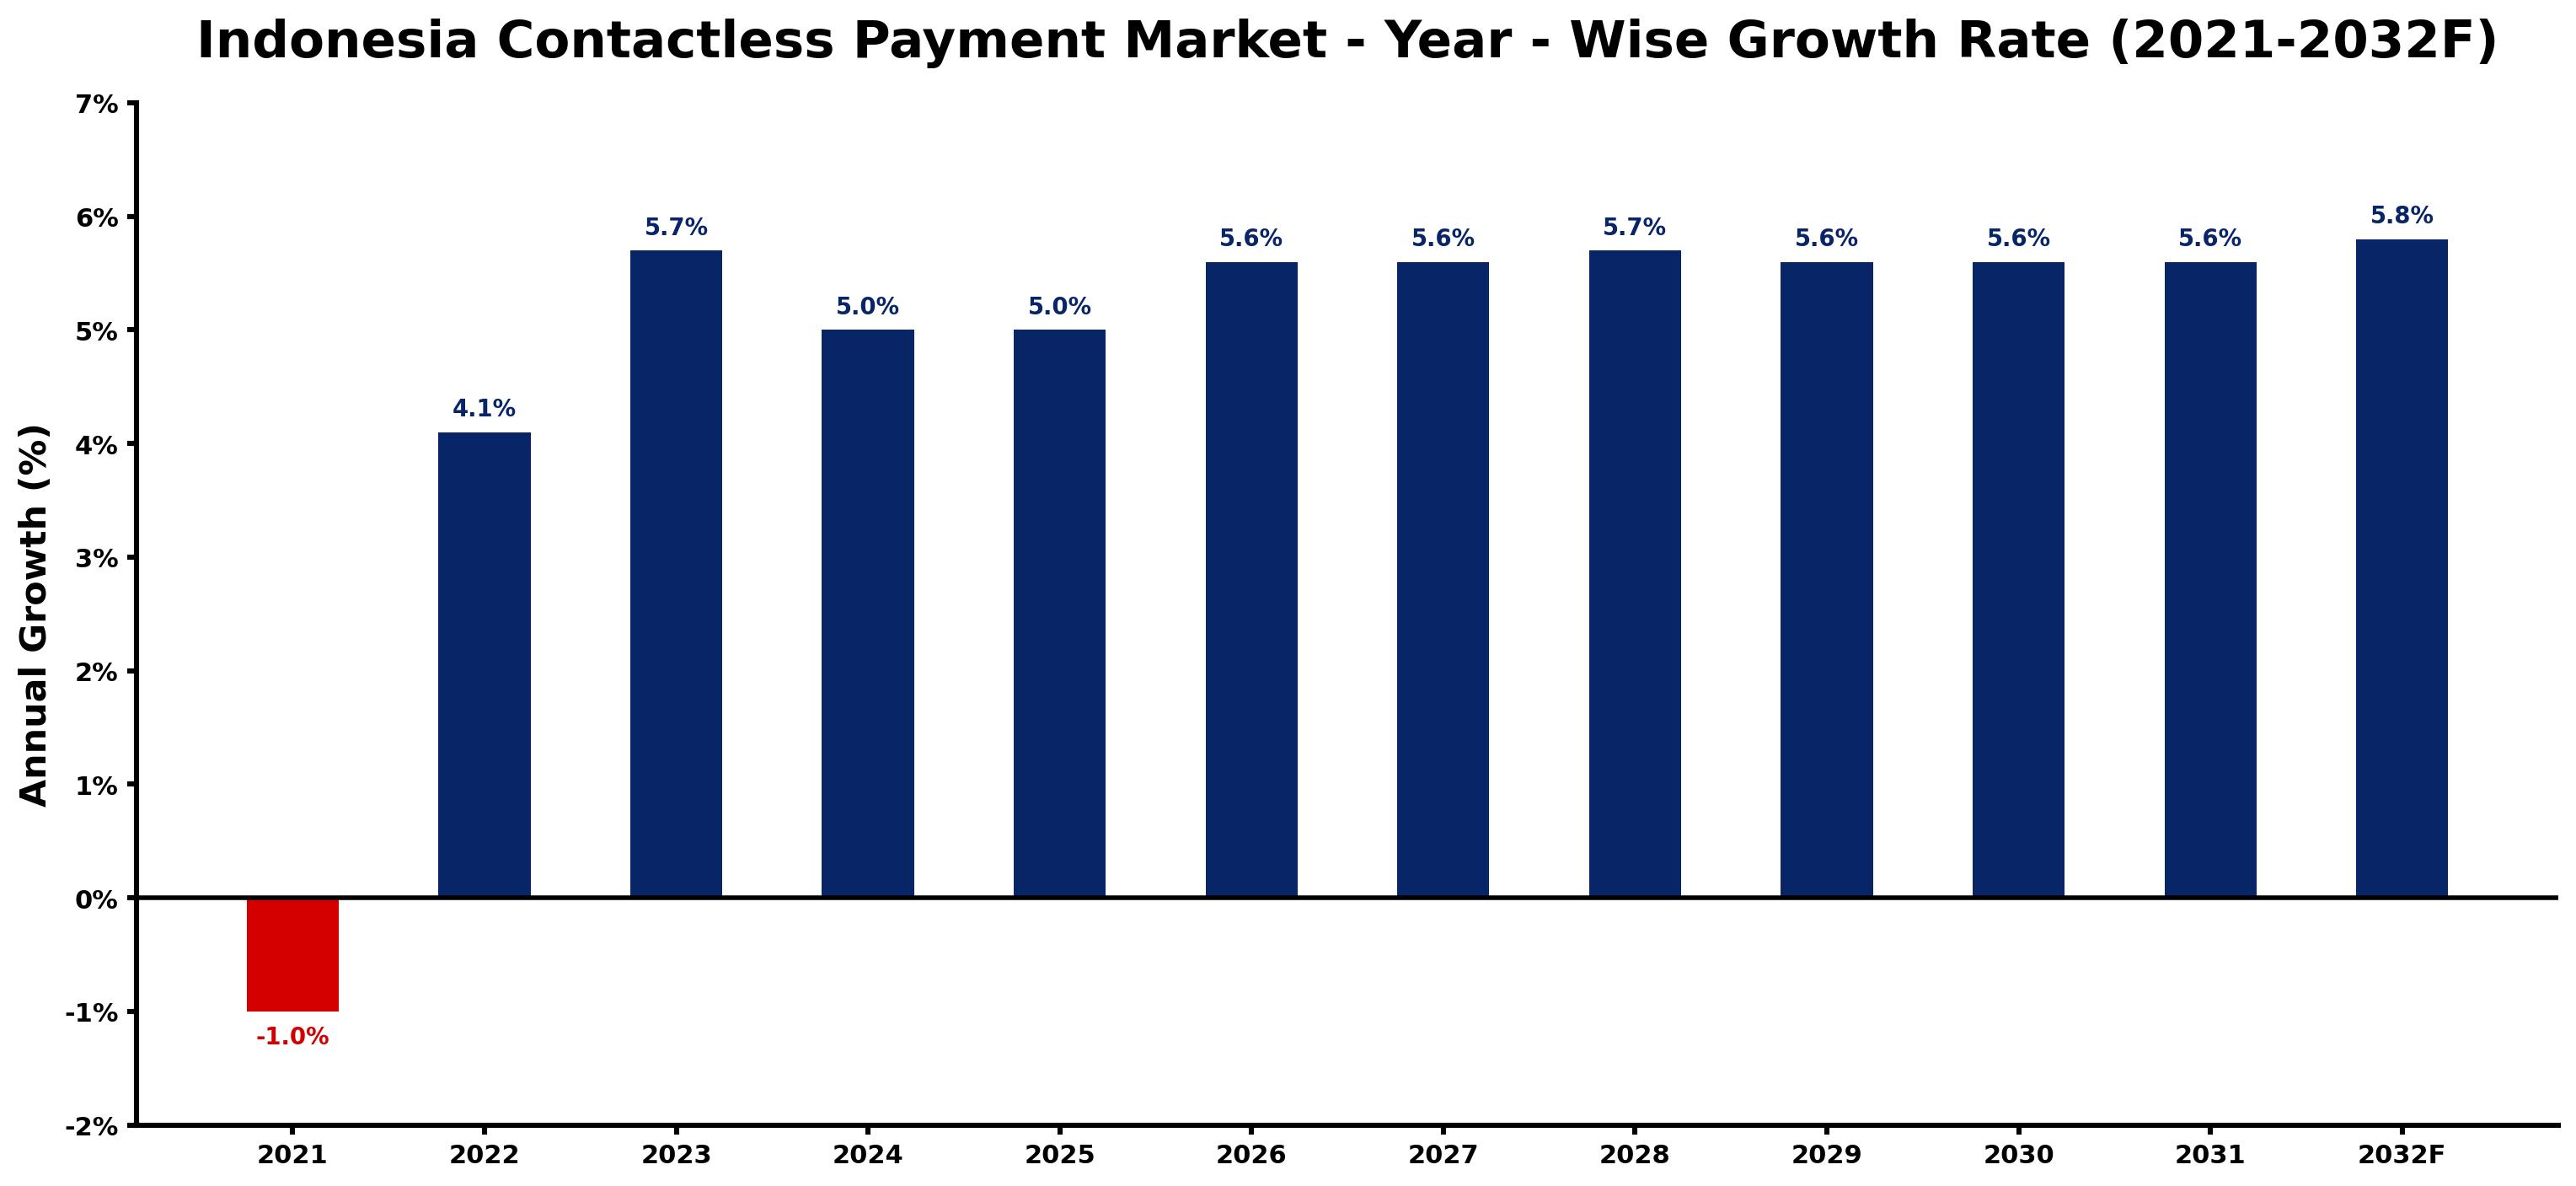
The table below presents the year‑wise growth rates along with the key drivers influencing the market
| Year | Growth Rate | Major Drivers |
| 2021 | -1.0% | Bank Indonesia restricts payment app partnerships. |
| 2022 | 4.1% | Central Bank's digital payment literacy initiatives launched |
| 2023 | 5.7% | Government push for cashless transactions in public services |
| 2024 | 5.0% | E-commerce growth using contactless payments for convenience |
| 2025 | 5.0% | Increased security measures for digital payment platforms |
| 2026 | 5.6% | Rising tourist influx stimulating contactless payment adoption |
| 2027 | 5.6% | Integration of contactless payments in local retail chains |
| 2028 | 5.7% | Collaboration with fintech startups enhancing payment solutions |
| 2029 | 5.6% | Expanded partnerships with international payment networks |
| 2030 | 5.6% | Regulatory framework supporting digital payment safeguards established |
| 2031 | 5.6% | Increased demand for convenient payment options among millennials |
| 2032 | 5.8% | Government incentives for businesses adopting contactless technology |
Note: Market size estimations and growth projections presented in this report are based on 6Wresearch's proprietary forecasting methodology, utilizing the latest available industry data, government publications, and primary research inputs.
Indonesia Contactless Payment Market Key Takeaways
Below are some of the specific key takeaways from the market, including:
- The growing acceptance of QR code payments is reshaping consumer behavior across various sectors.
- Mobile wallets are leading the charge, backed by strong consumer trust and enhanced security features.
- Integration with IoT technologies is paving the way for more efficient and secure payment ecosystems.
- Collaboration between fintechs and traditional banks is creating a competitive environment, further boosting market growth.
- Consumer demand for convenience and speed remains a driving force behind the expansion of contactless payment options.
Evaluation of Restraints in Indonesia Contactless Payment Market
While the growth prospects for contactless payments in Indonesia are promising, several factors pose challenges. Infrastructure development remains a pressing concern, particularly in remote regions where internet connectivity and payment acceptance are limited. These gaps hinder the widespread adoption of contactless solutions.
on top of that, data security issues continue to be a significant barrier. Consumer apprehension regarding the safety of digital transactions can slow the market's momentum. Addressing these issues is crucial for building trust and encouraging further adoption.
Indonesia Contactless Payment Market Trends
One of the prevailing trends is the rising popularity of QR code-based payments. With merchants and consumers both favoring the ease of scanning over traditional card transactions, this method has quickly become a staple in the Indonesian payment ecosystem. Additionally, advancements in NFC technology are enhancing user experiences, allowing for swift, touchless payments.
Another trend is the increasing integration of loyalty programs within contactless payment systems. This not only incentivizes usage but also fosters customer loyalty, creating a win-win for both consumers and businesses.
Indonesia Contactless Payment Market Opportunities
The opportunity for growth in the Indonesia Contactless Payment Market lies in expanding digital payment infrastructure. Investments in technology that enhance transaction security can attract more users. on top of that, tapping into the e-commerce sector presents a lucrative avenue, as more consumers shift towards online shopping and expect convenient payment solutions.
Collaborations between tech startups and established financial institutions can lead to innovative solutions that address current market gaps, driving further adoption. This collaborative approach can also facilitate better consumer education regarding the benefits of contactless payments.
Government Initiatives in the Indonesia Contactless Payment Market
The Indonesian government recognizes the potential of contactless payment systems to boost economic activity and improve financial inclusion. Various initiatives are being implemented to create a conducive environment for digital transactions. This proactive stance includes enhancing digital infrastructure and establishing regulatory frameworks that support secure payment solutions.
- A national digital infrastructure upgrade programme now in its rollout phase aims to improve connectivity across underserved regions.
- A regulatory framework introduced in 2025 mandates billing transparency for digital transactions to increase consumer trust.
- A planned public-private initiative is expected to expand access to contactless payment systems in rural areas by 2028.
- Currently ongoing is a government awareness campaign promoting the benefits of contactless payments among consumers and businesses.
- Recent policies are being evaluated to facilitate partnerships between fintech companies and traditional banks, encouraging innovation in payment solutions.
Future Insights of the Indonesia Contactless Payment Market
Looking ahead, the Indonesia Contactless Payment Market is expected to continue its upward trajectory through 2032. Consumer preferences are likely to shift more towards digital solutions as technology evolves and payment methods become even more convenient. Additionally, ongoing government support and infrastructure improvements will play a critical role in facilitating this growth.
As businesses adapt to changing consumer behaviors, the emphasis on security and user experience will be paramount. The market is set for innovation, with emerging technologies creating new possibilities for contactless transactions.
Indonesia Contactless Payment Market Latest Developments
Recent activity in the Indonesia Contactless Payment Market indicates a dynamic environment, driven by technological advancements and shifting consumer preferences. Over the past year, many businesses have accelerated the adoption of contactless payment methods in response to the growing demand for convenience and safety.
- A major technology vendor launched a new mobile wallet feature in late 2025, enhancing user experience with advanced security measures.
- An initiative that began in mid-2025 and remains underway focuses on integrating contactless payment solutions into public transportation systems.
- In early 2026, a leading regional operator announced a partnership with local merchants to expand QR code payment acceptance across various sectors.
- A rollout expected to begin in Q3 2026 will introduce contactless payment options at key tourist destinations, aiming to enhance the visitor experience.
- Ongoing research efforts are being conducted to assess the impact of contactless payments on small and medium enterprises, with results anticipated by mid-2026.
Indonesia Contactless Payment Market - Key Attractiveness of the Report
- 10 Years of Market Numbers
- Historical Data Starting from 2022 to 2025
- Base Year: 2025
- Forecast Data until 2032
- Key Performance Indicators Impacting the Market
- Major Upcoming Developments and Projects
Key Highlights of the Report:
- Indonesia Contactless Payment Market Outlook
- Market Size of Indonesia Contactless Payment Market, 2025
- Forecast of Indonesia Contactless Payment Market, 2032
- Historical Data and Forecast of Indonesia Contactless Payment Revenues & Volume for the Period 2022-2032F
- Indonesia Contactless Payment Market Trend Evolution
- Indonesia Contactless Payment Market Drivers and Challenges
- Indonesia Contactless Payment Price Trends
- Indonesia Contactless Payment Porter's Five Forces
- Indonesia Contactless Payment Industry Life Cycle
- Historical Data and Forecast of Indonesia Contactless Payment Market Revenues & Volume By Component for the Period 2022-2032F
- Historical Data and Forecast of Indonesia Contactless Payment Market Revenues & Volume By Hardware for the Period 2022-2032F
- Historical Data and Forecast of Indonesia Contactless Payment Market Revenues & Volume By Solutions for the Period 2022-2032F
- Historical Data and Forecast of Indonesia Contactless Payment Market Revenues & Volume By Services for the Period 2022-2032F
- Historical Data and Forecast of Indonesia Contactless Payment Market Revenues & Volume By Vertical for the Period 2022-2032F
- Historical Data and Forecast of Indonesia Contactless Payment Market Revenues & Volume By Retail for the Period 2022-2032F
- Historical Data and Forecast of Indonesia Contactless Payment Market Revenues & Volume By Hospitality for the Period 2022-2032F
- Historical Data and Forecast of Indonesia Contactless Payment Market Revenues & Volume By Healthcare for the Period 2022-2032F
- Historical Data and Forecast of Indonesia Contactless Payment Market Revenues & Volume By Energy and Utilities for the Period 2022-2032F
- Historical Data and Forecast of Indonesia Contactless Payment Market Revenues & Volume By Transportation and Logistics for the Period 2022-2032F
- Historical Data and Forecast of Indonesia Contactless Payment Market Revenues & Volume By BFSI for the Period 2022-2032F
- Historical Data and Forecast of Indonesia Contactless Payment Market Revenues & Volume By Others (Government, telecommunications, and education) for the Period 2022-2032F
- Indonesia Contactless Payment Import Export Trade Statistics
- Market Opportunity Assessment By Component
- Market Opportunity Assessment By Vertical
- Indonesia Contactless Payment Top Companies Market Share
- Indonesia Contactless Payment Competitive Benchmarking By Technical and Operational Parameters
- Indonesia Contactless Payment Company Profiles
- Indonesia Contactless Payment Key Strategic Recommendations






































