Indonesia Cosmetic Antioxidants Market (2026-2032) Outlook | Value, Revenue, Share, Companies, Industry, Forecast, Size, Growth, Trends & Analysis
Market Forecast By Source (Natural, Chemically Derived), By Function (Hair Conditioning, Anti-aging, Anti-inflammatory, UV Protection, Moisturizing, Hair Cleansing, Others), By Type (Vitamin, Carotenoids, Enzymes, Polyphenols, Others), By Application (Skin Care, Hair Care, Make-up) And Competitive Landscape
| Product Code: ETC4475249 | Publication Date: Jul 2023 | Updated Date: Mar 2026 | Product Type: Report | |
| Publisher: 6Wresearch | Author: Ravi Bhandari | No. of Pages: 85 | No. of Figures: 45 | No. of Tables: 25 |
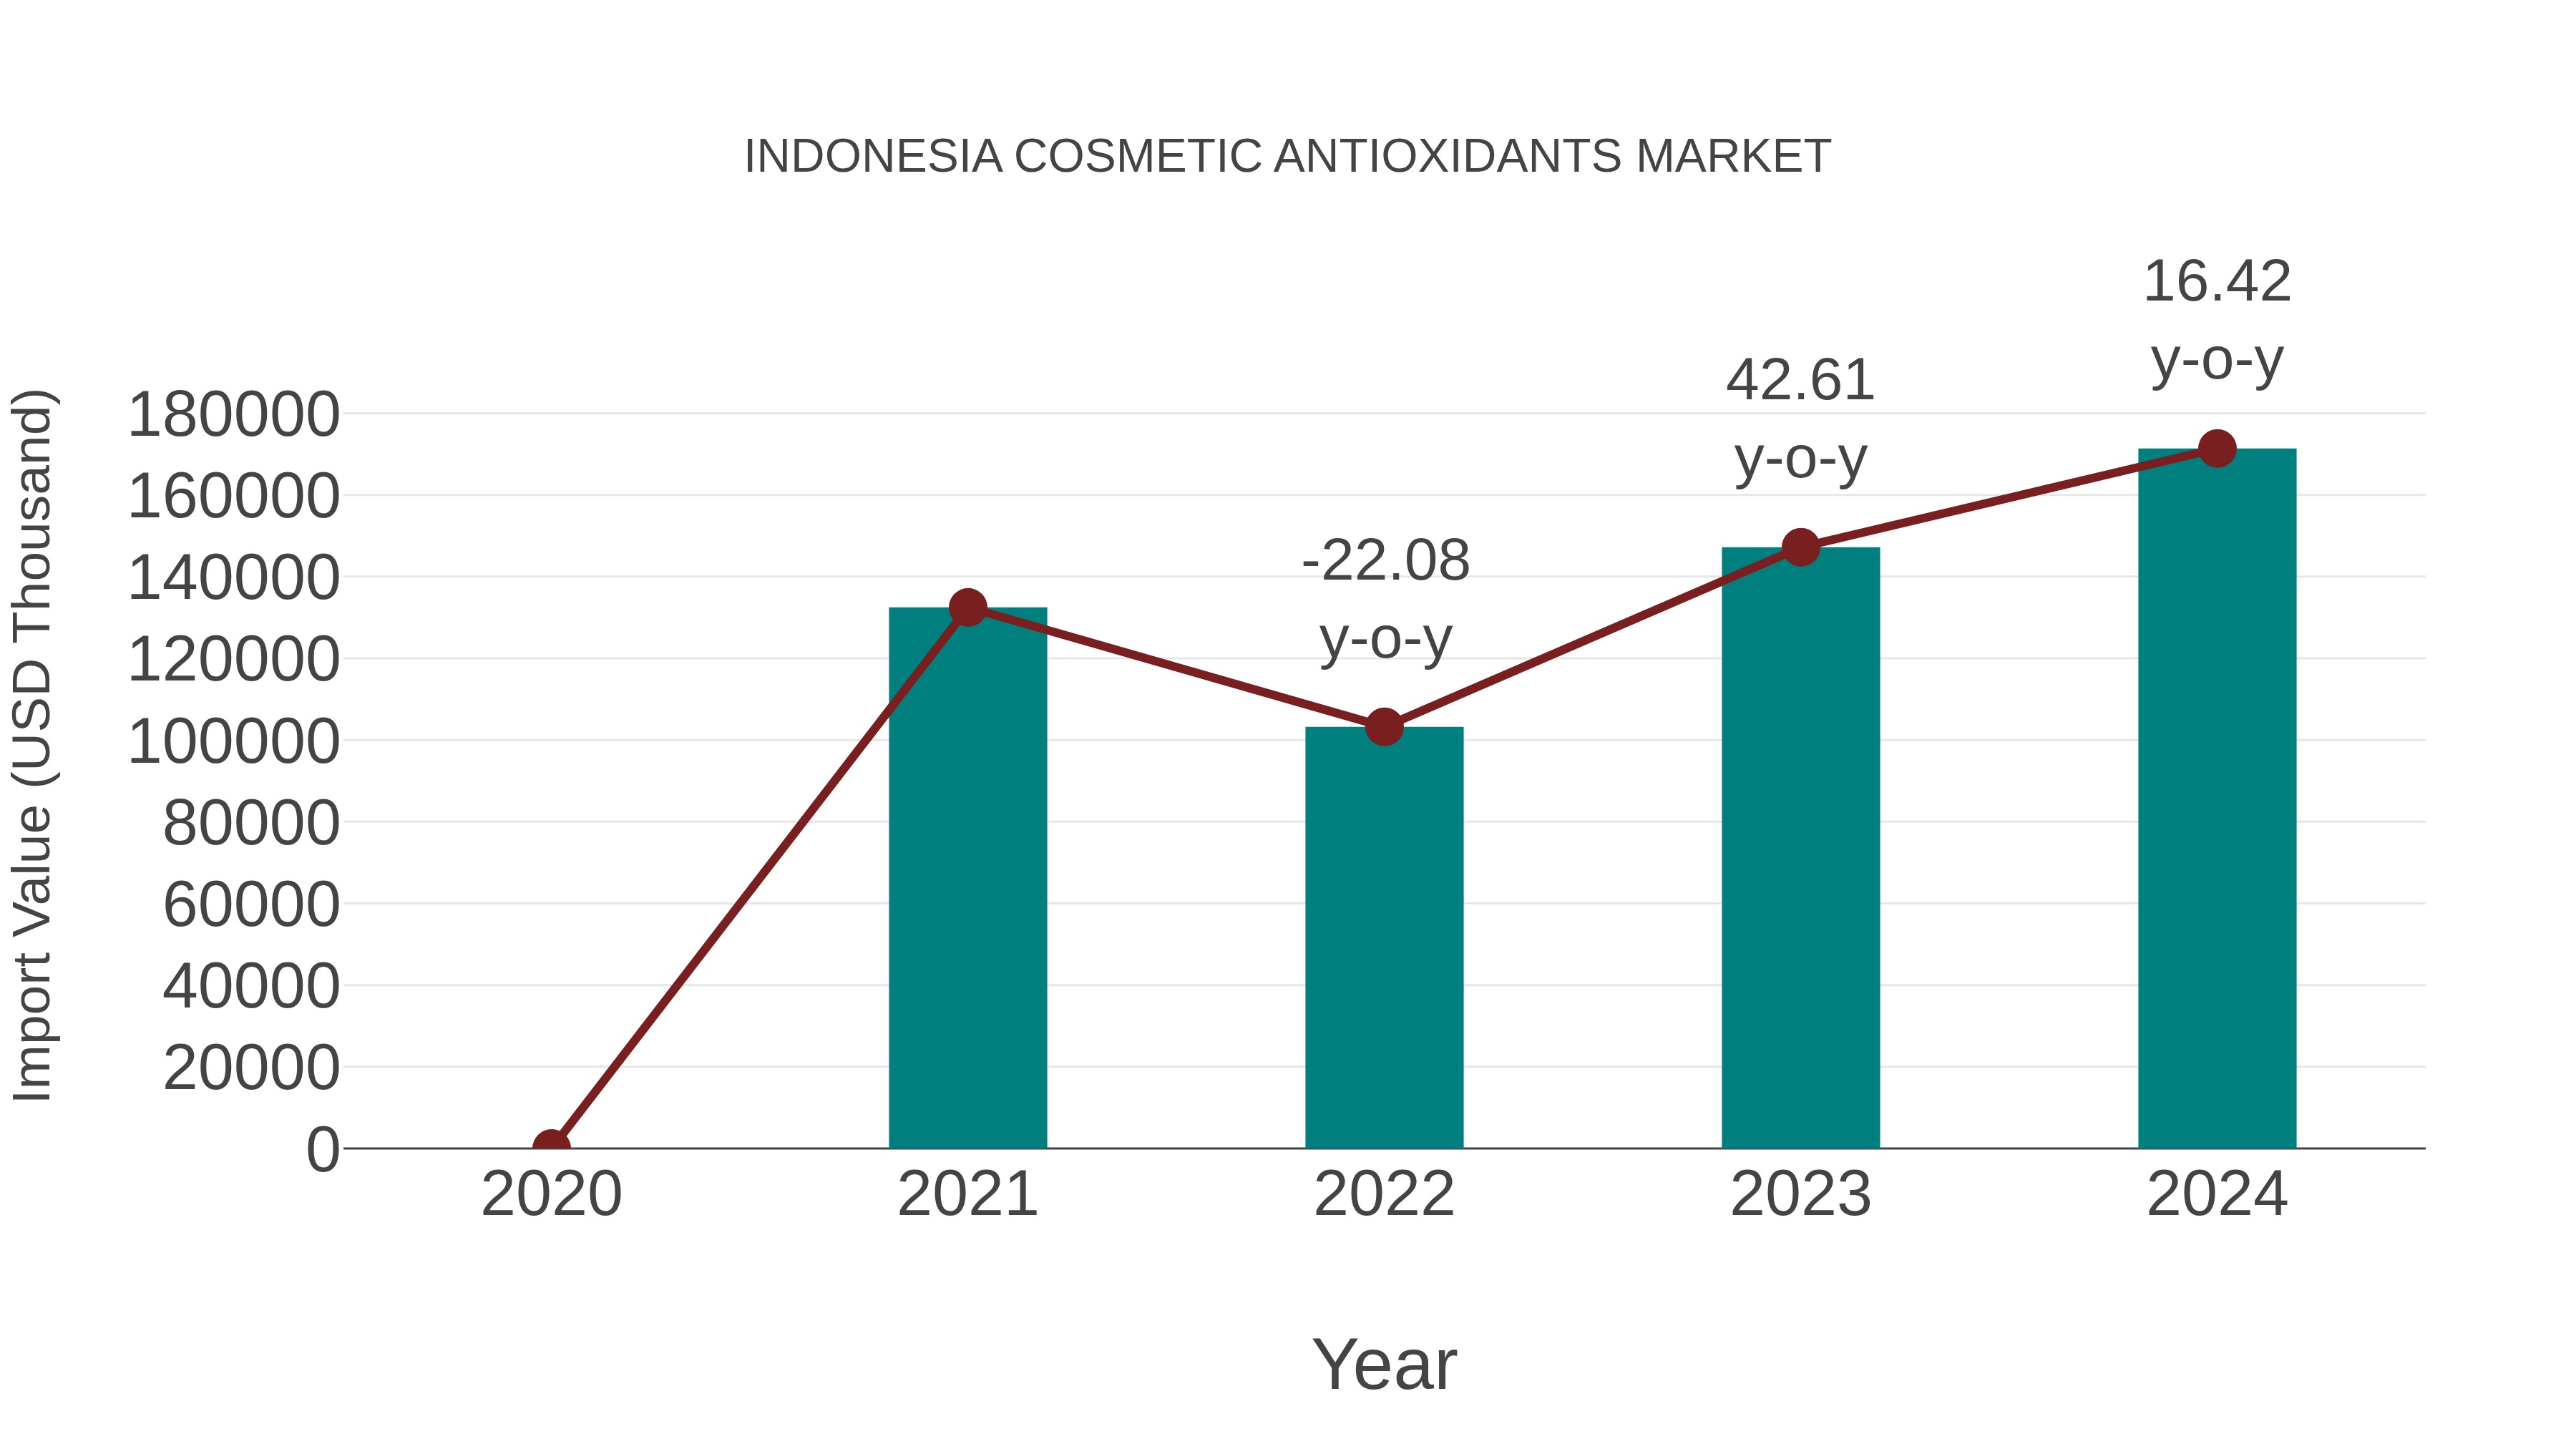
Indonesia Cosmetic Antioxidants Market: Import Trend Analysis
In the Indonesia cosmetic antioxidants market, the import trend showed significant growth from 2023 to 2024, with a growth rate of 16.42%. The compound annual growth rate (CAGR) for imports from 2020 to 2024 stood at 8.96%. This uptrend can be attributed to the increasing consumer demand for cosmetic products with antioxidant properties, reflecting a shift towards wellness-focused beauty products in the market.
Indonesia Cosmetic Antioxidants Market Overview
The cosmetic antioxidants market in Indonesia has shown significant growth due to the increasing awareness regarding skincare and beauty products. Antioxidants play a crucial role in protecting the skin from oxidative damage, making them a key ingredient in cosmetics and personal care products.
Drivers of the Market
The Indonesia cosmetic antioxidants market is influenced by the growing awareness of the importance of antioxidants in skincare and personal care products. Antioxidants are used to protect the skin from oxidative damage and premature aging. As the beauty and personal care industry expands, consumers are looking for products that offer both cosmetic benefits and protection against environmental factors. This trend drives the market for cosmetic antioxidants, which are increasingly incorporated into skincare and beauty products.
Challenges of the Market
A key challenge in the cosmetic antioxidants market in Indonesia is educating consumers about the benefits and necessity of antioxidants in skincare products. Building consumer trust and awareness is crucial for market growth. Additionally, staying updated with the latest scientific research on antioxidants is essential for product innovation.
COVID-19 Impacts on the Market
The cosmetics industry in Indonesia was influenced by the COVID-19 pandemic, leading to fluctuations in the demand for cosmetic antioxidants. As consumers shifted towards self-care and skincare products during lockdowns, there was a surge in demand for antioxidant-rich formulations. However, the market for color cosmetics faced challenges. Cosmetic companies had to adapt to these changing consumer preferences by incorporating antioxidants into their products. As the pandemic subsides, the cosmetic antioxidants market is expected to continue catering to the growing interest in skincare and wellness.
Key Players of the Makret
In the cosmetic antioxidants market, key players include PT. Chisso Polyurethane Indonesia and PT. Xiangyu. They offer antioxidant products that are used in cosmetics and personal care items.
Key Highlights of the Report:
- Indonesia Cosmetic Antioxidants Market Outlook
- Market Size of Indonesia Cosmetic Antioxidants Market, 2025
- Forecast of Indonesia Cosmetic Antioxidants Market, 2032
- Historical Data and Forecast of Indonesia Cosmetic Antioxidants Revenues & Volume for the Period 2022-2032F
- Indonesia Cosmetic Antioxidants Market Trend Evolution
- Indonesia Cosmetic Antioxidants Market Drivers and Challenges
- Indonesia Cosmetic Antioxidants Price Trends
- Indonesia Cosmetic Antioxidants Porter's Five Forces
- Indonesia Cosmetic Antioxidants Industry Life Cycle
- Historical Data and Forecast of Indonesia Cosmetic Antioxidants Market Revenues & Volume By Source for the Period 2022-2032F
- Historical Data and Forecast of Indonesia Cosmetic Antioxidants Market Revenues & Volume By Natural for the Period 2022-2032F
- Historical Data and Forecast of Indonesia Cosmetic Antioxidants Market Revenues & Volume By Chemically Derived for the Period 2022-2032F
- Historical Data and Forecast of Indonesia Cosmetic Antioxidants Market Revenues & Volume By Function for the Period 2022-2032F
- Historical Data and Forecast of Indonesia Cosmetic Antioxidants Market Revenues & Volume By Hair Conditioning for the Period 2022-2032F
- Historical Data and Forecast of Indonesia Cosmetic Antioxidants Market Revenues & Volume By Anti-aging for the Period 2022-2032F
- Historical Data and Forecast of Indonesia Cosmetic Antioxidants Market Revenues & Volume By Anti-inflammatory for the Period 2022-2032F
- Historical Data and Forecast of Indonesia Cosmetic Antioxidants Market Revenues & Volume By UV Protection for the Period 2022-2032F
- Historical Data and Forecast of Indonesia Cosmetic Antioxidants Market Revenues & Volume By Moisturizing for the Period 2022-2032F
- Historical Data and Forecast of Indonesia Cosmetic Antioxidants Market Revenues & Volume By Hair Cleansing for the Period 2022-2032F
- Historical Data and Forecast of Indonesia Cosmetic Antioxidants Market Revenues & Volume By Others for the Period 2022-2032F
- Historical Data and Forecast of Indonesia Cosmetic Antioxidants Market Revenues & Volume By Type for the Period 2022-2032F
- Historical Data and Forecast of Indonesia Cosmetic Antioxidants Market Revenues & Volume By Vitamin for the Period 2022-2032F
- Historical Data and Forecast of Indonesia Cosmetic Antioxidants Market Revenues & Volume By Carotenoids for the Period 2022-2032F
- Historical Data and Forecast of Indonesia Cosmetic Antioxidants Market Revenues & Volume By Enzymes for the Period 2022-2032F
- Historical Data and Forecast of Indonesia Cosmetic Antioxidants Market Revenues & Volume By Polyphenols for the Period 2022-2032F
- Historical Data and Forecast of Indonesia Cosmetic Antioxidants Market Revenues & Volume By Others for the Period 2022-2032F
- Historical Data and Forecast of Indonesia Cosmetic Antioxidants Market Revenues & Volume By Application for the Period 2022-2032F
- Historical Data and Forecast of Indonesia Cosmetic Antioxidants Market Revenues & Volume By Skin Care for the Period 2022-2032F
- Historical Data and Forecast of Indonesia Cosmetic Antioxidants Market Revenues & Volume By Hair Care for the Period 2022-2032F
- Historical Data and Forecast of Indonesia Cosmetic Antioxidants Market Revenues & Volume By Make-up for the Period 2022-2032F
- Indonesia Cosmetic Antioxidants Import Export Trade Statistics
- Market Opportunity Assessment By Source
- Market Opportunity Assessment By Function
- Market Opportunity Assessment By Type
- Market Opportunity Assessment By Application
- Indonesia Cosmetic Antioxidants Top Companies Market Share
- Indonesia Cosmetic Antioxidants Competitive Benchmarking By Technical and Operational Parameters
- Indonesia Cosmetic Antioxidants Company Profiles
- Indonesia Cosmetic Antioxidants Key Strategic Recommendations
Indonesia Cosmetic Antioxidants Market (2026-2032): FAQs
6Wresearch actively monitors the Indonesia Cosmetic Antioxidants Market and publishes its comprehensive annual report, highlighting emerging trends, growth drivers, revenue analysis, and forecast outlook. Our insights help businesses to make data-backed strategic decisions with ongoing market dynamics. Our analysts track relevent industries related to the Indonesia Cosmetic Antioxidants Market, allowing our clients with actionable intelligence and reliable forecasts tailored to emerging regional needs.
Yes, we provide customisation as per your requirements. To learn more, feel free to contact us on sales@6wresearch.com
1 Executive Summary |
2 Introduction |
2.1 Key Highlights of the Report |
2.2 Report Description |
2.3 Market Scope & Segmentation |
2.4 Research Methodology |
2.5 Assumptions |
3 Indonesia Cosmetic Antioxidants Market Overview |
3.1 Indonesia Country Macro Economic Indicators |
3.2 Indonesia Cosmetic Antioxidants Market Revenues & Volume, 2022 & 2032F |
3.3 Indonesia Cosmetic Antioxidants Market - Industry Life Cycle |
3.4 Indonesia Cosmetic Antioxidants Market - Porter's Five Forces |
3.5 Indonesia Cosmetic Antioxidants Market Revenues & Volume Share, By Source, 2022 & 2032F |
3.6 Indonesia Cosmetic Antioxidants Market Revenues & Volume Share, By Function, 2022 & 2032F |
3.7 Indonesia Cosmetic Antioxidants Market Revenues & Volume Share, By Type, 2022 & 2032F |
3.8 Indonesia Cosmetic Antioxidants Market Revenues & Volume Share, By Application, 2022 & 2032F |
4 Indonesia Cosmetic Antioxidants Market Dynamics |
4.1 Impact Analysis |
4.2 Market Drivers |
4.2.1 Increasing consumer awareness about the benefits of using antioxidants in cosmetics |
4.2.2 Growing demand for natural and organic cosmetic products in Indonesia |
4.2.3 Rise in disposable income leading to higher spending on premium cosmetic products |
4.3 Market Restraints |
4.3.1 Stringent regulations and certifications required for using antioxidants in cosmetics |
4.3.2 Limited availability of high-quality raw materials for producing cosmetic antioxidants in Indonesia |
5 Indonesia Cosmetic Antioxidants Market Trends |
6 Indonesia Cosmetic Antioxidants Market, By Types |
6.1 Indonesia Cosmetic Antioxidants Market, By Source |
6.1.1 Overview and Analysis |
6.1.2 Indonesia Cosmetic Antioxidants Market Revenues & Volume, By Source, 2022-2032F |
6.1.3 Indonesia Cosmetic Antioxidants Market Revenues & Volume, By Natural, 2022-2032F |
6.1.4 Indonesia Cosmetic Antioxidants Market Revenues & Volume, By Chemically Derived, 2022-2032F |
6.2 Indonesia Cosmetic Antioxidants Market, By Function |
6.2.1 Overview and Analysis |
6.2.2 Indonesia Cosmetic Antioxidants Market Revenues & Volume, By Hair Conditioning, 2022-2032F |
6.2.3 Indonesia Cosmetic Antioxidants Market Revenues & Volume, By Anti-aging, 2022-2032F |
6.2.4 Indonesia Cosmetic Antioxidants Market Revenues & Volume, By Anti-inflammatory, 2022-2032F |
6.2.5 Indonesia Cosmetic Antioxidants Market Revenues & Volume, By UV Protection, 2022-2032F |
6.2.6 Indonesia Cosmetic Antioxidants Market Revenues & Volume, By Moisturizing, 2022-2032F |
6.2.7 Indonesia Cosmetic Antioxidants Market Revenues & Volume, By Hair Cleansing, 2022-2032F |
6.3 Indonesia Cosmetic Antioxidants Market, By Type |
6.3.1 Overview and Analysis |
6.3.2 Indonesia Cosmetic Antioxidants Market Revenues & Volume, By Vitamin, 2022-2032F |
6.3.3 Indonesia Cosmetic Antioxidants Market Revenues & Volume, By Carotenoids, 2022-2032F |
6.3.4 Indonesia Cosmetic Antioxidants Market Revenues & Volume, By Enzymes, 2022-2032F |
6.3.5 Indonesia Cosmetic Antioxidants Market Revenues & Volume, By Polyphenols, 2022-2032F |
6.3.6 Indonesia Cosmetic Antioxidants Market Revenues & Volume, By Others, 2022-2032F |
6.4 Indonesia Cosmetic Antioxidants Market, By Application |
6.4.1 Overview and Analysis |
6.4.2 Indonesia Cosmetic Antioxidants Market Revenues & Volume, By Skin Care, 2022-2032F |
6.4.3 Indonesia Cosmetic Antioxidants Market Revenues & Volume, By Hair Care, 2022-2032F |
6.4.4 Indonesia Cosmetic Antioxidants Market Revenues & Volume, By Make-up, 2022-2032F |
7 Indonesia Cosmetic Antioxidants Market Import-Export Trade Statistics |
7.1 Indonesia Cosmetic Antioxidants Market Export to Major Countries |
7.2 Indonesia Cosmetic Antioxidants Market Imports from Major Countries |
8 Indonesia Cosmetic Antioxidants Market Key Performance Indicators |
8.1 Percentage increase in the use of antioxidants in new cosmetic product formulations |
8.2 Number of new product launches featuring antioxidants in the Indonesian cosmetic market |
8.3 Growth in the number of partnerships between cosmetic companies and antioxidant suppliers |
9 Indonesia Cosmetic Antioxidants Market - Opportunity Assessment |
9.1 Indonesia Cosmetic Antioxidants Market Opportunity Assessment, By Source, 2022 & 2032F |
9.2 Indonesia Cosmetic Antioxidants Market Opportunity Assessment, By Function, 2022 & 2032F |
9.3 Indonesia Cosmetic Antioxidants Market Opportunity Assessment, By Type, 2022 & 2032F |
9.4 Indonesia Cosmetic Antioxidants Market Opportunity Assessment, By Application, 2022 & 2032F |
10 Indonesia Cosmetic Antioxidants Market - Competitive Landscape |
10.1 Indonesia Cosmetic Antioxidants Market Revenue Share, By Companies, 2025 |
10.2 Indonesia Cosmetic Antioxidants Market Competitive Benchmarking, By Operating and Technical Parameters |
11 Company Profiles |
12 Recommendations |
13 Disclaimer |
Global Go To Market Strategy - 2030
Export potential enables firms to identify high-growth global markets with greater confidence by combining advanced trade intelligence with a structured quantitative methodology. The framework analyzes emerging demand trends and country-level import patterns while integrating macroeconomic and trade datasets such as GDP and population forecasts, bilateral import–export flows, tariff structures, elasticity differentials between developed and developing economies, geographic distance, and import demand projections. Using weighted trade values from 2020–2024 as the base period to project country-to-country export potential for 2030, these inputs are operationalized through calculated drivers such as gravity model parameters, tariff impact factors, and projected GDP per-capita growth. Through an analysis of hidden potentials, demand hotspots, and market conditions that are most favorable to success, this method enables firms to focus on target countries, maximize returns, and global expansion with data, backed by accuracy.
By factoring in the projected importer demand gap that is currently unmet and could be potential opportunity, it identifies the potential for the Exporter (Country) among 190 countries, against the general trade analysis, which identifies the biggest importer or exporter.
To discover high-growth global markets and optimize your business strategy:
Click Here
Pricing
- Single User License$ 1,995
- Department License$ 2,400
- Site License$ 3,120
- Global License$ 3,795

Leadership Perspectives from Industry Events
Search
Thought Leadership and Analyst Meet


Our Clients
6WResearch In News
- Doha a strategic location for EV manufacturing hub: IPA Qatar
- Demand for luxury TVs surging in the GCC, says Samsung
- Empowering Growth: The Thriving Journey of Bangladesh’s Cable Industry
- Demand for luxury TVs surging in the GCC, says Samsung
- Video call with a traditional healer? Once unthinkable, it’s now common in South Africa
- Intelligent Buildings To Smooth GCC’s Path To Net Zero
Latest Reports
- New Zealand Aseptic Manufacturing Market (2026-2032)
- Netherlands Aseptic Manufacturing Market (2026-2032)
- Nauru Aseptic Manufacturing Market (2026-2032)
- Namibia Aseptic Manufacturing Market (2026-2032)
- Mozambique Aseptic Manufacturing Market (2026-2032)
- Montenegro Aseptic Manufacturing Market (2026-2032)
- Mongolia Aseptic Manufacturing Market (2026-2032)
- Monaco Aseptic Manufacturing Market (2026-2032)
- Micronesia Aseptic Manufacturing Market (2026-2032)
- Mauritius Aseptic Manufacturing Market (2026-2032)
Industry Events and Analyst Meet

HIMTEX 2026

India Refining Summit 2026

India EV Show 2026

EV tech India Expo 2026

Auto Tech Asia 2026
Whitepaper
- Middle East & Africa Commercial Security Market Click here to view more.
- Middle East & Africa Fire Safety Systems & Equipment Market Click here to view more.
- GCC Drone Market Click here to view more.
- Middle East Lighting Fixture Market Click here to view more.
- GCC Physical & Perimeter Security Market Click here to view more.