Indonesia Dairy products Market (2024-2030) | Industry, Value, Size, Companies, Growth, Trends, Outlook, Revenue, Forecast, Share & Analysis
Market Forecast By Product Type (Butter , Cheese, Milk, Cream, Yoghurt, Buttermilk, Ice Cream , Lactose-Free Dairy Products), By Distribution Channel (Supermarkets & Hypermarkets, Convenience Store, Online) And Competitive Landscape
| Product Code: ETC017988 | Publication Date: Jul 2023 | Updated Date: Jan 2026 | Product Type: Report | |
| Publisher: 6Wresearch | Author: Ravi Bhandari | No. of Pages: 70 | No. of Figures: 35 | No. of Tables: 5 |
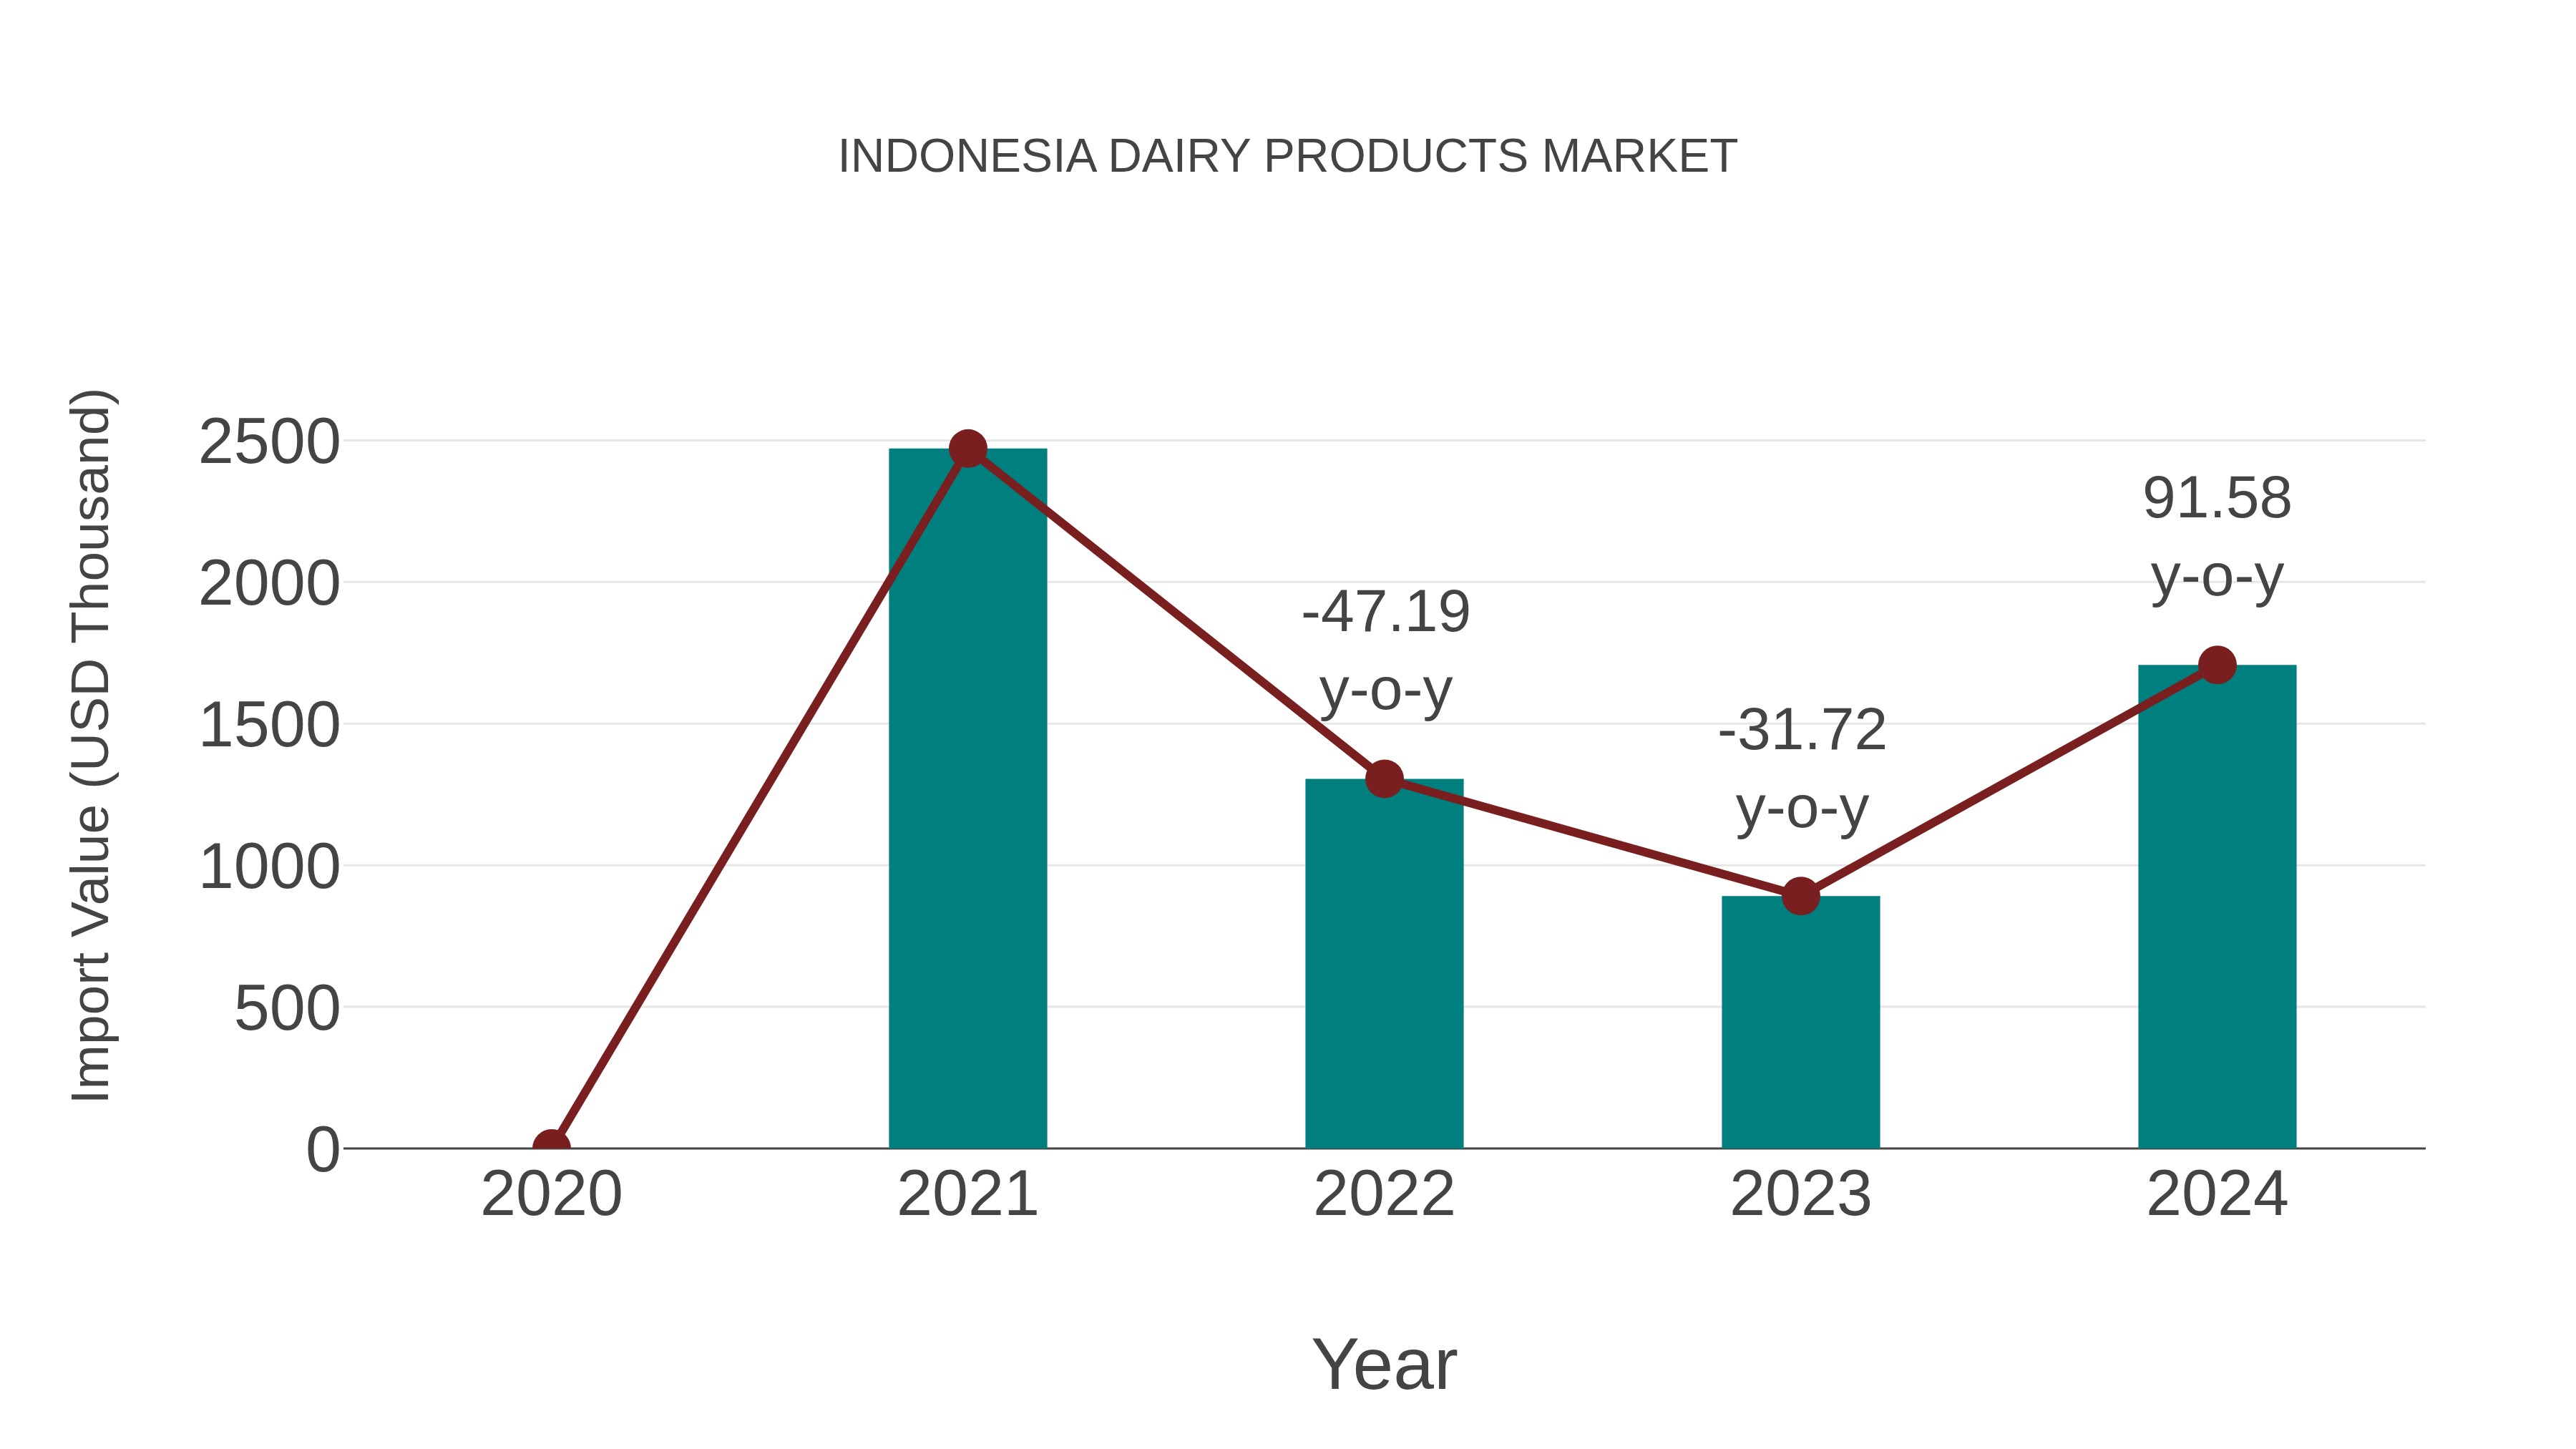
Indonesia Dairy Products Market: Import Trend Analysis
In the Indonesia dairy products market, the import trend showed a significant growth rate of 91.58% from 2023 to 2024, while the compound annual growth rate (CAGR) for 2020-2024 was -11.6%. This notable import momentum can be attributed to shifting consumer preferences towards dairy products, indicating a potential market recovery post-2020 disruptions.
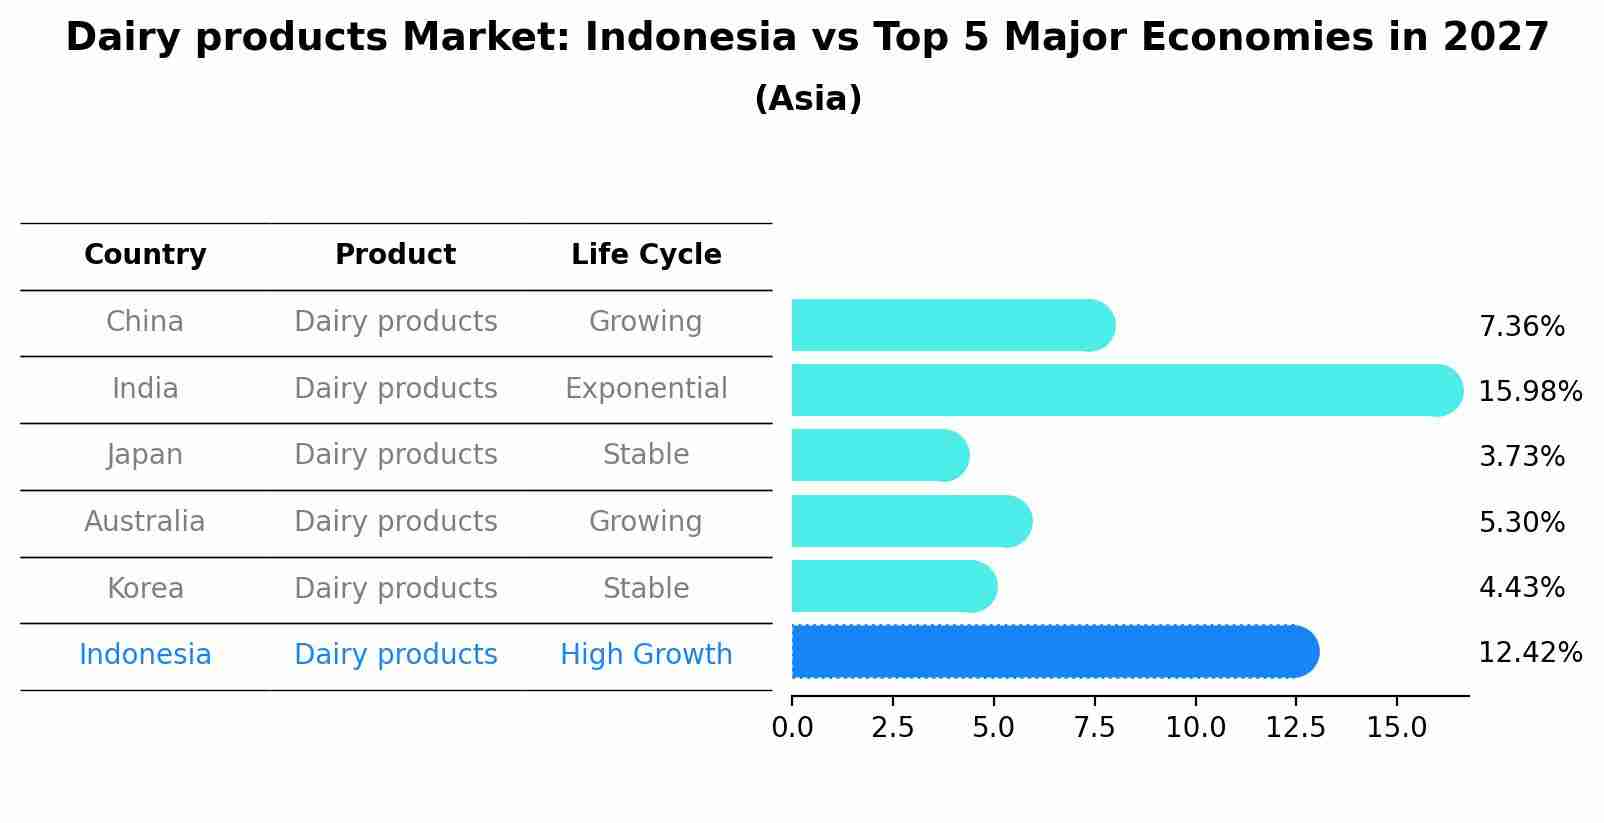
Dairy products Market: Indonesia vs Top 5 Major Economies in 2027 (Asia)
In the Asia region, the Dairy products market in Indonesia is projected to expand at a high growth rate of 12.42% by 2027. The largest economy is China, followed by India, Japan, Australia and South Korea.
Indonesia Dairy products Market Synopsis
Indonesia dairy products market is expected to witness a CAGR of 4.6% during theperiod (2020-2026) owing to increasing population and high demand for healthy food options in the country. Increasing awareness regarding health benefits associated with milk and other dairy products are also fuelling theof Indonesia`s dairy product market. The rising trend of using organic ingredients as well as increasing consumption of convenience foods containing cheese butter yogurt and others are further driving theof this sector in Indonesia.
Drivers
1) Increasing Population: With an estimated 271 million people living in 2020 Indonesia population has increased significantly over recent years which has consequentially resulted in higher demand for food items like diary products such as cheese milk etc due to its nutritional . 2) Rising Health Consciousness: There is an increase among consumers looking for healthier alternatives when it comes to their dietary choices; leading them towards consuming dairy products that provide essential nutrients such as calcium and proteins which contribute greatly towards a balanced diet.This factor has been fueling up sales within the Dairy Products Market in Indonesia over recent years and is projected to continue doing so during theperiod too because it?s one of few markets where major players can still experienceby capitalizing on consumer needs rather than price wars or competition from substitutes goods/services. 3) Increase In Demand For Convenience Foods: Along with being more health conscious there is also an increased preference amongst consumers opting for convenient foods such as cheese spread sandwichespre-packed yogurt drinks etc instead of traditional meals; thus providing ample opportunities for major producers within Dairy Product Markets to capitalize upon emerging customer demands.
Market Players
1) PT Sarihusada Generasi Mahardhika (SGM): It holds nearly 22 percentin Indonesia Dairy Products Market making it a leader amongst local brands; offering various types Milk Yogurt DrinksCheese SpreadsUHT Milk Powder Pasteurized Liquid Milk across all retail outlets including supermarkets hypermarkets throughout nation. 2) Nestle Indonesia Tbk PT : Another notable player operating within Indonesias Dairy Product Market ; they offer wide range selection including UHT MilksFruit JuicesYoghurts Cream Cheese Spreads mainly targeting mass consumer segments through both online offline channels around nation . 3) Frisian Flag Indoneisa PT : Holding near 14 percent.
Key Highlights of the Report:
- Indonesia Dairy products Market Outlook
- Market Size of Indonesia Dairy products Market, 2023
- Forecast of Indonesia Dairy products Market, 2030
- Historical Data and Forecast of Indonesia Dairy products Revenues & Volume for the Period 2020-2030
- Indonesia Dairy products Market Trend Evolution
- Indonesia Dairy products Market Drivers and Challenges
- Indonesia Dairy products Price Trends
- Indonesia Dairy products Porter's Five Forces
- Indonesia Dairy products Industry Life Cycle
- Historical Data and Forecast of Indonesia Dairy products Market Revenues & Volume By Product Type for the Period 2020-2030
- Historical Data and Forecast of Indonesia Dairy products Market Revenues & Volume By Butter for the Period 2020-2030
- Historical Data and Forecast of Indonesia Dairy products Market Revenues & Volume By Cheese for the Period 2020-2030
- Historical Data and Forecast of Indonesia Dairy products Market Revenues & Volume By Milk for the Period 2020-2030
- Historical Data and Forecast of Indonesia Dairy products Market Revenues & Volume By Cream for the Period 2020-2030
- Historical Data and Forecast of Indonesia Dairy products Market Revenues & Volume By Yoghurt for the Period 2020-2030
- Historical Data and Forecast of Indonesia Dairy products Market Revenues & Volume By Buttermilk for the Period 2020-2030
- Historical Data and Forecast of Indonesia Dairy products Market Revenues & Volume By Ice Cream for the Period 2020-2030
- Historical Data and Forecast of Indonesia Butter Dairy products Market Revenues & Volume By Lactose-Free Dairy Products for the Period 2020-2030
- Historical Data and Forecast of Indonesia Dairy products Market Revenues & Volume By Distribution Channel for the Period 2020-2030
- Historical Data and Forecast of Indonesia Dairy products Market Revenues & Volume By Supermarkets & Hypermarkets for the Period 2020-2030
- Historical Data and Forecast of Indonesia Dairy products Market Revenues & Volume By Convenience Store for the Period 2020-2030
- Historical Data and Forecast of Indonesia Dairy products Market Revenues & Volume By Online for the Period 2020-2030
- Indonesia Dairy products Import Export Trade Statistics
- Market Opportunity Assessment By Product Type
- Market Opportunity Assessment By Distribution Channel
- Indonesia Dairy products Top Companies Market Share
- Indonesia Dairy products Competitive Benchmarking By Technical and Operational Parameters
- Indonesia Dairy products Company Profiles
- Indonesia Dairy products Key Strategic Recommendations
Frequently Asked Questions About the Market Study (FAQs):
6Wresearch actively monitors the Indonesia Dairy products Market and publishes its comprehensive annual report, highlighting emerging trends, growth drivers, revenue analysis, and forecast outlook. Our insights help businesses to make data-backed strategic decisions with ongoing market dynamics. Our analysts track relevent industries related to the Indonesia Dairy products Market, allowing our clients with actionable intelligence and reliable forecasts tailored to emerging regional needs.
Yes, we provide customisation as per your requirements. To learn more, feel free to contact us on sales@6wresearch.com
1 Executive Summary |
2 Introduction |
2.1 Key Highlights of the Report |
2.2 Report Description |
2.3 Market Scope & Segmentation |
2.4 Research Methodology |
2.5 Assumptions |
3 Indonesia Dairy products Market Overview |
3.1 Indonesia Country Macro Economic Indicators |
3.2 Indonesia Dairy products Market Revenues & Volume, 2020 & 2030F |
3.3 Indonesia Dairy products Market - Industry Life Cycle |
3.4 Indonesia Dairy products Market - Porter's Five Forces |
3.5 Indonesia Dairy products Market Revenues & Volume Share, By Product Type, 2020 & 2030F |
3.6 Indonesia Dairy products Market Revenues & Volume Share, By Distribution Channel, 2020 & 2030F |
4 Indonesia Dairy products Market Dynamics |
4.1 Impact Analysis |
4.2 Market Drivers |
4.2.1 Increasing consumer awareness about the health benefits of dairy products |
4.2.2 Growth in disposable income leading to higher spending on premium dairy products |
4.2.3 Expansion of retail channels and online platforms increasing accessibility to dairy products in Indonesia |
4.3 Market Restraints |
4.3.1 Seasonal variations affecting milk production and supply chain |
4.3.2 High competition from alternative plant-based dairy products |
4.3.3 Fluctuating prices of raw materials impacting production costs |
5 Indonesia Dairy products Market Trends |
6 Indonesia Dairy products Market, By Types |
6.1 Indonesia Dairy products Market, By Product Type |
6.1.1 Overview and Analysis |
6.1.2 Indonesia Dairy products Market Revenues & Volume, By Product Type, 2020-2030F |
6.1.3 Indonesia Dairy products Market Revenues & Volume, By Butter , 2020-2030F |
6.1.4 Indonesia Dairy products Market Revenues & Volume, By Cheese, 2020-2030F |
6.1.5 Indonesia Dairy products Market Revenues & Volume, By Milk, 2020-2030F |
6.1.6 Indonesia Dairy products Market Revenues & Volume, By Cream, 2020-2030F |
6.1.7 Indonesia Dairy products Market Revenues & Volume, By Yoghurt, 2020-2030F |
6.1.8 Indonesia Dairy products Market Revenues & Volume, By Buttermilk, 2020-2030F |
6.1.9 Indonesia Dairy products Market Revenues & Volume, By Lactose-Free Dairy Products, 2020-2030F |
6.1.10 Indonesia Dairy products Market Revenues & Volume, By Lactose-Free Dairy Products, 2020-2030F |
6.2 Indonesia Dairy products Market, By Distribution Channel |
6.2.1 Overview and Analysis |
6.2.2 Indonesia Dairy products Market Revenues & Volume, By Supermarkets & Hypermarkets, 2020-2030F |
6.2.3 Indonesia Dairy products Market Revenues & Volume, By Convenience Store, 2020-2030F |
6.2.4 Indonesia Dairy products Market Revenues & Volume, By Online, 2020-2030F |
7 Indonesia Dairy products Market Import-Export Trade Statistics |
7.1 Indonesia Dairy products Market Export to Major Countries |
7.2 Indonesia Dairy products Market Imports from Major Countries |
8 Indonesia Dairy products Market Key Performance Indicators |
8.1 Percentage growth in per capita consumption of dairy products |
8.2 Number of new product launches and innovations in the dairy market |
8.3 Percentage growth in the number of dairy product outlets and distribution channels |
8.4 Adoption rate of dairy product consumption among different age groups and demographics |
8.5 Investment in research and development for dairy product quality and sustainability |
9 Indonesia Dairy products Market - Opportunity Assessment |
9.1 Indonesia Dairy products Market Opportunity Assessment, By Product Type, 2020 & 2030F |
9.2 Indonesia Dairy products Market Opportunity Assessment, By Distribution Channel, 2020 & 2030F |
10 Indonesia Dairy products Market - Competitive Landscape |
10.1 Indonesia Dairy products Market Revenue Share, By Companies, 2023 |
10.2 Indonesia Dairy products Market Competitive Benchmarking, By Operating and Technical Parameters |
11 Company Profiles |
12 Recommendations |
13 Disclaimer |
Global Go To Market Strategy - 2030
Export potential enables firms to identify high-growth global markets with greater confidence by combining advanced trade intelligence with a structured quantitative methodology. The framework analyzes emerging demand trends and country-level import patterns while integrating macroeconomic and trade datasets such as GDP and population forecasts, bilateral import–export flows, tariff structures, elasticity differentials between developed and developing economies, geographic distance, and import demand projections. Using weighted trade values from 2020–2024 as the base period to project country-to-country export potential for 2030, these inputs are operationalized through calculated drivers such as gravity model parameters, tariff impact factors, and projected GDP per-capita growth. Through an analysis of hidden potentials, demand hotspots, and market conditions that are most favorable to success, this method enables firms to focus on target countries, maximize returns, and global expansion with data, backed by accuracy.
By factoring in the projected importer demand gap that is currently unmet and could be potential opportunity, it identifies the potential for the Exporter (Country) among 190 countries, against the general trade analysis, which identifies the biggest importer or exporter.
To discover high-growth global markets and optimize your business strategy:
Click Here
Pricing
- Single User License$ 1,995
- Department License$ 2,400
- Site License$ 3,120
- Global License$ 3,795

Leadership Perspectives from Industry Events
Search
Thought Leadership and Analyst Meet


Our Clients
6WResearch In News
- Smartphones Lead India's Exports potential at $94 Billion by 2031 — But $30.1 Billion in Untapped Markets Is the Real Story
- India Air Conditioner Market Set for Strong Rebound in 2026 After Weather-Led Correction and GST-Driven Recovery: 6Wresearch
- ADAS in India: How Automatic Emergency Braking, Blind Spot Detection & Driver Monitoring are Transforming Road Safety
- Doha a strategic location for EV manufacturing hub: IPA Qatar
- Demand for luxury TVs surging in the GCC, says Samsung
- Empowering Growth: The Thriving Journey of Bangladesh’s Cable Industry
Latest Reports
- Gabon Citrullinemia Type-1 Market (2026-2032)
- Finland Citrullinemia Type-1 Market (2026-2032)
- Fiji Citrullinemia Type-1 Market (2026-2032)
- Ethiopia Citrullinemia Type-1 Market (2026-2032)
- Estonia Citrullinemia Type-1 Market (2026-2032)
- Eritrea Citrullinemia Type-1 Market (2026-2032)
- Equatorial Guinea Citrullinemia Type-1 Market (2026-2032)
- El Salvador Citrullinemia Type-1 Market (2026-2032)
- Ecuador Citrullinemia Type-1 Market (2026-2032)
- Dominica Citrullinemia Type-1 Market (2026-2032)
Industry Events and Analyst Meet

EV India Expo 2026

HIMTEX 2026

India Refining Summit 2026

India EV Show 2026

EV tech India Expo 2026
Whitepaper
- Middle East & Africa Commercial Security Market Click here to view more.
- Middle East & Africa Fire Safety Systems & Equipment Market Click here to view more.
- GCC Drone Market Click here to view more.
- Middle East Lighting Fixture Market Click here to view more.
- GCC Physical & Perimeter Security Market Click here to view more.