Indonesia Desktop Virtualization Market (2026-2032) Outlook | Companies, Trends, Forecast, Value, Analysis, Revenue, Size, Growth, Share & Industry
Market Forecast By Desktop Delivery Platform (Hosted Virtual Desktop (HVD), Hosted Shared Desktop (HSD), Other Desktop Delivery Platforms), By Deployment Mode (On-premise, Cloud-Based), By End-users (Financial Services, Healthcare, Manufacturing, IT and Telecommunications, Other End-user Verticals) And Competitive Landscape
| Product Code: ETC072587 | Publication Date: Jul 2023 | Updated Date: Jun 2026 | Product Type: Report | |
| Publisher: 6Wresearch | Author: Ravi Bhandari | No. of Pages: 70 | No. of Figures: 35 | No. of Tables: 5 |
Indonesia Desktop Virtualization Market Size, Share & Growth Rate
The Indonesia Desktop Virtualization Market was estimated at USD 222 Million in 2025 and is projected to reach USD 293 Million by 2032, growing at a CAGR of 4.0% from 2026 to 2032. This growth is driven largely by the increasing demand for flexible work arrangements, which have been accelerated by the global pandemic. Additionally, businesses are recognizing the cost efficiency and enhanced security offered by desktop virtualization solutions, fueling investments in this technology across diverse industries.
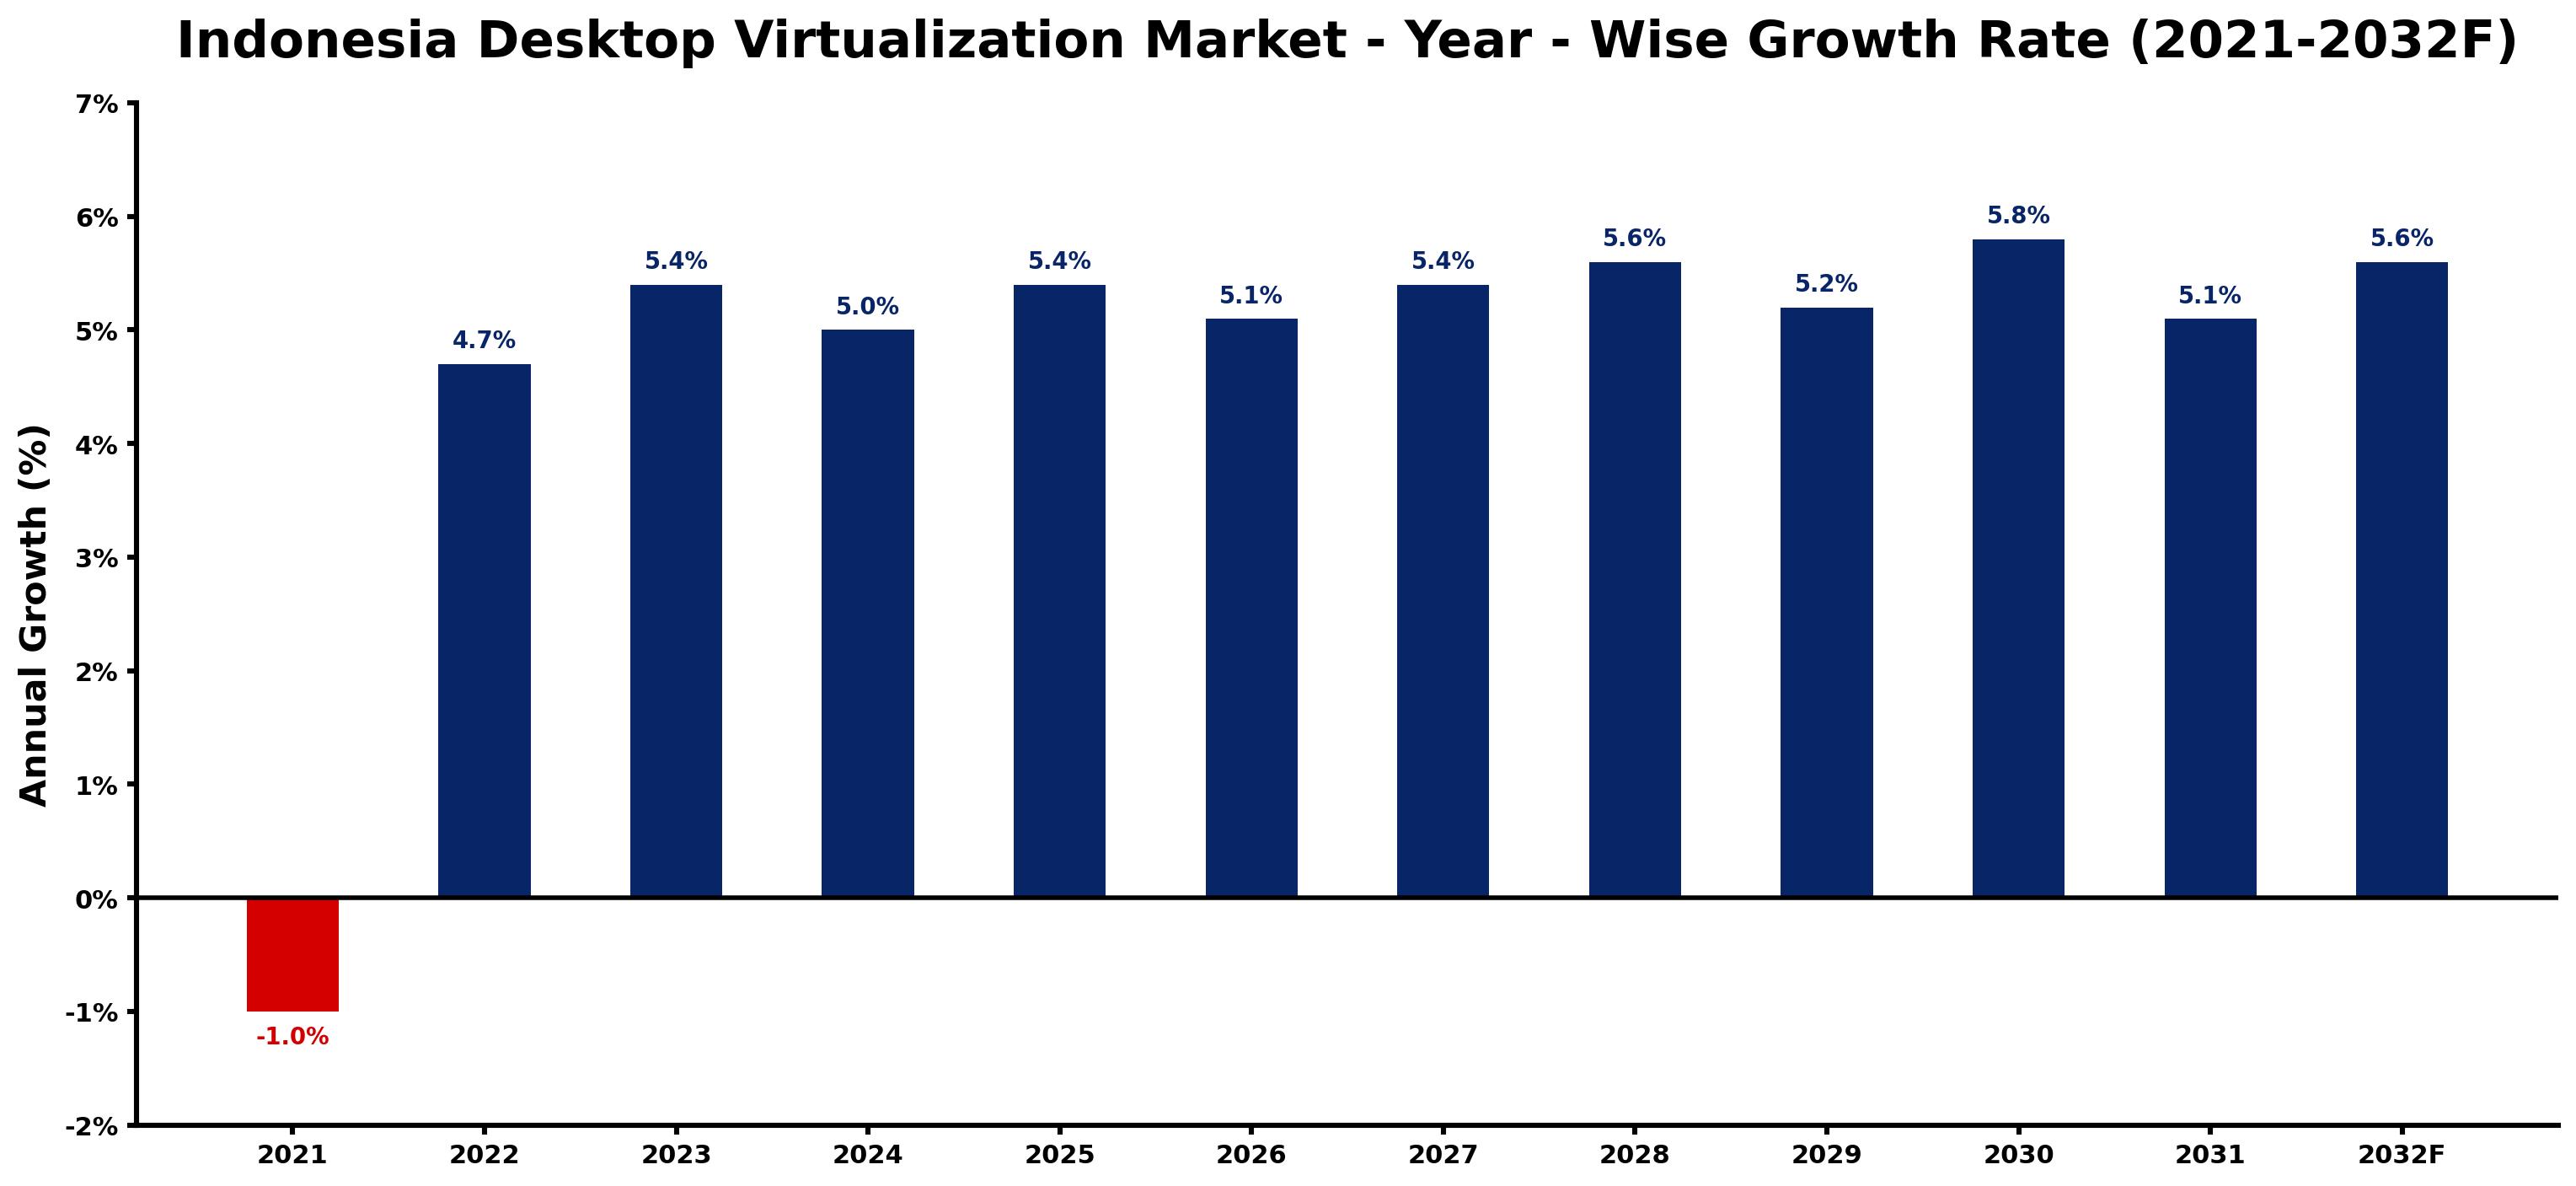
Indonesia Desktop Virtualization Market Growth Rate Analysis (2021-2032)
The Indonesia Desktop Virtualization Market has shown a notable recovery since 2021, when it experienced a decline of 1.0%. This shift towards growth began in 2022 with a 4.7% increase, driven primarily by the surge in digital transformation initiatives across various sectors. The market is expected to maintain a steady upward trend, with projected growth rates of 5.4% in 2023 and 5.0% in 2024. Factors such as improved infrastructure, escalating consumer demand for remote work solutions, and an overarching shift towards energy-efficient technologies are propelling this growth. By 2032, a 5.6% growth is anticipated, indicating a robust orientation towards innovative virtualization solutions in Indonesia.
Indonesia Desktop Virtualization Market Year-wise Growth Rate and Key Drivers
This graph highlights how the Indonesia Desktop Virtualization Market has steadily grown over the past five years, supported by major growth factors.
The table below presents the year‑wise growth rates along with the key drivers influencing the market
| Year | Growth Rate | Major Drivers |
| 2021 | -1.0% | Increasing adoption of advanced technologies |
| 2022 | 4.7% | Increasing industrial automation investments |
| 2023 | 5.4% | Increasing adoption of advanced technologies |
| 2024 | 5.0% | Increasing industrial infrastructure investments |
| 2025 | 5.4% | Expansion of commercial construction activities |
| 2026 | 5.1% | Expansion of commercial construction activities |
| 2027 | 5.4% | Increasing adoption of advanced technologies |
| 2028 | 5.6% | Increasing adoption of advanced technologies |
| 2029 | 5.2% | Increasing industrial automation investments |
| 2030 | 5.8% | Growing renewable energy integration projects |
| 2031 | 5.1% | Expansion of transportation and logistics networks |
| 2032 | 5.6% | Increasing smart city development projects |
Note - Market size estimations and growth projections presented in this report are based on 6Wresearch’s advanced forecasting approach, validated with industry datasets as of June 2026.
Indonesia Desktop Virtualization Market Synopsis
The most significant force shaping the Indonesia Desktop Virtualization Market is the rising necessity for operational efficiency in the wake of an increasingly remote workforce. Organizations across various sectors are leveraging desktop virtualization to streamline their operations while providing employees with seamless access to applications and data from anywhere.
Moreover, the emphasis on cybersecurity in Indonesia has prompted companies to adopt desktop virtualization solutions that allow for centralized data management and enhanced security measures. By ensuring that sensitive information remains within secure networks, organizations can better protect themselves against external threats while minimizing the risks associated with data breaches.
Indonesia Desktop Virtualization Market Key Takeaways
- The market is set for robust growth, driven by the need for cost-effective and secure IT solutions.
- Increased adoption among remote workers highlights a shift towards more flexible work environments.
- Security remains a top priority, propelling investment in desktop virtualization technology.
- Companies are attracted to the operational efficiencies associated with centralized data management.
- Legacy application compatibility is a consideration in implementing virtualization solutions.
Evaluation of Restraints in Indonesia Desktop Virtualization Market
While the potential for cost savings and operational efficiency is substantial, the market faces notable constraints, particularly in initial investment barriers for small to mid-sized enterprises. Many businesses struggle to allocate funds for comprehensive deployment, which may deter them from transitioning to virtualization solutions. Additionally, existing legacy applications might require significant adaptations to function properly in a virtualized environment, creating further hesitance among potential adopters who are cautious of operational disruptions.
Indonesia Desktop Virtualization Market Trends
Current trends within the Indonesia Desktop Virtualization Market reveal a growing emphasis on automation and cloud-based solutions. As businesses strive for greater agility, many are exploring hybrid solutions that combine on-premises infrastructure with cloud technology. Furthermore, the rise in remote work is catalyzing the development of user-friendly interfaces and enhanced collaboration tools that support virtual teamwork, making desktop virtualization an integral part of modern business operations.
Indonesia Desktop Virtualization Market Opportunities
As digital transformation accelerates, opportunities abound for investment in advanced desktop virtualization technologies. Companies looking to improve their scalability and reduce hardware costs can benefit immensely from adopting these solutions. Additionally, sectors such as education and healthcare are increasingly looking to virtualization to enhance accessibility and operational flexibility, opening up new avenues for vendors to tap into untapped markets.
Government Initiatives in the Indonesia Desktop Virtualization Market
The Indonesian government is actively promoting digitalization initiatives that encourage businesses to adopt modern technology, including desktop virtualization. Public spending on IT infrastructure and initiatives aimed at improving cybersecurity are paving the way for increased investments in virtualization solutions. Support programs aimed at fostering innovation and digital literacy further bolster the environment for the desktop virtualization market.
Future Insights of the Indonesia Desktop Virtualization Market
Looking ahead to 2026-2032, the Indonesia Desktop Virtualization Market is expected to continue its upward trajectory, driven by technological advancements and evolving business needs. As organizations increasingly prioritize flexibility and security, the demand for virtual desktop solutions will grow. Companies that capitalize on the integration of AI and machine learning into their virtualization offerings may find themselves at the forefront of innovation, leading the charge in an ever-competitive landscape.
Indonesia Desktop Virtualization Market Latest Developments (May 2025 - June 2026)
Recent industry direction indicates a surge in collaborative partnerships among technology firms, aimed at enhancing virtualization solutions through integrated platforms. New product releases focusing on user experience and security enhancements are becoming more commonplace as vendors respond to customer demands. Additionally, a growing interest in remote work policies has spurred companies to explore virtualization as a means of providing employees with secure and efficient access to company resources.
Indonesia Desktop Virtualization Market - Key Attractiveness of the Report
- 10 Years of Market Numbers
- Historical Data Starting from 2022 to 2025
- Base Year: 2025
- Forecast Data until 2032
- Key Performance Indicators Impacting the Market
- Major Upcoming Developments and Projects
Key Highlights of the Report:
- Indonesia Desktop Virtualization Market Outlook
- Market Size of Indonesia Desktop Virtualization Market, 2025
- Forecast of Indonesia Desktop Virtualization Market, 2032F
- Historical Data and Forecast of Indonesia Desktop Virtualization Revenues & Volume for the Period 2022-2032F
- Indonesia Desktop Virtualization Market Trend Evolution
- Indonesia Desktop Virtualization Market Drivers and Challenges
- Indonesia Desktop Virtualization Price Trends
- Indonesia Desktop Virtualization Porter's Five Forces
- Indonesia Desktop Virtualization Industry Life Cycle
- Historical Data and Forecast of Indonesia Desktop Virtualization Market Revenues & Volume By Desktop Delivery Platform for the Period 2022-2032F
- Historical Data and Forecast of Indonesia Desktop Virtualization Market Revenues & Volume By Hosted Virtual Desktop (HVD) for the Period 2022-2032F
- Historical Data and Forecast of Indonesia Desktop Virtualization Market Revenues & Volume By Hosted Shared Desktop (HSD) for the Period 2022-2032F
- Historical Data and Forecast of Indonesia Desktop Virtualization Market Revenues & Volume By Other Desktop Delivery Platforms for the Period 2022-2032F
- Historical Data and Forecast of Indonesia Desktop Virtualization Market Revenues & Volume By Deployment Mode for the Period 2022-2032F
- Historical Data and Forecast of Indonesia Desktop Virtualization Market Revenues & Volume By On-premise for the Period 2022-2032F
- Historical Data and Forecast of Indonesia Desktop Virtualization Market Revenues & Volume By Cloud-Based for the Period 2022-2032F
- Historical Data and Forecast of Indonesia Desktop Virtualization Market Revenues & Volume By End-users for the Period 2022-2032F
- Historical Data and Forecast of Indonesia Desktop Virtualization Market Revenues & Volume By Financial Services for the Period 2022-2032F
- Historical Data and Forecast of Indonesia Desktop Virtualization Market Revenues & Volume By Healthcare for the Period 2022-2032F
- Historical Data and Forecast of Indonesia Desktop Virtualization Market Revenues & Volume By Manufacturing for the Period 2022-2032F
- Historical Data and Forecast of Indonesia Desktop Virtualization Market Revenues & Volume By IT and Telecommunications for the Period 2022-2032F
- Historical Data and Forecast of Indonesia Desktop Virtualization Market Revenues & Volume By Other End-user Verticals for the Period 2022-2032F
- Indonesia Desktop Virtualization Import Export Trade Statistics
- Market Opportunity Assessment By Desktop Delivery Platform
- Market Opportunity Assessment By Deployment Mode
- Market Opportunity Assessment By End-users
- Indonesia Desktop Virtualization Top Companies Market Share
- Indonesia Desktop Virtualization Competitive Benchmarking By Technical and Operational Parameters
- Indonesia Desktop Virtualization Company Profiles
- Indonesia Desktop Virtualization Key Strategic Recommendations
Indonesia Desktop Virtualization Market - Frequently Asked Questions
The market is estimated at USD 222 Million in 2025, with projections indicating it will reach USD 293 Million by 2032, growing at a CAGR of 4.0% during the period from 2026 to 2032.
Major drivers include the need for cost savings on hardware, enhanced security measures, and the demand for flexible work arrangements that facilitate remote access to applications.
Many organizations may need to evaluate and potentially modify legacy applications to ensure compatibility with virtualized environments. This often requires strategic planning and resource allocation to mitigate disruptions during the transition.
Sectors such as education and healthcare are poised to benefit significantly due to the need for increased accessibility and flexibility, along with enhanced security for sensitive data.
The Indonesian government promotes digitalization initiatives through public spending on IT infrastructure and programs aimed at improving cybersecurity, thereby creating a conducive environment for virtualization solutions.
6Wresearch actively monitors the Indonesia Desktop Virtualization Market and publishes its comprehensive annual report, highlighting emerging trends, growth drivers, revenue analysis, and forecast outlook. Our insights help businesses to make data-backed strategic decisions with ongoing market dynamics. Our analysts track relevent industries related to the Indonesia Desktop Virtualization Market, allowing our clients with actionable intelligence and reliable forecasts tailored to emerging regional needs.
Yes, we provide customisation as per your requirements. To learn more, feel free to contact us on sales@6wresearch.com
1 Executive Summary |
2 Introduction |
2.1 Key Highlights of the Report |
2.2 Report Description |
2.3 Market Scope & Segmentation |
2.4 Research Methodology |
2.5 Assumptions |
3 Indonesia Desktop Virtualization Market Overview |
3.1 Indonesia Country Macro Economic Indicators |
3.2 Indonesia Desktop Virtualization Market Revenues & Volume, 2022 & 2032F |
3.3 Indonesia Desktop Virtualization Market - Industry Life Cycle |
3.4 Indonesia Desktop Virtualization Market - Porter's Five Forces |
3.5 Indonesia Desktop Virtualization Market Revenues & Volume Share, By Desktop Delivery Platform, 2022 & 2032F |
3.6 Indonesia Desktop Virtualization Market Revenues & Volume Share, By Deployment Mode, 2022 & 2032F |
3.7 Indonesia Desktop Virtualization Market Revenues & Volume Share, By End-users, 2022 & 2032F |
4 Indonesia Desktop Virtualization Market Dynamics |
4.1 Impact Analysis |
4.2 Market Drivers |
4.3 Market Restraints |
5 Indonesia Desktop Virtualization Market Trends |
6 Indonesia Desktop Virtualization Market, By Types |
6.1 Indonesia Desktop Virtualization Market, By Desktop Delivery Platform |
6.1.1 Overview and Analysis |
6.1.2 Indonesia Desktop Virtualization Market Revenues & Volume, By Desktop Delivery Platform, 2022-2032F |
6.1.3 Indonesia Desktop Virtualization Market Revenues & Volume, By Hosted Virtual Desktop (HVD), 2022-2032F |
6.1.4 Indonesia Desktop Virtualization Market Revenues & Volume, By Hosted Shared Desktop (HSD), 2022-2032F |
6.1.5 Indonesia Desktop Virtualization Market Revenues & Volume, By Other Desktop Delivery Platforms, 2022-2032F |
6.2 Indonesia Desktop Virtualization Market, By Deployment Mode |
6.2.1 Overview and Analysis |
6.2.2 Indonesia Desktop Virtualization Market Revenues & Volume, By On-premise, 2022-2032F |
6.2.3 Indonesia Desktop Virtualization Market Revenues & Volume, By Cloud-Based, 2022-2032F |
6.3 Indonesia Desktop Virtualization Market, By End-users |
6.3.1 Overview and Analysis |
6.3.2 Indonesia Desktop Virtualization Market Revenues & Volume, By Financial Services, 2022-2032F |
6.3.3 Indonesia Desktop Virtualization Market Revenues & Volume, By Healthcare, 2022-2032F |
6.3.4 Indonesia Desktop Virtualization Market Revenues & Volume, By Manufacturing, 2022-2032F |
6.3.5 Indonesia Desktop Virtualization Market Revenues & Volume, By IT and Telecommunications, 2022-2032F |
6.3.6 Indonesia Desktop Virtualization Market Revenues & Volume, By Other End-user Verticals, 2022-2032F |
7 Indonesia Desktop Virtualization Market Import-Export Trade Statistics |
7.1 Indonesia Desktop Virtualization Market Export to Major Countries |
7.2 Indonesia Desktop Virtualization Market Imports from Major Countries |
8 Indonesia Desktop Virtualization Market Key Performance Indicators |
9 Indonesia Desktop Virtualization Market - Opportunity Assessment |
9.1 Indonesia Desktop Virtualization Market Opportunity Assessment, By Desktop Delivery Platform, 2022 & 2032F |
9.2 Indonesia Desktop Virtualization Market Opportunity Assessment, By Deployment Mode, 2022 & 2032F |
9.3 Indonesia Desktop Virtualization Market Opportunity Assessment, By End-users, 2022 & 2032F |
10 Indonesia Desktop Virtualization Market - Competitive Landscape |
10.1 Indonesia Desktop Virtualization Market Revenue Share, By Companies, 2025 |
10.2 Indonesia Desktop Virtualization Market Competitive Benchmarking, By Operating and Technical Parameters |
11 Company Profiles |
12 Recommendations |
13 Disclaimer |
Global Go To Market Strategy - 2030
Export potential enables firms to identify high-growth global markets with greater confidence by combining advanced trade intelligence with a structured quantitative methodology. The framework analyzes emerging demand trends and country-level import patterns while integrating macroeconomic and trade datasets such as GDP and population forecasts, bilateral import–export flows, tariff structures, elasticity differentials between developed and developing economies, geographic distance, and import demand projections. Using weighted trade values from 2020–2024 as the base period to project country-to-country export potential for 2030, these inputs are operationalized through calculated drivers such as gravity model parameters, tariff impact factors, and projected GDP per-capita growth. Through an analysis of hidden potentials, demand hotspots, and market conditions that are most favorable to success, this method enables firms to focus on target countries, maximize returns, and global expansion with data, backed by accuracy.
By factoring in the projected importer demand gap that is currently unmet and could be potential opportunity, it identifies the potential for the Exporter (Country) among 190 countries, against the general trade analysis, which identifies the biggest importer or exporter.
To discover high-growth global markets and optimize your business strategy:
Click Here
Pricing
- Single User License$ 1,995
- Department License$ 2,400
- Site License$ 3,120
- Global License$ 3,795

Leadership Perspectives from Industry Events
Search
Thought Leadership and Analyst Meet


Our Clients
6WResearch In News
- India Air Conditioner Market Set for Strong Rebound in 2026 After Weather-Led Correction and GST-Driven Recovery: 6Wresearch
- ADAS in India: How Automatic Emergency Braking, Blind Spot Detection & Driver Monitoring are Transforming Road Safety
- Doha a strategic location for EV manufacturing hub: IPA Qatar
- Demand for luxury TVs surging in the GCC, says Samsung
- Empowering Growth: The Thriving Journey of Bangladesh’s Cable Industry
- Demand for luxury TVs surging in the GCC, says Samsung
Latest Reports
- Nicaragua RPG Gaming Market (2026-2032)
- New Zealand RPG Gaming Market (2026-2032)
- Netherlands RPG Gaming Market (2026-2032)
- Nauru RPG Gaming Market (2026-2032)
- Namibia RPG Gaming Market (2026-2032)
- Mozambique RPG Gaming Market (2026-2032)
- Montenegro RPG Gaming Market (2026-2032)
- Mongolia RPG Gaming Market (2026-2032)
- Monaco RPG Gaming Market (2026-2032)
- Micronesia RPG Gaming Market (2026-2032)
Industry Events and Analyst Meet

HIMTEX 2026

India Refining Summit 2026

India EV Show 2026

EV tech India Expo 2026

Auto Tech Asia 2026
Whitepaper
- Middle East & Africa Commercial Security Market Click here to view more.
- Middle East & Africa Fire Safety Systems & Equipment Market Click here to view more.
- GCC Drone Market Click here to view more.
- Middle East Lighting Fixture Market Click here to view more.
- GCC Physical & Perimeter Security Market Click here to view more.