Indonesia Drive Wire Market (2026-2032) Outlook | Analysis, Share, Growth, Revenue, Forecast, Companies, Trends, Industry, Value & Size
Market Forecast By Application (Brake, Park, Shift, Steer, Throttle), By Sensor (Brake Pedal, Throttle Position, Park, Gearshift, Handwheel, Pinion), By Vehicle (On & Off-Highway, BEV, PHEV, FCEV, Autonomous) And Competitive Landscape
| Product Code: ETC4567709 | Publication Date: Jul 2023 | Updated Date: Mar 2026 | Product Type: Report | |
| Publisher: 6Wresearch | Author: Ravi Bhandari | No. of Pages: 85 | No. of Figures: 45 | No. of Tables: 25 |
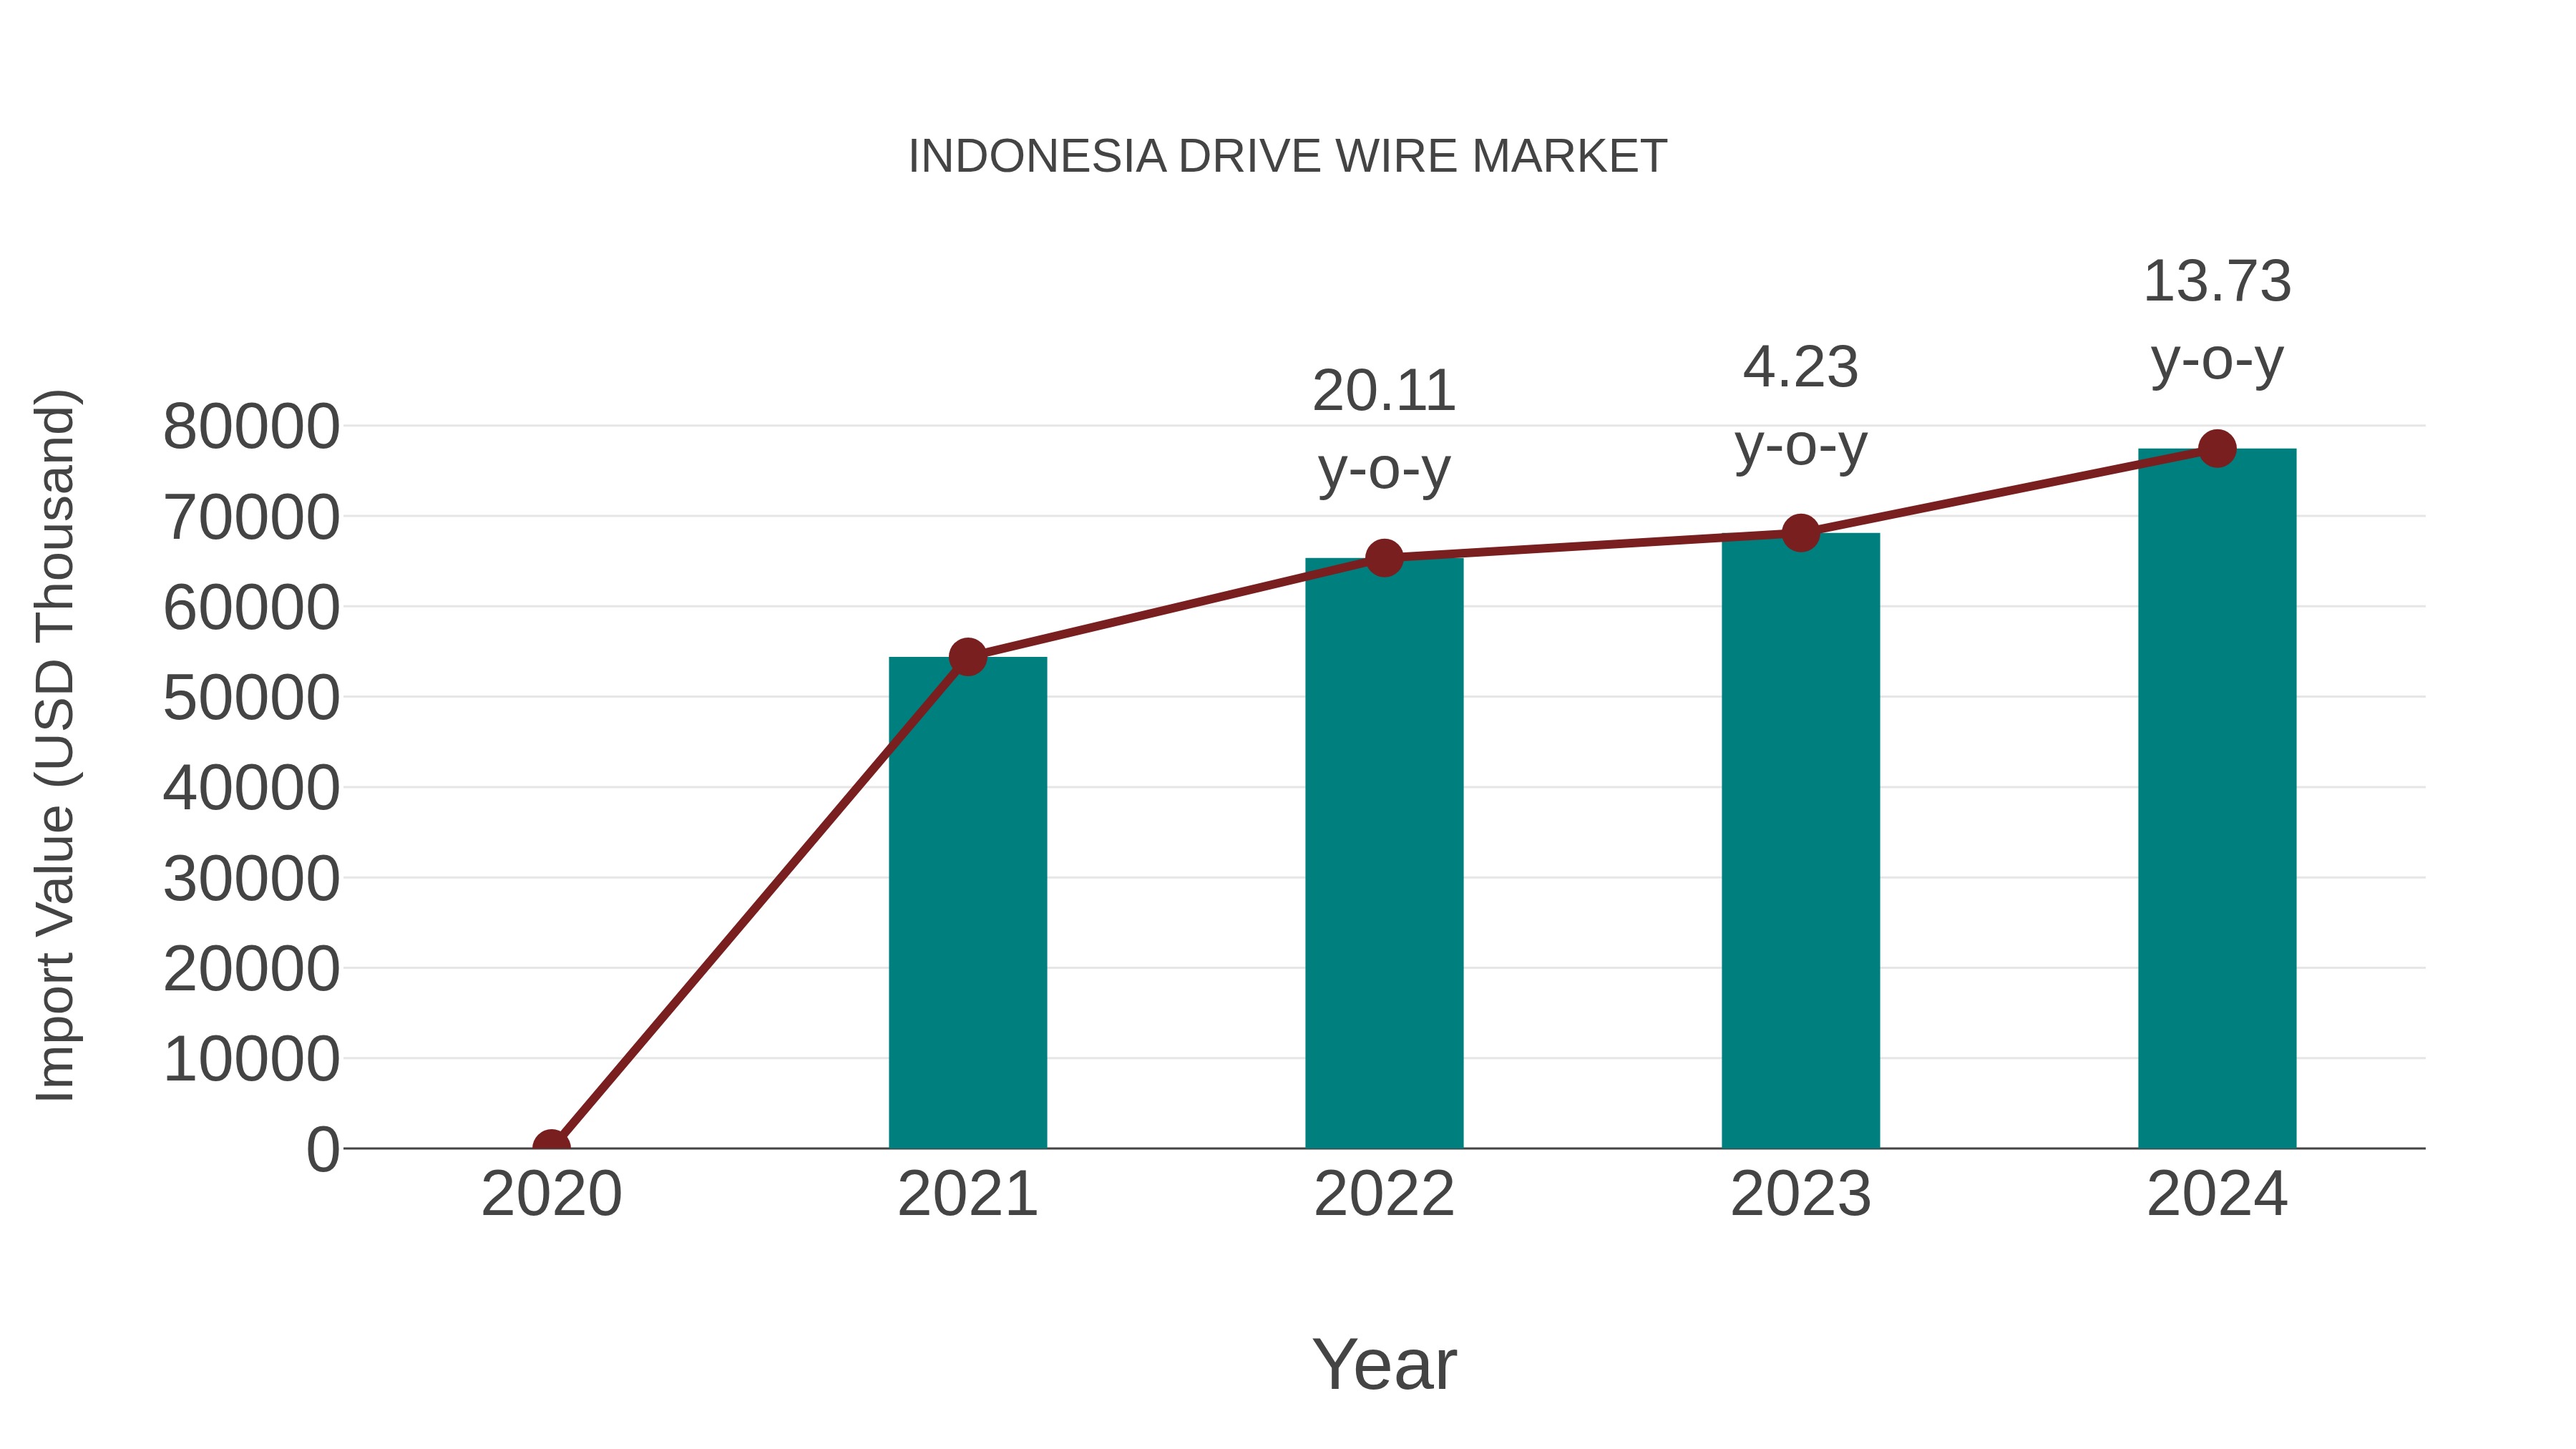
Indonesia Drive Wire Market: Import Trend Analysis
In the Indonesia drive wire market, import trends showed a notable growth rate of 13.73% from 2023 to 2024, with a compound annual growth rate (CAGR) of 12.5% for the period of 2020-2024. This upward import momentum can be attributed to increased demand for drive wire components in Indonesia`s automotive and manufacturing sectors, indicating a sustained market stability and robust trade activity during this period.
Indonesia Drive Wire Market Overview
Drive wires are essential in the automotive industry, enabling the transfer of power within vehicles. This market supports vehicle functionality and performance.
Drivers of the Market
Drive wire technology is poised to play a crucial role in the advancement of electric and hybrid vehicles in Indonesia. This technology, which involves the integration of advanced wiring systems for vehicle propulsion, contributes to higher efficiency and improved overall performance. As the demand for electrified vehicles rises, the drive wire market is expected to be a key driver in shaping the electric vehicle landscape in Indonesia.
Challenges of the Market
A challenge in the drive wire market is achieving durability and reliability in harsh environmental conditions. Vehicles in Indonesia often face challenging road and weather conditions, so ensuring the longevity and performance of drive wires can be demanding.
COVID-19 Impacts on the Market
The drive wire market in Indonesia experienced challenges during the pandemic as the automotive sector faced disruptions in production and supply chain activities.
Key Players of the Makret
The drive wire market in Indonesia has garnered attention from key players like PT Gunung Raja Paksi Tbk and PT Hanafindo Prima. Drive wire systems are essential components of modern vehicles, contributing to safety and performance improvements.
Key Highlights of the Report:
- Indonesia Drive Wire Market Outlook
- Market Size of Indonesia Drive Wire Market, 2025
- Forecast of Indonesia Drive Wire Market, 2032
- Historical Data and Forecast of Indonesia Drive Wire Revenues & Volume for the Period 2022-2032F
- Indonesia Drive Wire Market Trend Evolution
- Indonesia Drive Wire Market Drivers and Challenges
- Indonesia Drive Wire Price Trends
- Indonesia Drive Wire Porter's Five Forces
- Indonesia Drive Wire Industry Life Cycle
- Historical Data and Forecast of Indonesia Drive Wire Market Revenues & Volume By Application for the Period 2022-2032F
- Historical Data and Forecast of Indonesia Drive Wire Market Revenues & Volume By Brake for the Period 2022-2032F
- Historical Data and Forecast of Indonesia Drive Wire Market Revenues & Volume By Park for the Period 2022-2032F
- Historical Data and Forecast of Indonesia Drive Wire Market Revenues & Volume By Shift for the Period 2022-2032F
- Historical Data and Forecast of Indonesia Drive Wire Market Revenues & Volume By Steer for the Period 2022-2032F
- Historical Data and Forecast of Indonesia Drive Wire Market Revenues & Volume By Throttle for the Period 2022-2032F
- Historical Data and Forecast of Indonesia Drive Wire Market Revenues & Volume By Sensor for the Period 2022-2032F
- Historical Data and Forecast of Indonesia Drive Wire Market Revenues & Volume By Brake Pedal for the Period 2022-2032F
- Historical Data and Forecast of Indonesia Drive Wire Market Revenues & Volume By Throttle Position for the Period 2022-2032F
- Historical Data and Forecast of Indonesia Drive Wire Market Revenues & Volume By Park for the Period 2022-2032F
- Historical Data and Forecast of Indonesia Drive Wire Market Revenues & Volume By Gearshift for the Period 2022-2032F
- Historical Data and Forecast of Indonesia Drive Wire Market Revenues & Volume By Handwheel for the Period 2022-2032F
- Historical Data and Forecast of Indonesia Drive Wire Market Revenues & Volume By Pinion for the Period 2022-2032F
- Historical Data and Forecast of Indonesia Drive Wire Market Revenues & Volume By Vehicle for the Period 2022-2032F
- Historical Data and Forecast of Indonesia Drive Wire Market Revenues & Volume By On & Off-Highway for the Period 2022-2032F
- Historical Data and Forecast of Indonesia Drive Wire Market Revenues & Volume By BEV for the Period 2022-2032F
- Historical Data and Forecast of Indonesia Drive Wire Market Revenues & Volume By PHEV for the Period 2022-2032F
- Historical Data and Forecast of Indonesia Drive Wire Market Revenues & Volume By FCEV for the Period 2022-2032F
- Historical Data and Forecast of Indonesia Drive Wire Market Revenues & Volume By Autonomous for the Period 2022-2032F
- Indonesia Drive Wire Import Export Trade Statistics
- Market Opportunity Assessment By Application
- Market Opportunity Assessment By Sensor
- Market Opportunity Assessment By Vehicle
- Indonesia Drive Wire Top Companies Market Share
- Indonesia Drive Wire Competitive Benchmarking By Technical and Operational Parameters
- Indonesia Drive Wire Company Profiles
- Indonesia Drive Wire Key Strategic Recommendations
Indonesia Drive Wire Market (2026-2032): FAQs
6Wresearch actively monitors the Indonesia Drive Wire Market and publishes its comprehensive annual report, highlighting emerging trends, growth drivers, revenue analysis, and forecast outlook. Our insights help businesses to make data-backed strategic decisions with ongoing market dynamics. Our analysts track relevent industries related to the Indonesia Drive Wire Market, allowing our clients with actionable intelligence and reliable forecasts tailored to emerging regional needs.
Yes, we provide customisation as per your requirements. To learn more, feel free to contact us on sales@6wresearch.com
1 Executive Summary |
2 Introduction |
2.1 Key Highlights of the Report |
2.2 Report Description |
2.3 Market Scope & Segmentation |
2.4 Research Methodology |
2.5 Assumptions |
3 Indonesia Drive Wire Market Overview |
3.1 Indonesia Country Macro Economic Indicators |
3.2 Indonesia Drive Wire Market Revenues & Volume, 2022 & 2032F |
3.3 Indonesia Drive Wire Market - Industry Life Cycle |
3.4 Indonesia Drive Wire Market - Porter's Five Forces |
3.5 Indonesia Drive Wire Market Revenues & Volume Share, By Application, 2022 & 2032F |
3.6 Indonesia Drive Wire Market Revenues & Volume Share, By Sensor, 2022 & 2032F |
3.7 Indonesia Drive Wire Market Revenues & Volume Share, By Vehicle, 2022 & 2032F |
4 Indonesia Drive Wire Market Dynamics |
4.1 Impact Analysis |
4.2 Market Drivers |
4.2.1 Increasing demand for automobiles in Indonesia |
4.2.2 Growing construction and infrastructure projects in the country |
4.2.3 Rise in industrial activities leading to higher demand for drive wires |
4.3 Market Restraints |
4.3.1 Fluctuating raw material prices affecting production costs |
4.3.2 Competition from alternative drive technologies |
4.3.3 Economic uncertainties impacting consumer spending and investment |
5 Indonesia Drive Wire Market Trends |
6 Indonesia Drive Wire Market, By Types |
6.1 Indonesia Drive Wire Market, By Application |
6.1.1 Overview and Analysis |
6.1.2 Indonesia Drive Wire Market Revenues & Volume, By Application, 2022-2032F |
6.1.3 Indonesia Drive Wire Market Revenues & Volume, By Brake, 2022-2032F |
6.1.4 Indonesia Drive Wire Market Revenues & Volume, By Park, 2022-2032F |
6.1.5 Indonesia Drive Wire Market Revenues & Volume, By Shift, 2022-2032F |
6.1.6 Indonesia Drive Wire Market Revenues & Volume, By Steer, 2022-2032F |
6.1.7 Indonesia Drive Wire Market Revenues & Volume, By Throttle, 2022-2032F |
6.2 Indonesia Drive Wire Market, By Sensor |
6.2.1 Overview and Analysis |
6.2.2 Indonesia Drive Wire Market Revenues & Volume, By Brake Pedal, 2022-2032F |
6.2.3 Indonesia Drive Wire Market Revenues & Volume, By Throttle Position, 2022-2032F |
6.2.4 Indonesia Drive Wire Market Revenues & Volume, By Park, 2022-2032F |
6.2.5 Indonesia Drive Wire Market Revenues & Volume, By Gearshift, 2022-2032F |
6.2.6 Indonesia Drive Wire Market Revenues & Volume, By Handwheel, 2022-2032F |
6.2.7 Indonesia Drive Wire Market Revenues & Volume, By Pinion, 2022-2032F |
6.3 Indonesia Drive Wire Market, By Vehicle |
6.3.1 Overview and Analysis |
6.3.2 Indonesia Drive Wire Market Revenues & Volume, By On & Off-Highway, 2022-2032F |
6.3.3 Indonesia Drive Wire Market Revenues & Volume, By BEV, 2022-2032F |
6.3.4 Indonesia Drive Wire Market Revenues & Volume, By PHEV, 2022-2032F |
6.3.5 Indonesia Drive Wire Market Revenues & Volume, By FCEV, 2022-2032F |
6.3.6 Indonesia Drive Wire Market Revenues & Volume, By Autonomous, 2022-2032F |
7 Indonesia Drive Wire Market Import-Export Trade Statistics |
7.1 Indonesia Drive Wire Market Export to Major Countries |
7.2 Indonesia Drive Wire Market Imports from Major Countries |
8 Indonesia Drive Wire Market Key Performance Indicators |
8.1 Number of new vehicle registrations in Indonesia |
8.2 Construction project expenditure in the country |
8.3 Industrial output growth rate |
8.4 Percentage of drive wire market penetration in key industries |
8.5 Average production cost per unit of drive wire |
9 Indonesia Drive Wire Market - Opportunity Assessment |
9.1 Indonesia Drive Wire Market Opportunity Assessment, By Application, 2022 & 2032F |
9.2 Indonesia Drive Wire Market Opportunity Assessment, By Sensor, 2022 & 2032F |
9.3 Indonesia Drive Wire Market Opportunity Assessment, By Vehicle, 2022 & 2032F |
10 Indonesia Drive Wire Market - Competitive Landscape |
10.1 Indonesia Drive Wire Market Revenue Share, By Companies, 2025 |
10.2 Indonesia Drive Wire Market Competitive Benchmarking, By Operating and Technical Parameters |
11 Company Profiles |
12 Recommendations |
13 Disclaimer |
Export potential assessment - trade Analytics for 2030
Export potential enables firms to identify high-growth global markets with greater confidence by combining advanced trade intelligence with a structured quantitative methodology. The framework analyzes emerging demand trends and country-level import patterns while integrating macroeconomic and trade datasets such as GDP and population forecasts, bilateral import–export flows, tariff structures, elasticity differentials between developed and developing economies, geographic distance, and import demand projections. Using weighted trade values from 2020–2024 as the base period to project country-to-country export potential for 2030, these inputs are operationalized through calculated drivers such as gravity model parameters, tariff impact factors, and projected GDP per-capita growth. Through an analysis of hidden potentials, demand hotspots, and market conditions that are most favorable to success, this method enables firms to focus on target countries, maximize returns, and global expansion with data, backed by accuracy.
By factoring in the projected importer demand gap that is currently unmet and could be potential opportunity, it identifies the potential for the Exporter (Country) among 190 countries, against the general trade analysis, which identifies the biggest importer or exporter.
To discover high-growth global markets and optimize your business strategy:
Click Here
Pricing
- Single User License$ 1,995
- Department License$ 2,400
- Site License$ 3,120
- Global License$ 3,795

Search
Thought Leadership and Analyst Meet


Our Clients
Latest Reports
- Taiwan Food Delivery Platform Market (2026-2032) | Companies, Outlook, Analysis, Trends, Value, Revenue, Segmentation, Share, Forecast, Competitive Landscape, Growth, Size & Forecast
- United Kingdom (UK) Long-term Care Insurance Market (2026-2032) | Growth, Share, Consumer Insights, Drivers, Opportunities, Competition, Pricing Analysis, Segments, Restraints, Companies, Competitive, Value, Outlook, Size, Demand, Analysis, Challenges, Strategic Insights, Investment Trends, Revenue, Trends, Supply, Forecast
- United Kingdom (UK) Long Term Care Market (2026-2032) | Companies, Outlook, Analysis, Trends, Value, Revenue, Segmentation, Share, Forecast, Competitive Landscape, Growth, Size & Forecast
- Iraq Insulation and Waterproofing Market (2026-2032) | Outlook, Drivers, Growth, Size, Share, Industry, Revenue, Trends, Demand, Competitive, Strategic Insights, Opportunities, Segments, Companies, Challenges, Strategy, Consumer Insights, Analysis, Investment Trends, Value, Segmentation, Forecast, Restraints
- India Switchgear Market Outlook (2026-2032) | Size, Share, Trends, Growth, Revenue, Forecast, Analysis, Value, Outlook
- Pakistan Contraceptive Implants Market (2025-2031) | Demand, Growth, Size, Share, Industry, Pricing Analysis, Competitive, Strategic Insights, Strategy, Consumer Insights, Analysis, Investment Trends, Opportunities, Revenue, Segments, Value, Segmentation, Supply, Forecast, Restraints, Outlook, Competition, Drivers, Trends, Companies, Challenges
- Sri Lanka Packaging Market (2026-2032) | Outlook, Competition, Drivers, Trends, Demand, Pricing Analysis, Competitive, Strategic Insights, Companies, Challenges, Strategy, Consumer Insights, Analysis, Investment Trends, Opportunities, Growth, Size, Share, Industry, Revenue, Segments, Value, Segmentation, Supply, Forecast, Restraints
- India Kids Watches Market (2026-2032) | Strategy, Consumer Insights, Analysis, Investment Trends, Opportunities, Growth, Size, Share, Industry, Revenue, Segments, Value, Segmentation, Supply, Forecast, Restraints, Outlook, Competition, Drivers, Trends, Demand, Pricing Analysis, Competitive, Strategic Insights, Companies, Challenges
- Saudi Arabia Core Assurance Service Market (2025-2031) | Strategy, Consumer Insights, Analysis, Investment Trends, Opportunities, Growth, Size, Share, Industry, Revenue, Segments, Value, Segmentation, Supply, Forecast, Restraints, Outlook, Competition, Drivers, Trends, Demand, Pricing Analysis, Competitive, Strategic Insights, Companies, Challenges
- Romania Uninterruptible Power Supply (UPS) Market (2026-2032) | Industry, Analysis, Revenue, Size, Forecast, Outlook, Value, Trends, Share, Growth & Companies
Industry Events and Analyst Meet

India EV Show 2026

EV tech India Expo 2026

Auto Tech Asia 2026

Battery Tech India 2026

Smart Production Solutions Guangzhou 2026
Whitepaper
- Middle East & Africa Commercial Security Market Click here to view more.
- Middle East & Africa Fire Safety Systems & Equipment Market Click here to view more.
- GCC Drone Market Click here to view more.
- Middle East Lighting Fixture Market Click here to view more.
- GCC Physical & Perimeter Security Market Click here to view more.
6WResearch In News
- Doha a strategic location for EV manufacturing hub: IPA Qatar
- Demand for luxury TVs surging in the GCC, says Samsung
- Empowering Growth: The Thriving Journey of Bangladesh’s Cable Industry
- Demand for luxury TVs surging in the GCC, says Samsung
- Video call with a traditional healer? Once unthinkable, it’s now common in South Africa
- Intelligent Buildings To Smooth GCC’s Path To Net Zero