Indonesia Ferric Nitrate Market (2026-2032) Outlook | Size, Industry, Analysis, Share, Companies, Revenue, Value, Trends, Forecast & Growth
Market Forecast By Type (Laboratory Grade, Industrial Grade), By Applications (Catalyzer, Analytical Reagent, Chemical Polishing) And Competitive Landscape
| Product Code: ETC200560 | Publication Date: Jul 2023 | Updated Date: Jul 2026 | Product Type: Market Research Report | |
| Publisher: 6Wresearch | Author: Ravi Bhandari | No. of Pages: 60 | No. of Figures: 40 | No. of Tables: 7 |
Indonesia Ferric Nitrate Market Size, Share & Growth Rate
The Indonesia Ferric Nitrate Market was estimated at USD 432 Million in 2025 and is projected to reach USD 572 Million by 2032, growing at a CAGR of 4.1% from 2026 to 2032. This growth trajectory is largely driven by increasing demand from end-use sectors such as agriculture, pharmaceuticals, and electronics, where ferric nitrate is valued for its versatility and functional properties. Moreover, the push towards sustainable agricultural practices and innovative chemical applications is expected to further bolster market prospects in the coming years.
Indonesia Ferric Nitrate Market Growth Rate Analysis (2021-2032)
The Indonesian Ferric Nitrate market has shown a promising turnaround following a slight decline of 0.3% in 2021. The market rebounded with growth of 4.6% in 2022, driven by increasing demand from the agricultural and wastewater treatment sectors. This upward trend accelerated further, reaching 5.2% in 2023 and projected to continue at a robust pace, with estimates of 5.5% in 2024 and 5.8% by 2030. Drivers such as advancements in manufacturing technologies and government incentives aimed at sustainable industrial practices are fueling investment and capacity expansion. Additionally, heightened consumer awareness regarding environmental impacts is reshaping demand dynamics, ensuring sustained growth through to 2032.
Indonesia Ferric Nitrate Market Year-wise Growth Rate and Key Drivers
This graph highlights how the Indonesia Ferric Nitrate Market has steadily grown over the past five years, supported by major growth factors.
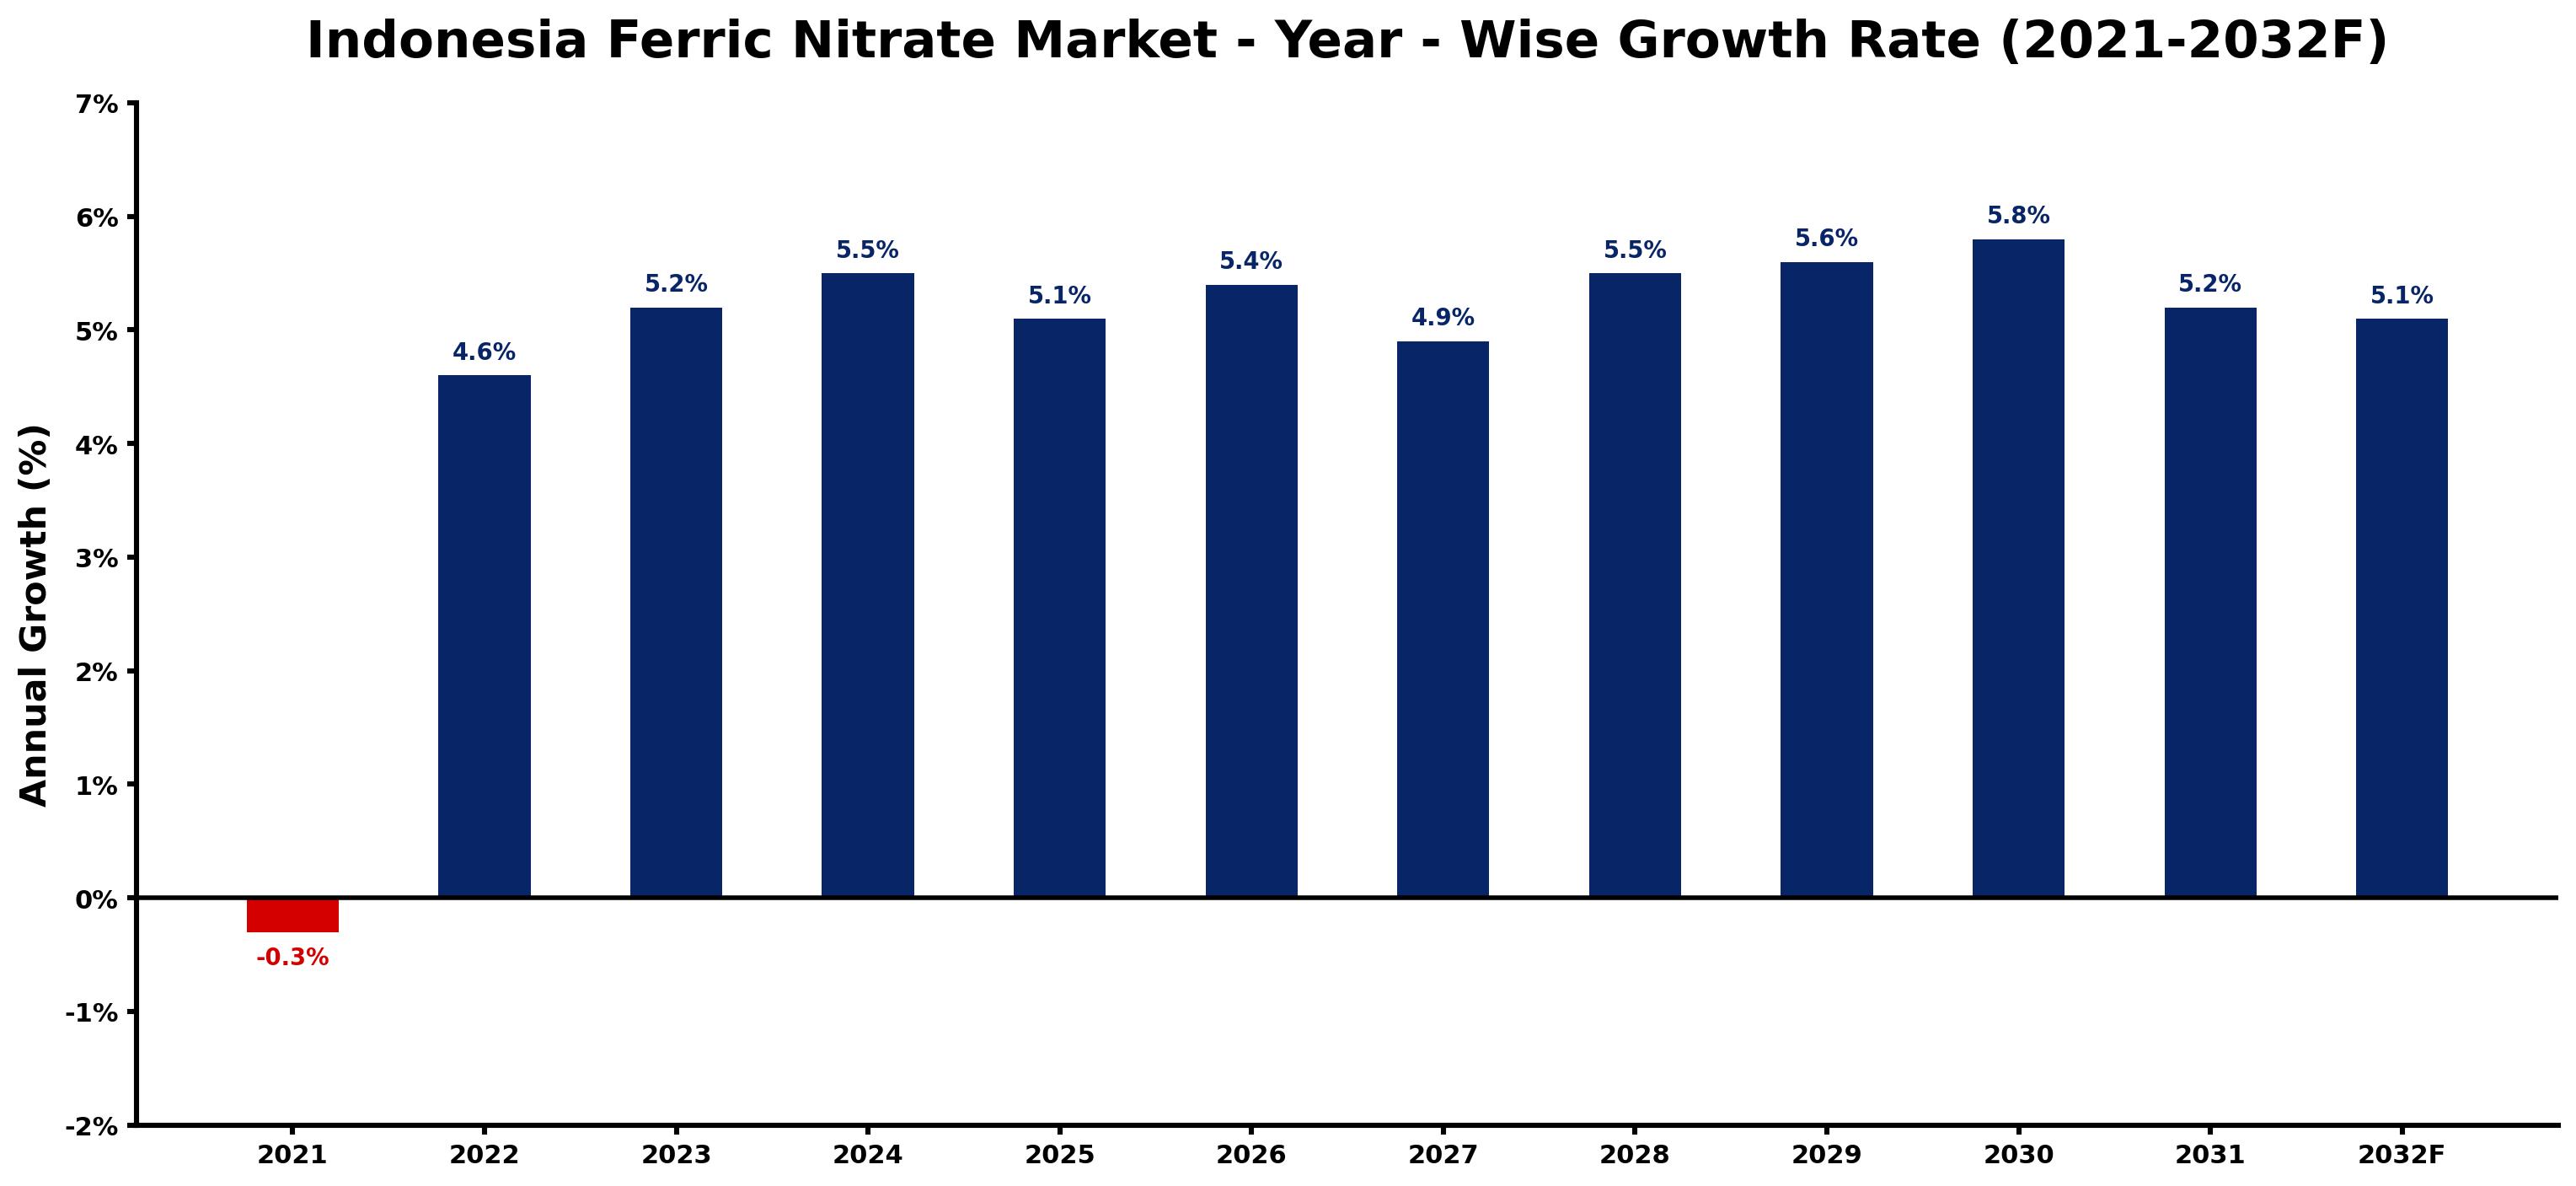
The table below presents the year‑wise growth rates along with the key drivers influencing the market
| Year | Growth Rate | Major Drivers |
| 2021 | -0.3% | decreased industrial production activities |
| 2022 | 4.6% | growing agricultural sector investments |
| 2023 | 5.2% | increased environmental regulations compliance |
| 2024 | 5.5% | rising demand from pharmaceuticals sector |
| 2025 | 5.1% | expansion in specialty chemicals market |
| 2026 | 5.4% | growing awareness of sustainable practices |
| 2027 | 4.9% | increased adoption in water treatment |
| 2028 | 5.5% | expansion of electronics manufacturing base |
| 2029 | 5.6% | growing demand from food industry |
| 2030 | 5.8% | increased investment in infrastructure projects |
| 2031 | 5.2% | rising applications in construction materials |
| 2032 | 5.1% | growing research and development initiatives |
Note: Market size estimations and growth projections presented in this report are based on 6Wresearch's proprietary forecasting methodology, utilizing the latest available industry data, government publications, and primary research inputs.
Indonesia Ferric Nitrate Market Synopsis
The Indonesia ferric nitrate market is characterized by a robust and expanding base of applications, notably in fertilizers and wastewater treatment. Its high solubility in water and effectiveness as an oxidizing agent has led to widespread usage across various industries. As urbanization accelerates, the demand for quality chemicals like ferric nitrate continues to rise.
Moreover, with increasing technological advancements, the scope of ferric nitrate applications is broadening. This compound's role in improving product shelf life and enhancing agricultural yield adds a layer of significance in an increasingly eco-conscious market. Therefore, the ferric nitrate market in Indonesia is poised for substantial growth.
Indonesia Ferric Nitrate Market Key Takeaways
- Growing demand from agriculture and pharmaceuticals is driving market expansion.
- Technological advancements are creating new applications for ferric nitrate.
- Urbanization trends enhance the need for efficient chemical solutions.
- Government initiatives focusing on renewable energy and sustainable practices support market growth.
- Research & development continue to unveil new benefits and applications of ferric nitrate.
Evaluation of Restraints in Indonesia Ferric Nitrate Market
While the Indonesian ferric nitrate market holds significant potential, it faces specific constraints that could hinder its growth. Stringent regulations imposed by governmental authorities regarding environmental protection can slow down the commercialization processes, which may impact profitability. Additionally, the awareness gap regarding the advantages of ferric nitrate among smaller enterprises presents a challenge. This lack of knowledge can limit market penetration and adoption, ultimately stalling broader growth.
Indonesia Ferric Nitrate Market Trends
The current trends influencing the Indonesia ferric nitrate market include the increasing emphasis on sustainable agricultural practices and the ongoing innovation in chemical manufacturing processes. The burgeoning electric vehicle market also drives the need for high-quality chemicals used in battery production and materials. Furthermore, the health and wellness trend in pharmaceuticals has spurred a demand for efficient reagents that can improve blood quality and enhance crop yields, further reinforcing the market's position.
Indonesia Ferric Nitrate Market Opportunities
The potential for growth in the Indonesia ferric nitrate market is notable, particularly in agricultural applications and industrial wastewater treatment. Expanding research and development activities can uncover novel uses and formulations that cater to emerging market needs. Additionally, investment in local manufacturing capabilities could enhance supply chain resilience while reducing dependence on imports. There is also an opportunity for collaboration with local agricultural firms to develop customized fertilizer blends, thus driving demand.
Government Initiatives in the Indonesia Ferric Nitrate Market
The Indonesian government has been proactive in promoting sustainable energy consumption and environmentally friendly agricultural practices, both of which align with the use of ferric nitrate. Policies encouraging the use of renewable resources and investments in clean technologies are likely to benefit industries relying on ferric nitrate. Moreover, public spending on agriculture and industrial development may facilitate access to essential chemicals, further boosting market growth.
Future Insights of the Indonesia Ferric Nitrate Market
Looking ahead to 2026-2032, the Indonesia ferric nitrate market is expected to expand substantially as various sectors evolve to meet modern demands. The ongoing trend towards sustainability, along with innovation in chemical applications, will significantly shape market dynamics. The integration of technology in agricultural practices and industrial processes is likely to create new revenue streams, while an increased focus on environmental stewardship will resonate with consumers and policymakers alike.
Indonesia Ferric Nitrate Market Latest Developments (2025 - 2026)
Recent developments in the Indonesia ferric nitrate market have centered around advancements in production techniques, aiming to enhance efficiency and reduce environmental impact. Companies are also exploring collaborative efforts to leverage the compound's properties for innovative applications, particularly within the agricultural and manufacturing sectors. As market players continue to adapt to evolving demands, the importance of research and development remains at the forefront of their strategies.
Indonesia Ferric Nitrate Market - Key Attractiveness of the Report
- 10 Years of Market Numbers
- Historical Data Starting from 2022 to 2025
- Base Year: 2025
- Forecast Data until 2032
- Key Performance Indicators Impacting the Market
- Major Upcoming Developments and Projects
Key Highlights of the Report:
- Indonesia Ferric Nitrate Market Outlook
- Market Size of Indonesia Ferric Nitrate Market, 2025
- Forecast of Indonesia Ferric Nitrate Market, 2032
- Historical Data and Forecast of Indonesia Ferric Nitrate Revenues & Volume for the Period 2022-2032F
- Indonesia Ferric Nitrate Market Trend Evolution
- Indonesia Ferric Nitrate Market Drivers and Challenges
- Indonesia Ferric Nitrate Price Trends
- Indonesia Ferric Nitrate Porter's Five Forces
- Indonesia Ferric Nitrate Industry Life Cycle
- Historical Data and Forecast of Indonesia Ferric Nitrate Market Revenues & Volume By Type for the Period 2022-2032F
- Historical Data and Forecast of Indonesia Ferric Nitrate Market Revenues & Volume By Laboratory Grade for the Period 2022-2032F
- Historical Data and Forecast of Indonesia Ferric Nitrate Market Revenues & Volume By Industrial Grade for the Period 2022-2032F
- Historical Data and Forecast of Indonesia Ferric Nitrate Market Revenues & Volume By Applications for the Period 2022-2032F
- Historical Data and Forecast of Indonesia Ferric Nitrate Market Revenues & Volume By Catalyzer for the Period 2022-2032F
- Historical Data and Forecast of Indonesia Ferric Nitrate Market Revenues & Volume By Analytical Reagent for the Period 2022-2032F
- Historical Data and Forecast of Indonesia Ferric Nitrate Market Revenues & Volume By Chemical Polishing for the Period 2022-2032F
- Indonesia Ferric Nitrate Import Export Trade Statistics
- Market Opportunity Assessment By Type
- Market Opportunity Assessment By Applications
- Indonesia Ferric Nitrate Top Companies Market Share
- Indonesia Ferric Nitrate Competitive Benchmarking By Technical and Operational Parameters
- Indonesia Ferric Nitrate Company Profiles
- Indonesia Ferric Nitrate Key Strategic Recommendations
Frequently Asked Questions About the Market Study (FAQs):
The key applications driving demand include agriculture, pharmaceuticals, and industrial processes. In particular, the use of ferric nitrate as a fertilizer additive and a reagent in various chemical reactions is crucial.
The Indonesia Ferric Nitrate Market was estimated at USD 432 Million in 2025 and is projected to reach USD 572 Million by 2032, growing at a CAGR of 4.1% from 2026 to 2032. The expansion will be fueled by increased demand across diverse sectors.
Many smaller enterprises lack awareness of the potential advantages and applications of ferric nitrate, which limits their ability to compete effectively in the market. Additionally, stringent environmental regulations can create barriers to entry.
Government initiatives promoting sustainable energy and agricultural practices enhance the market's appeal. These policies create a favorable environment for businesses that utilize ferric nitrate in their operations, fostering growth and innovation.
Yes, current trends include a shift towards sustainable agricultural practices and increased use of ferric nitrate in renewable energy applications. Innovations in chemical processing and formulations are also driving new market opportunities.
6Wresearch actively monitors the Indonesia Ferric Nitrate Market and publishes its comprehensive annual report, highlighting emerging trends, growth drivers, revenue analysis, and forecast outlook. Our insights help businesses to make data-backed strategic decisions with ongoing market dynamics. Our analysts track relevent industries related to the Indonesia Ferric Nitrate Market, allowing our clients with actionable intelligence and reliable forecasts tailored to emerging regional needs.
Yes, we provide customisation as per your requirements. To learn more, feel free to contact us on sales@6wresearch.com
1 Executive Summary |
2 Introduction |
2.1 Key Highlights of the Report |
2.2 Report Description |
2.3 Market Scope & Segmentation |
2.4 Research Methodology |
2.5 Assumptions |
3 Indonesia Ferric Nitrate Market Overview |
3.1 Indonesia Country Macro Economic Indicators |
3.2 Indonesia Ferric Nitrate Market Revenues & Volume, 2022 & 2032F |
3.3 Indonesia Ferric Nitrate Market - Industry Life Cycle |
3.4 Indonesia Ferric Nitrate Market - Porter's Five Forces |
3.5 Indonesia Ferric Nitrate Market Revenues & Volume Share, By Type, 2022 & 2032F |
3.6 Indonesia Ferric Nitrate Market Revenues & Volume Share, By Applications, 2022 & 2032F |
4 Indonesia Ferric Nitrate Market Dynamics |
4.1 Impact Analysis |
4.2 Market Drivers |
4.2.1 Growing demand for ferric nitrate in water treatment applications due to increasing industrial activities in Indonesia. |
4.2.2 Expansion of pharmaceutical and healthcare industries driving the demand for ferric nitrate as a key raw material. |
4.2.3 Rising awareness about environmental pollution leading to the adoption of ferric nitrate in wastewater treatment processes. |
4.3 Market Restraints |
4.3.1 Fluctuating prices of raw materials impacting the production cost of ferric nitrate. |
4.3.2 Stringent regulations and environmental compliances affecting the manufacturing and usage of ferric nitrate in Indonesia. |
5 Indonesia Ferric Nitrate Market Trends |
6 Indonesia Ferric Nitrate Market, By Types |
6.1 Indonesia Ferric Nitrate Market, By Type |
6.1.1 Overview and Analysis |
6.1.2 Indonesia Ferric Nitrate Market Revenues & Volume, By Type, 2022-2032F |
6.1.3 Indonesia Ferric Nitrate Market Revenues & Volume, By Laboratory Grade, 2022-2032F |
6.1.4 Indonesia Ferric Nitrate Market Revenues & Volume, By Industrial Grade, 2022-2032F |
6.2 Indonesia Ferric Nitrate Market, By Applications |
6.2.1 Overview and Analysis |
6.2.2 Indonesia Ferric Nitrate Market Revenues & Volume, By Catalyzer, 2022-2032F |
6.2.3 Indonesia Ferric Nitrate Market Revenues & Volume, By Analytical Reagent, 2022-2032F |
6.2.4 Indonesia Ferric Nitrate Market Revenues & Volume, By Chemical Polishing, 2022-2032F |
7 Indonesia Ferric Nitrate Market Import-Export Trade Statistics |
7.1 Indonesia Ferric Nitrate Market Export to Major Countries |
7.2 Indonesia Ferric Nitrate Market Imports from Major Countries |
8 Indonesia Ferric Nitrate Market Key Performance Indicators |
8.1 Percentage increase in the number of water treatment plants using ferric nitrate. |
8.2 Growth in the number of pharmaceutical companies sourcing ferric nitrate in Indonesia. |
8.3 Percentage decrease in wastewater pollution levels attributed to the use of ferric nitrate in treatment processes. |
9 Indonesia Ferric Nitrate Market - Opportunity Assessment |
9.1 Indonesia Ferric Nitrate Market Opportunity Assessment, By Type, 2022 & 2032F |
9.2 Indonesia Ferric Nitrate Market Opportunity Assessment, By Applications, 2022 & 2032F |
10 Indonesia Ferric Nitrate Market - Competitive Landscape |
10.1 Indonesia Ferric Nitrate Market Revenue Share, By Companies, 2025 |
10.2 Indonesia Ferric Nitrate Market Competitive Benchmarking, By Operating and Technical Parameters |
11 Company Profiles |
12 Recommendations |
13 Disclaimer |
Global Go To Market Strategy - 2030
Export potential enables firms to identify high-growth global markets with greater confidence by combining advanced trade intelligence with a structured quantitative methodology. The framework analyzes emerging demand trends and country-level import patterns while integrating macroeconomic and trade datasets such as GDP and population forecasts, bilateral import–export flows, tariff structures, elasticity differentials between developed and developing economies, geographic distance, and import demand projections. Using weighted trade values from 2020–2024 as the base period to project country-to-country export potential for 2030, these inputs are operationalized through calculated drivers such as gravity model parameters, tariff impact factors, and projected GDP per-capita growth. Through an analysis of hidden potentials, demand hotspots, and market conditions that are most favorable to success, this method enables firms to focus on target countries, maximize returns, and global expansion with data, backed by accuracy.
By factoring in the projected importer demand gap that is currently unmet and could be potential opportunity, it identifies the potential for the Exporter (Country) among 190 countries, against the general trade analysis, which identifies the biggest importer or exporter.
To discover high-growth global markets and optimize your business strategy:
Click Here
Pricing
- Single User License$ 1,995
- Department License$ 2,400
- Site License$ 3,120
- Global License$ 3,795

Leadership Perspectives from Industry Events
Search
Thought Leadership and Analyst Meet


Our Clients
6WResearch In News
- India Air Conditioner Market Set for Strong Rebound in 2026 After Weather-Led Correction and GST-Driven Recovery: 6Wresearch
- ADAS in India: How Automatic Emergency Braking, Blind Spot Detection & Driver Monitoring are Transforming Road Safety
- Doha a strategic location for EV manufacturing hub: IPA Qatar
- Demand for luxury TVs surging in the GCC, says Samsung
- Empowering Growth: The Thriving Journey of Bangladesh’s Cable Industry
- Demand for luxury TVs surging in the GCC, says Samsung
Latest Reports
- Nicaragua RPG Gaming Market (2026-2032)
- New Zealand RPG Gaming Market (2026-2032)
- Netherlands RPG Gaming Market (2026-2032)
- Nauru RPG Gaming Market (2026-2032)
- Namibia RPG Gaming Market (2026-2032)
- Mozambique RPG Gaming Market (2026-2032)
- Montenegro RPG Gaming Market (2026-2032)
- Mongolia RPG Gaming Market (2026-2032)
- Monaco RPG Gaming Market (2026-2032)
- Micronesia RPG Gaming Market (2026-2032)
Industry Events and Analyst Meet

HIMTEX 2026

India Refining Summit 2026

India EV Show 2026

EV tech India Expo 2026

Auto Tech Asia 2026
Whitepaper
- Middle East & Africa Commercial Security Market Click here to view more.
- Middle East & Africa Fire Safety Systems & Equipment Market Click here to view more.
- GCC Drone Market Click here to view more.
- Middle East Lighting Fixture Market Click here to view more.
- GCC Physical & Perimeter Security Market Click here to view more.