Indonesia Fruit Pulp Market (2026-2032) Outlook | Share, Growth, Value, Industry, Trends, Revenue, Forecast, Companies, Analysis & Size
Market Forecast By Fruit Type (Mango, Strawberry, Apple, Guava, Berries, Citrus Fruits, Others), By Form (Liquid, Powder), By Application (Food and Beverages), By Distribution (E-Commerce, Convenience Stores, Supermarkets/Hypermarkets, Specialty Stores, Others) And Competitive Landscape
| Product Code: ETC221668 | Publication Date: Aug 2023 | Updated Date: Mar 2026 | Product Type: Market Research Report | |
| Publisher: 6Wresearch | Author: Ravi Bhandari | No. of Pages: 75 | No. of Figures: 35 | No. of Tables: 20 |
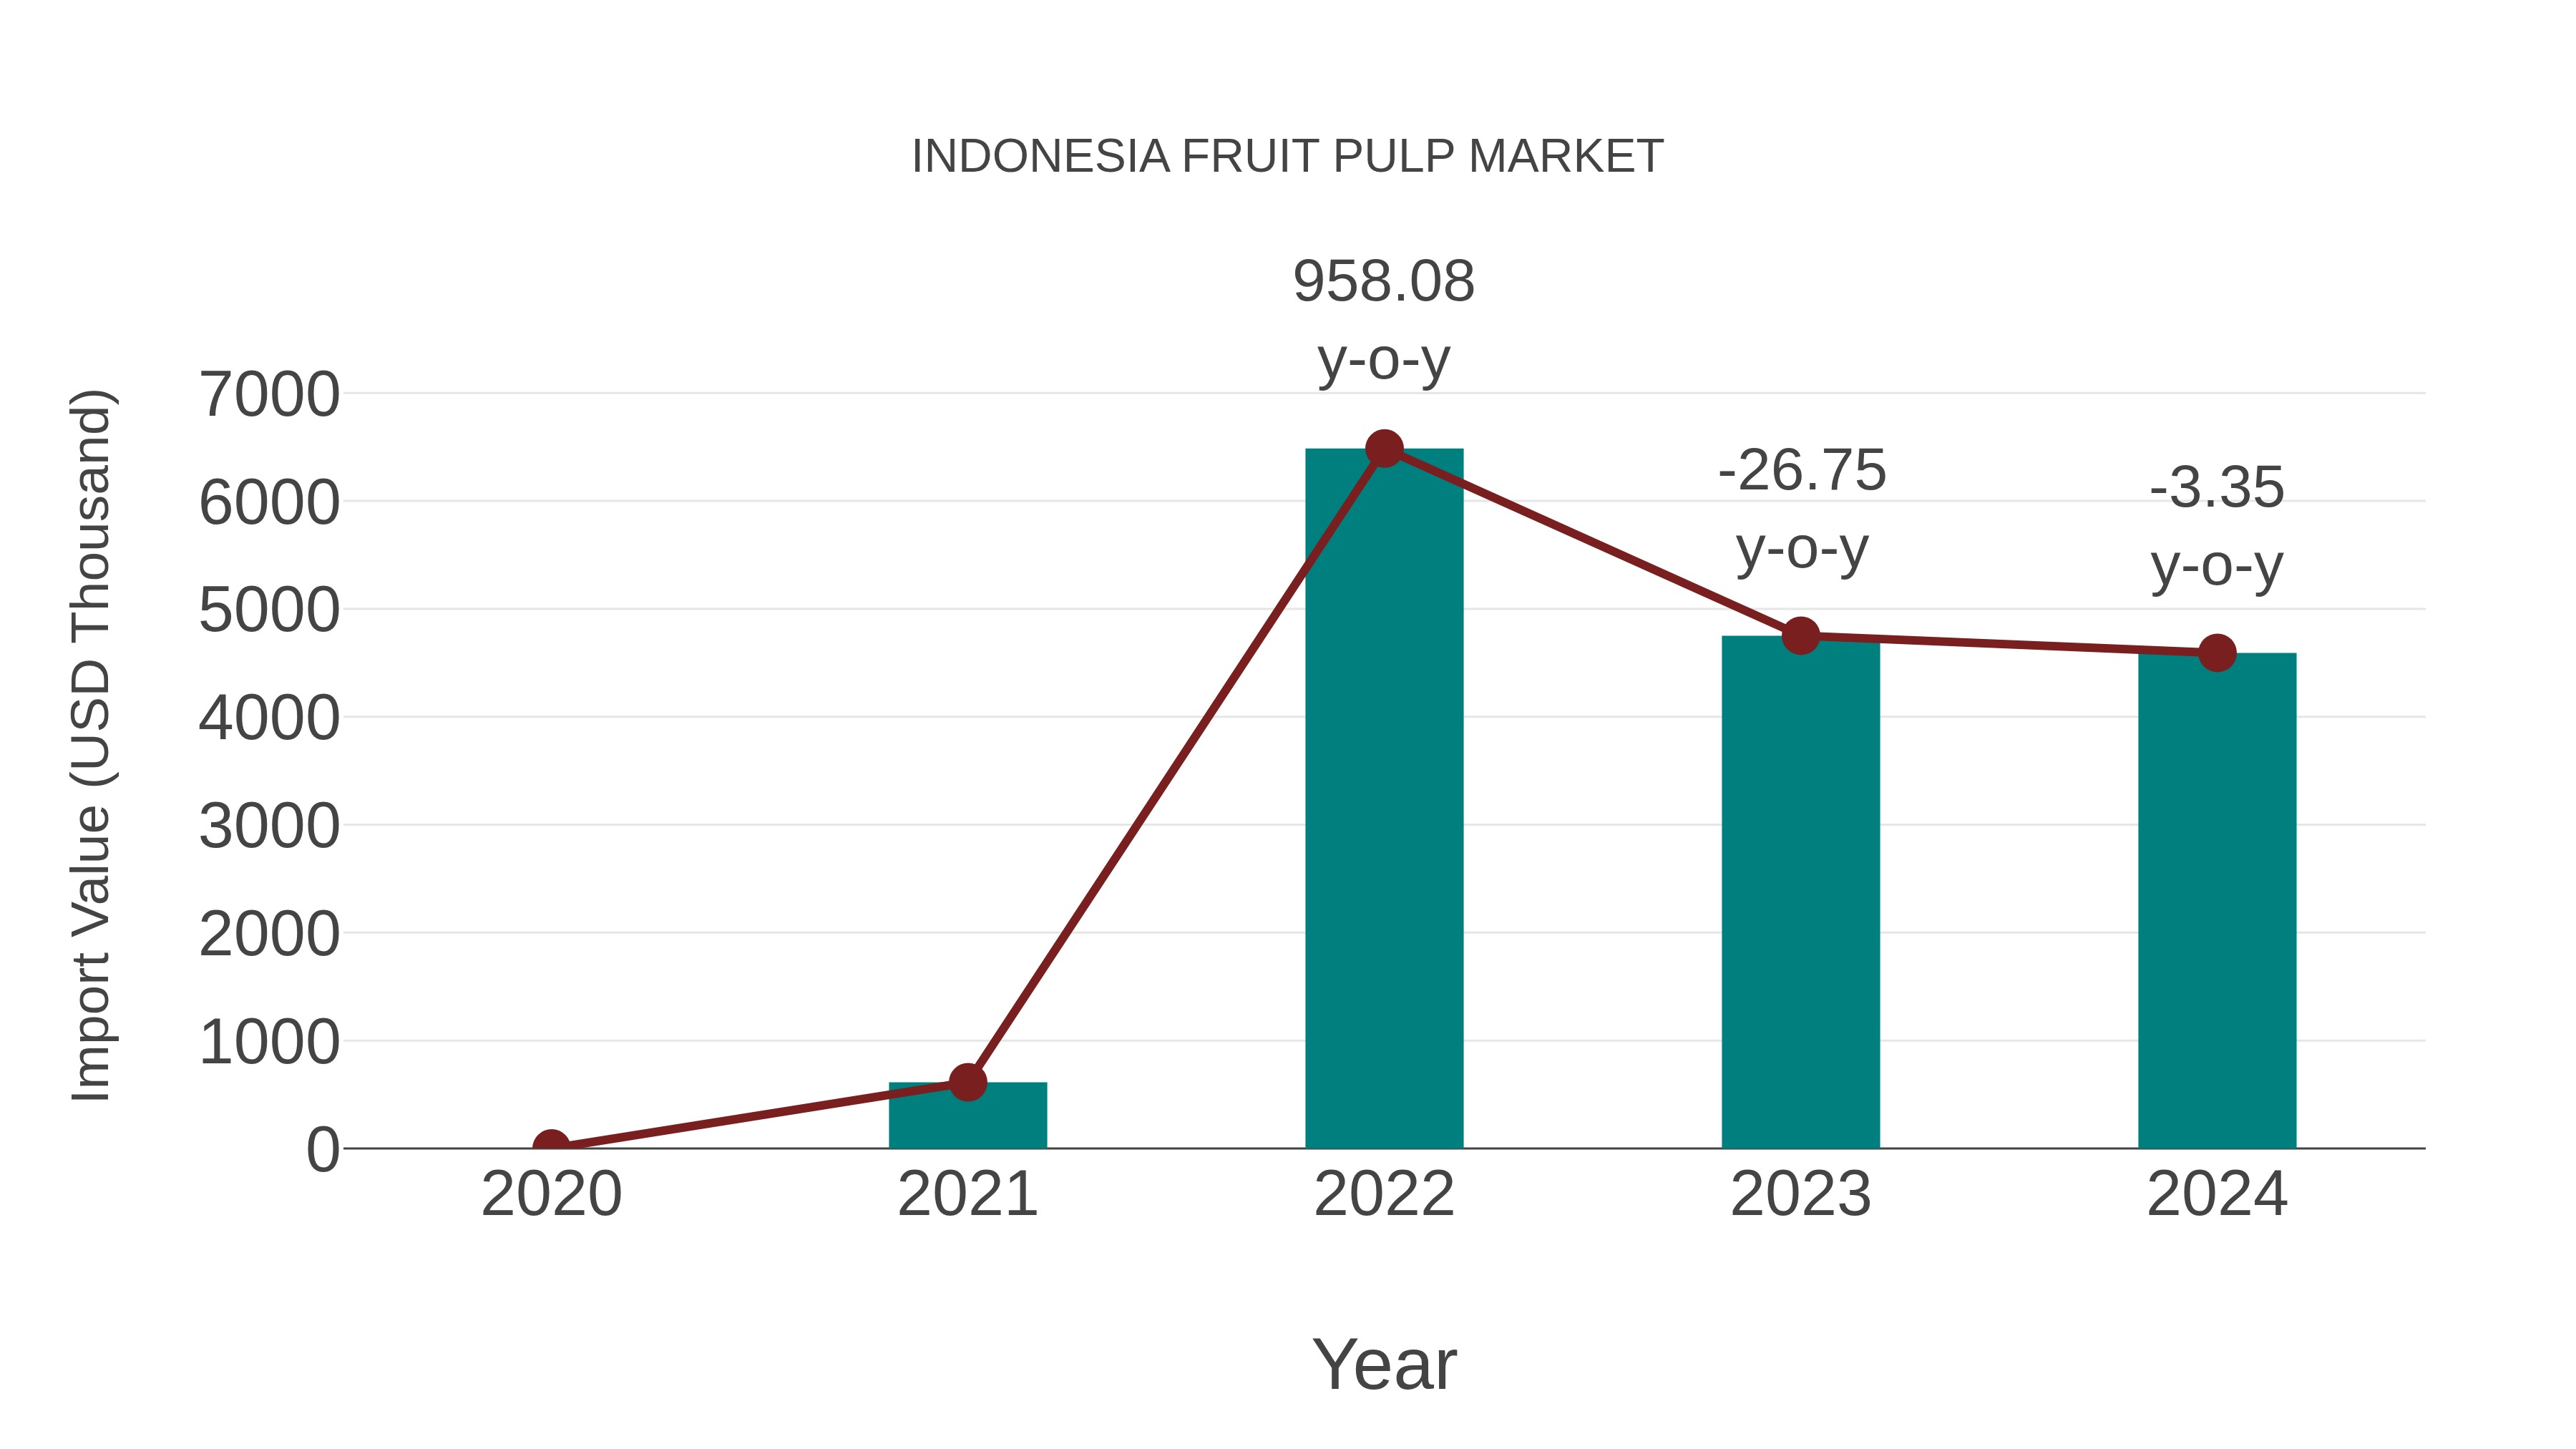
Indonesia Fruit Pulp Market: Import Trend Analysis
In the Indonesia fruit pulp market, the import trend experienced a decline with a growth rate of -3.35% from 2023 to 2024, while the compound annual growth rate (CAGR) for the period of 2020-2024 stood at a high 95.67%. This decline in import momentum could be attributed to shifts in consumer preferences or changes in trade policies impacting market stability.
Indonesia Fruit Pulp Market Synopsis
In parallel, the fruit pulp market in Indonesia has also shown promising growth. Fruit pulp is widely used in the production of jams, jellies, yogurts, and other food products. The demand for fruit-based ingredients in the food industry has boosted the market for fruit pulp.
Drivers of the Market
The fruit pulp market in Indonesia has witnessed a surge in demand owing to its application in multiple food and beverage products. Fruit pulp is used in the preparation of jams, jellies, desserts, and bakery items, contributing to the market`s growth. The convenience of using fruit pulp and its natural appeal have been major factors driving its adoption in the food industry.
Challenges of the Market
Similarly, the fruit pulp market encounters challenges in terms of transportation and logistics. The infrastructure for transporting perishable fruit pulp needs continuous improvement to ensure the freshness and quality of the product when it reaches the end consumer.
COVID-19 Impact on the Market
The fruit pulp market in Indonesia has been witnessing increased demand, primarily from the food and beverage industry for applications in products like desserts, ice creams, and baby food. Despite the positive outlook, the COVID-19 pandemic may have had varying effects on different fruits` availability and processing capabilities, influencing the overall market dynamics.
Key Highlights of the Report:
- Indonesia Fruit Pulp Market Outlook
- Market Size of Indonesia Fruit Pulp Market, 2025
- Forecast of Indonesia Fruit Pulp Market, 2032
- Historical Data and Forecast of Indonesia Fruit Pulp Revenues & Volume for the Period 2022-2032F
- Indonesia Fruit Pulp Market Trend Evolution
- Indonesia Fruit Pulp Market Drivers and Challenges
- Indonesia Fruit Pulp Price Trends
- Indonesia Fruit Pulp Porter's Five Forces
- Indonesia Fruit Pulp Industry Life Cycle
- Historical Data and Forecast of Indonesia Fruit Pulp Market Revenues & Volume By Fruit Type for the Period 2022-2032F
- Historical Data and Forecast of Indonesia Fruit Pulp Market Revenues & Volume By Mango for the Period 2022-2032F
- Historical Data and Forecast of Indonesia Fruit Pulp Market Revenues & Volume By Strawberry for the Period 2022-2032F
- Historical Data and Forecast of Indonesia Fruit Pulp Market Revenues & Volume By Apple for the Period 2022-2032F
- Historical Data and Forecast of Indonesia Fruit Pulp Market Revenues & Volume By Guava for the Period 2022-2032F
- Historical Data and Forecast of Indonesia Fruit Pulp Market Revenues & Volume By Berries for the Period 2022-2032F
- Historical Data and Forecast of Indonesia Fruit Pulp Market Revenues & Volume By Citrus Fruits for the Period 2022-2032F
- Historical Data and Forecast of Indonesia Fruit Pulp Market Revenues & Volume By Others for the Period 2022-2032F
- Historical Data and Forecast of Indonesia Fruit Pulp Market Revenues & Volume By Form for the Period 2022-2032F
- Historical Data and Forecast of Indonesia Fruit Pulp Market Revenues & Volume By Liquid for the Period 2022-2032F
- Historical Data and Forecast of Indonesia Fruit Pulp Market Revenues & Volume By Powder for the Period 2022-2032F
- Historical Data and Forecast of Indonesia Fruit Pulp Market Revenues & Volume By Application for the Period 2022-2032F
- Historical Data and Forecast of Indonesia Fruit Pulp Market Revenues & Volume By Food and Beverages for the Period 2022-2032F
- Historical Data and Forecast of Indonesia Fruit Pulp Market Revenues & Volume By Distribution for the Period 2022-2032F
- Historical Data and Forecast of Indonesia Fruit Pulp Market Revenues & Volume By E-Commerce for the Period 2022-2032F
- Historical Data and Forecast of Indonesia Fruit Pulp Market Revenues & Volume By Convenience Stores for the Period 2022-2032F
- Historical Data and Forecast of Indonesia Fruit Pulp Market Revenues & Volume By Supermarkets/Hypermarkets for the Period 2022-2032F
- Historical Data and Forecast of Indonesia Fruit Pulp Market Revenues & Volume By Specialty Stores for the Period 2022-2032F
- Historical Data and Forecast of Indonesia Fruit Pulp Market Revenues & Volume By Others for the Period 2022-2032F
- Indonesia Fruit Pulp Import Export Trade Statistics
- Market Opportunity Assessment By Fruit Type
- Market Opportunity Assessment By Form
- Market Opportunity Assessment By Application
- Market Opportunity Assessment By Distribution
- Indonesia Fruit Pulp Top Companies Market Share
- Indonesia Fruit Pulp Competitive Benchmarking By Technical and Operational Parameters
- Indonesia Fruit Pulp Company Profiles
- Indonesia Fruit Pulp Key Strategic Recommendations
Indonesia Fruit Pulp Market (2026-2032): FAQs
6Wresearch actively monitors the Indonesia Fruit Pulp Market and publishes its comprehensive annual report, highlighting emerging trends, growth drivers, revenue analysis, and forecast outlook. Our insights help businesses to make data-backed strategic decisions with ongoing market dynamics. Our analysts track relevent industries related to the Indonesia Fruit Pulp Market, allowing our clients with actionable intelligence and reliable forecasts tailored to emerging regional needs.
Yes, we provide customisation as per your requirements. To learn more, feel free to contact us on sales@6wresearch.com
1 Executive Summary |
2 Introduction |
2.1 Key Highlights of the Report |
2.2 Report Description |
2.3 Market Scope & Segmentation |
2.4 Research Methodology |
2.5 Assumptions |
3 Indonesia Fruit Pulp Market Overview |
3.1 Indonesia Country Macro Economic Indicators |
3.2 Indonesia Fruit Pulp Market Revenues & Volume, 2022 & 2032F |
3.3 Indonesia Fruit Pulp Market - Industry Life Cycle |
3.4 Indonesia Fruit Pulp Market - Porter's Five Forces |
3.5 Indonesia Fruit Pulp Market Revenues & Volume Share, By Fruit Type, 2022 & 2032F |
3.6 Indonesia Fruit Pulp Market Revenues & Volume Share, By Form, 2022 & 2032F |
3.7 Indonesia Fruit Pulp Market Revenues & Volume Share, By Application, 2022 & 2032F |
3.8 Indonesia Fruit Pulp Market Revenues & Volume Share, By Distribution, 2022 & 2032F |
4 Indonesia Fruit Pulp Market Dynamics |
4.1 Impact Analysis |
4.2 Market Drivers |
4.2.1 Increasing demand for natural and organic food products |
4.2.2 Growing awareness about the health benefits of consuming fruit pulp |
4.2.3 Rising popularity of fruit-based beverages and food products in Indonesia |
4.3 Market Restraints |
4.3.1 Fluctuating prices of raw materials for fruit pulp production |
4.3.2 Challenges in maintaining the freshness and quality of fruit pulp during transportation and storage |
5 Indonesia Fruit Pulp Market Trends |
6 Indonesia Fruit Pulp Market, By Types |
6.1 Indonesia Fruit Pulp Market, By Fruit Type |
6.1.1 Overview and Analysis |
6.1.2 Indonesia Fruit Pulp Market Revenues & Volume, By Fruit Type, 2022-2032F |
6.1.3 Indonesia Fruit Pulp Market Revenues & Volume, By Mango, 2022-2032F |
6.1.4 Indonesia Fruit Pulp Market Revenues & Volume, By Strawberry, 2022-2032F |
6.1.5 Indonesia Fruit Pulp Market Revenues & Volume, By Apple, 2022-2032F |
6.1.6 Indonesia Fruit Pulp Market Revenues & Volume, By Guava, 2022-2032F |
6.1.7 Indonesia Fruit Pulp Market Revenues & Volume, By Berries, 2022-2032F |
6.1.8 Indonesia Fruit Pulp Market Revenues & Volume, By Citrus Fruits, 2022-2032F |
6.2 Indonesia Fruit Pulp Market, By Form |
6.2.1 Overview and Analysis |
6.2.2 Indonesia Fruit Pulp Market Revenues & Volume, By Liquid, 2022-2032F |
6.2.3 Indonesia Fruit Pulp Market Revenues & Volume, By Powder, 2022-2032F |
6.3 Indonesia Fruit Pulp Market, By Application |
6.3.1 Overview and Analysis |
6.3.2 Indonesia Fruit Pulp Market Revenues & Volume, By Food and Beverages, 2022-2032F |
6.4 Indonesia Fruit Pulp Market, By Distribution |
6.4.1 Overview and Analysis |
6.4.2 Indonesia Fruit Pulp Market Revenues & Volume, By E-Commerce, 2022-2032F |
6.4.3 Indonesia Fruit Pulp Market Revenues & Volume, By Convenience Stores, 2022-2032F |
6.4.4 Indonesia Fruit Pulp Market Revenues & Volume, By Supermarkets/Hypermarkets, 2022-2032F |
6.4.5 Indonesia Fruit Pulp Market Revenues & Volume, By Specialty Stores, 2022-2032F |
6.4.6 Indonesia Fruit Pulp Market Revenues & Volume, By Others, 2022-2032F |
7 Indonesia Fruit Pulp Market Import-Export Trade Statistics |
7.1 Indonesia Fruit Pulp Market Export to Major Countries |
7.2 Indonesia Fruit Pulp Market Imports from Major Countries |
8 Indonesia Fruit Pulp Market Key Performance Indicators |
8.1 Percentage growth in the number of fruit pulp processing facilities in Indonesia |
8.2 Consumer awareness level regarding the nutritional benefits of fruit pulp |
8.3 Percentage increase in the adoption of fruit pulp in various food and beverage applications |
9 Indonesia Fruit Pulp Market - Opportunity Assessment |
9.1 Indonesia Fruit Pulp Market Opportunity Assessment, By Fruit Type, 2022 & 2032F |
9.2 Indonesia Fruit Pulp Market Opportunity Assessment, By Form, 2022 & 2032F |
9.3 Indonesia Fruit Pulp Market Opportunity Assessment, By Application, 2022 & 2032F |
9.4 Indonesia Fruit Pulp Market Opportunity Assessment, By Distribution, 2022 & 2032F |
10 Indonesia Fruit Pulp Market - Competitive Landscape |
10.1 Indonesia Fruit Pulp Market Revenue Share, By Companies, 2025 |
10.2 Indonesia Fruit Pulp Market Competitive Benchmarking, By Operating and Technical Parameters |
11 Company Profiles |
12 Recommendations |
13 Disclaimer |
Global Go To Market Strategy - 2030
Export potential enables firms to identify high-growth global markets with greater confidence by combining advanced trade intelligence with a structured quantitative methodology. The framework analyzes emerging demand trends and country-level import patterns while integrating macroeconomic and trade datasets such as GDP and population forecasts, bilateral import–export flows, tariff structures, elasticity differentials between developed and developing economies, geographic distance, and import demand projections. Using weighted trade values from 2020–2024 as the base period to project country-to-country export potential for 2030, these inputs are operationalized through calculated drivers such as gravity model parameters, tariff impact factors, and projected GDP per-capita growth. Through an analysis of hidden potentials, demand hotspots, and market conditions that are most favorable to success, this method enables firms to focus on target countries, maximize returns, and global expansion with data, backed by accuracy.
By factoring in the projected importer demand gap that is currently unmet and could be potential opportunity, it identifies the potential for the Exporter (Country) among 190 countries, against the general trade analysis, which identifies the biggest importer or exporter.
To discover high-growth global markets and optimize your business strategy:
Click Here
Pricing
- Single User License$ 1,995
- Department License$ 2,400
- Site License$ 3,120
- Global License$ 3,795

Leadership Perspectives from Industry Events
Search
Thought Leadership and Analyst Meet


Our Clients
6WResearch In News
- India Air Conditioner Market Set for Strong Rebound in 2026 After Weather-Led Correction and GST-Driven Recovery: 6Wresearch
- ADAS in India: How Automatic Emergency Braking, Blind Spot Detection & Driver Monitoring are Transforming Road Safety
- Doha a strategic location for EV manufacturing hub: IPA Qatar
- Demand for luxury TVs surging in the GCC, says Samsung
- Empowering Growth: The Thriving Journey of Bangladesh’s Cable Industry
- Demand for luxury TVs surging in the GCC, says Samsung
Latest Reports
- Nicaragua RPG Gaming Market (2026-2032)
- New Zealand RPG Gaming Market (2026-2032)
- Netherlands RPG Gaming Market (2026-2032)
- Nauru RPG Gaming Market (2026-2032)
- Namibia RPG Gaming Market (2026-2032)
- Mozambique RPG Gaming Market (2026-2032)
- Montenegro RPG Gaming Market (2026-2032)
- Mongolia RPG Gaming Market (2026-2032)
- Monaco RPG Gaming Market (2026-2032)
- Micronesia RPG Gaming Market (2026-2032)
Industry Events and Analyst Meet

HIMTEX 2026

India Refining Summit 2026

India EV Show 2026

EV tech India Expo 2026

Auto Tech Asia 2026
Whitepaper
- Middle East & Africa Commercial Security Market Click here to view more.
- Middle East & Africa Fire Safety Systems & Equipment Market Click here to view more.
- GCC Drone Market Click here to view more.
- Middle East Lighting Fixture Market Click here to view more.
- GCC Physical & Perimeter Security Market Click here to view more.